. 2020 Jan 22;40(4):743-768.
doi: 10.1523/JNEUROSCI.1199-19.2019. Epub 2019 Dec 6.

Npas1+-Nkx2.1+ Neurons Are an Integral Part of the Cortico-pallido-cortical Loop

Affiliations

Npas1+-Nkx2.1+ Neurons Are an Integral Part of the Cortico-pallido-cortical Loop

Zachary A Abecassis et al. J Neurosci. .

Abstract

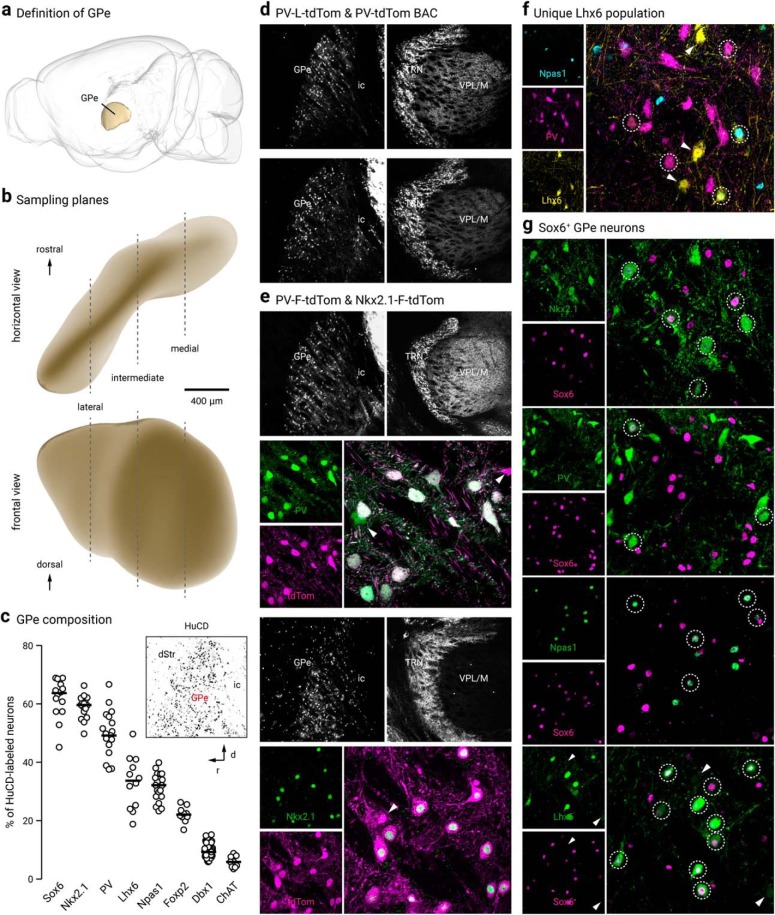
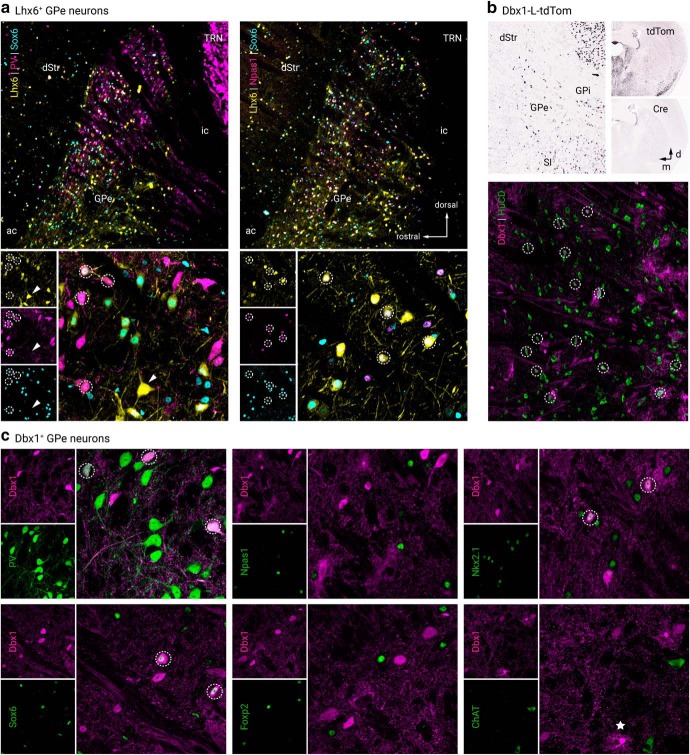
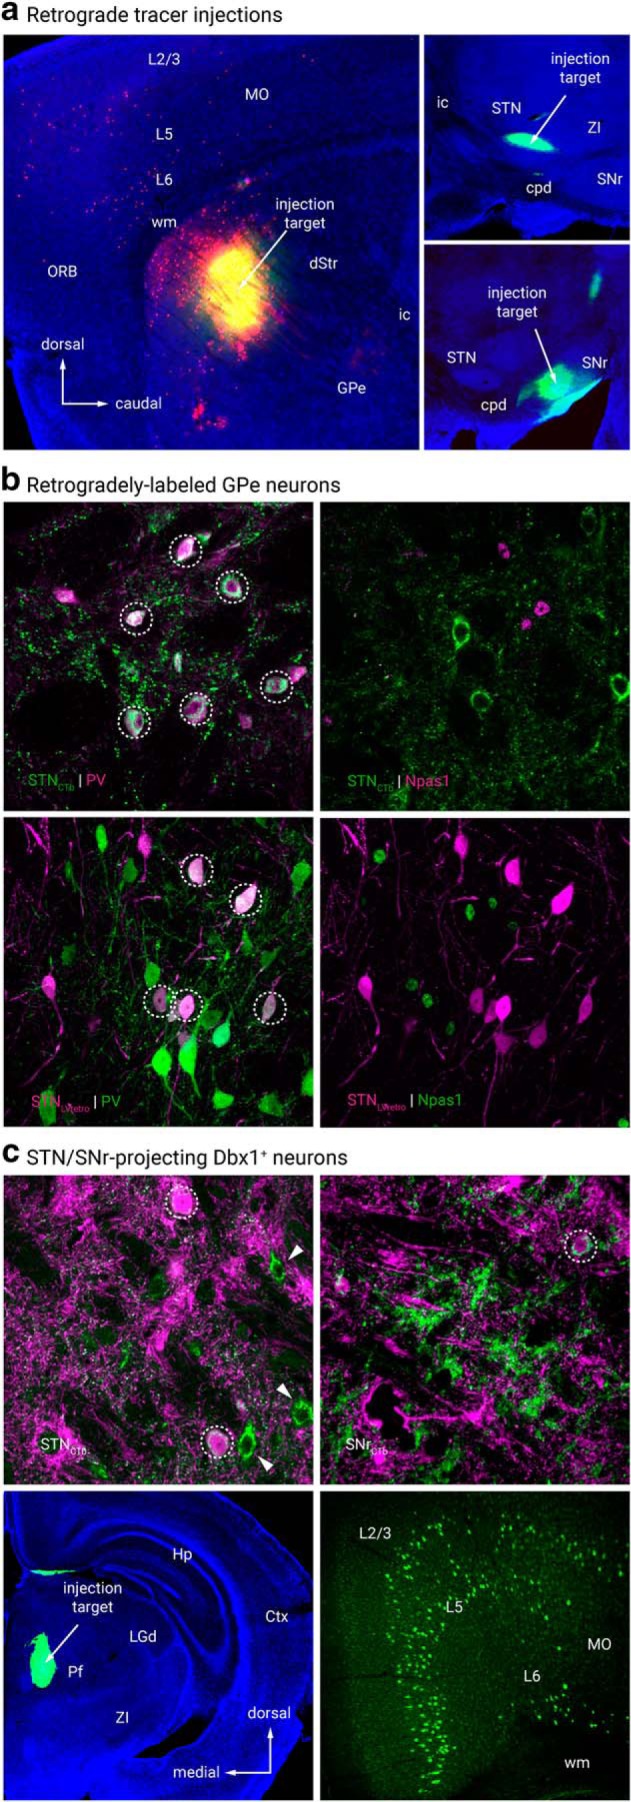
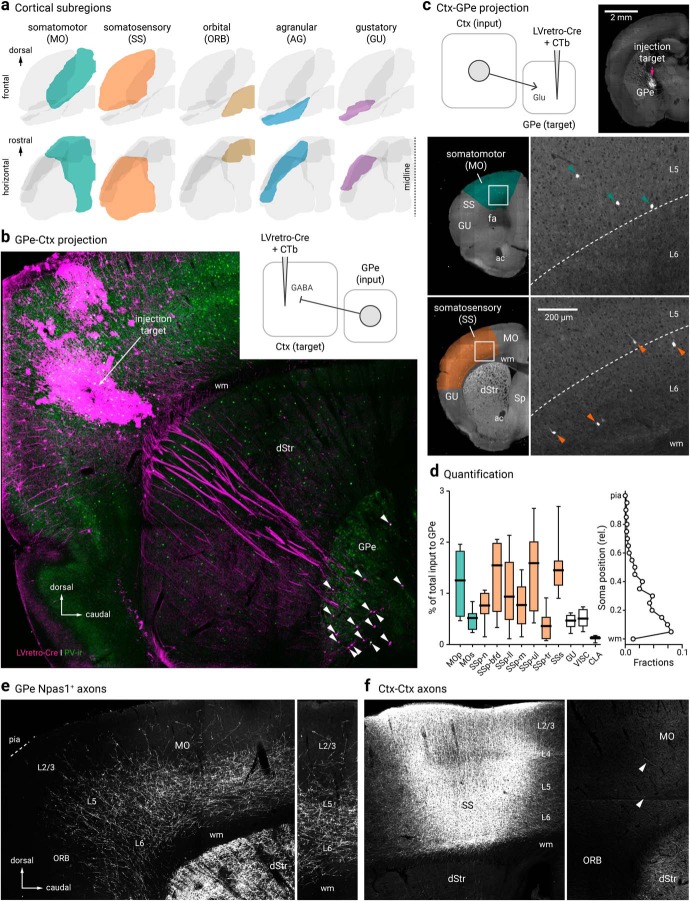
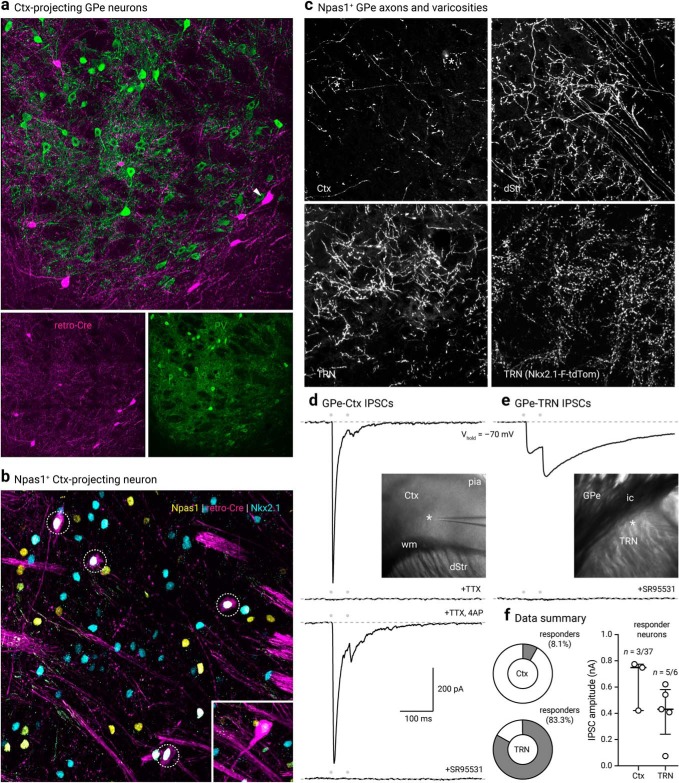
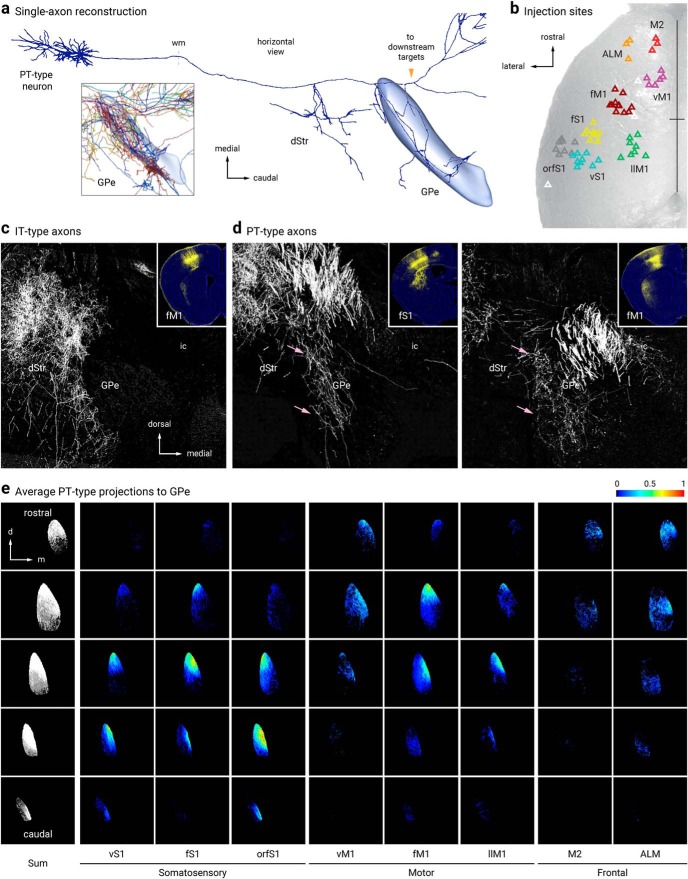
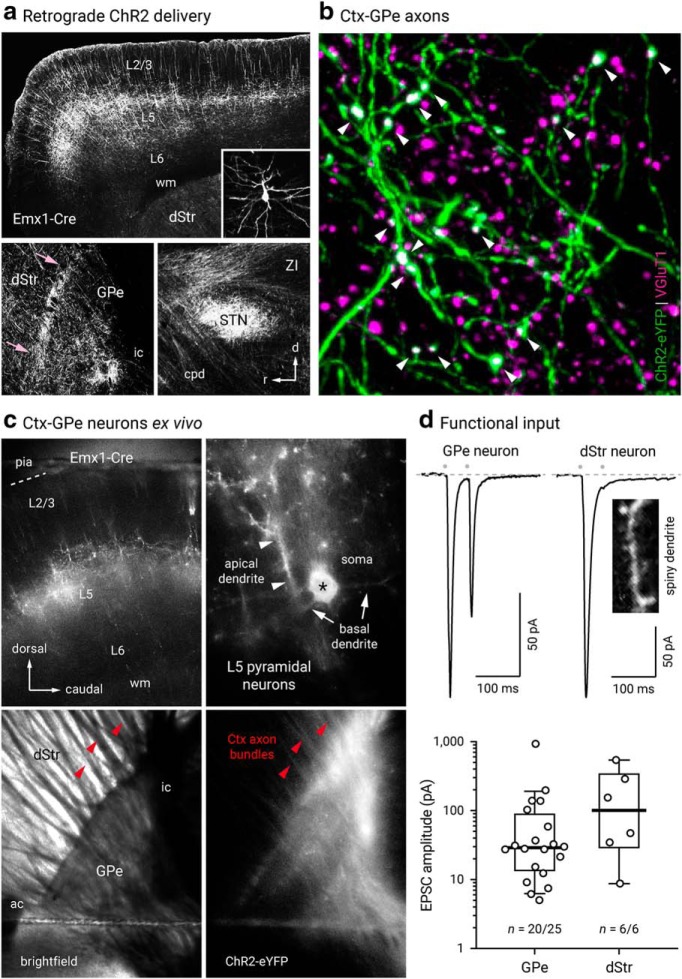
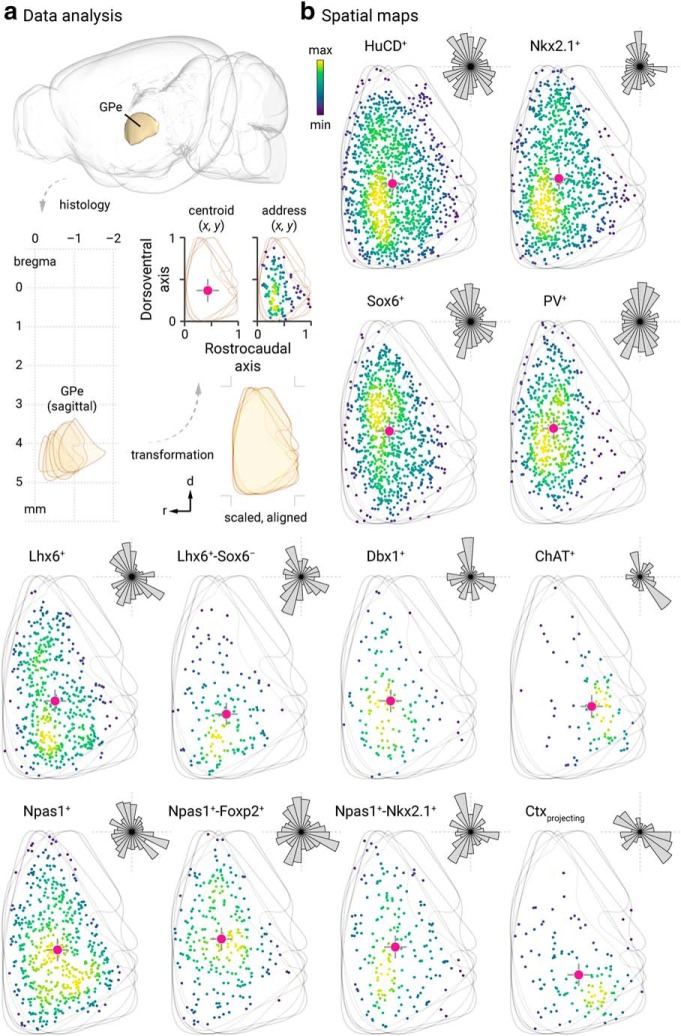
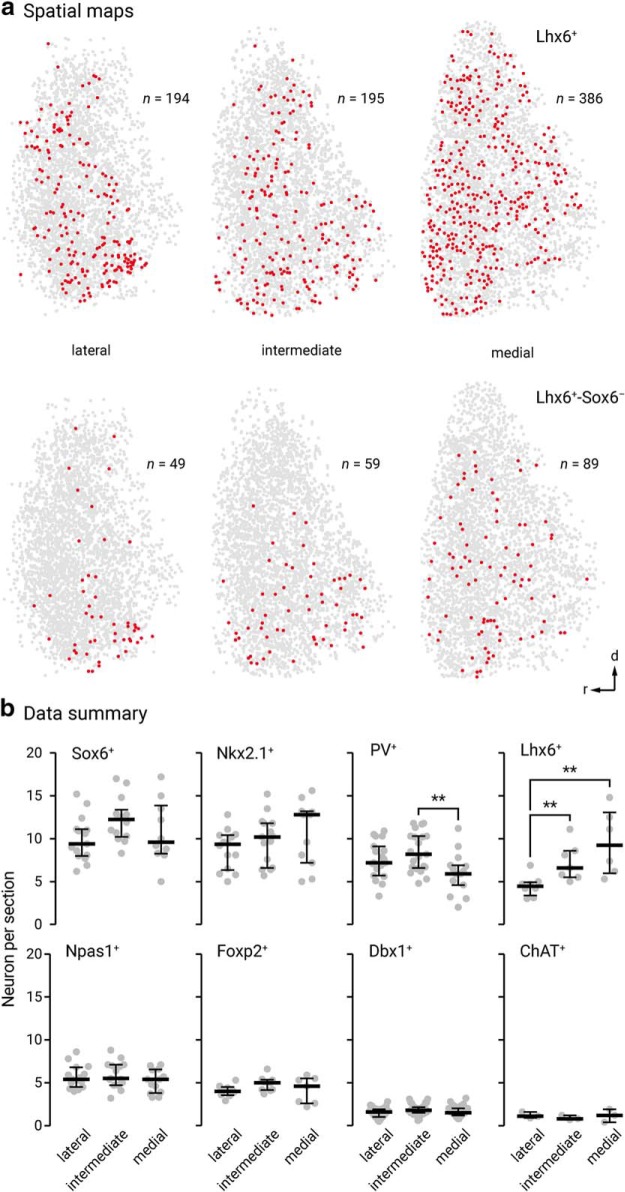
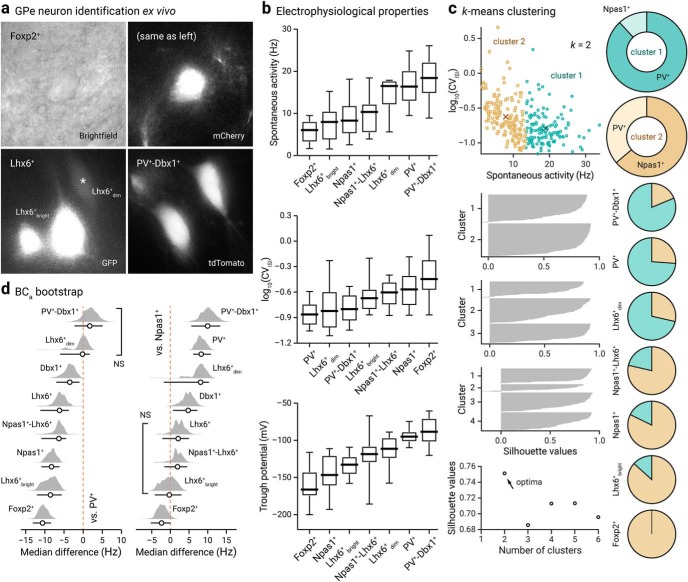
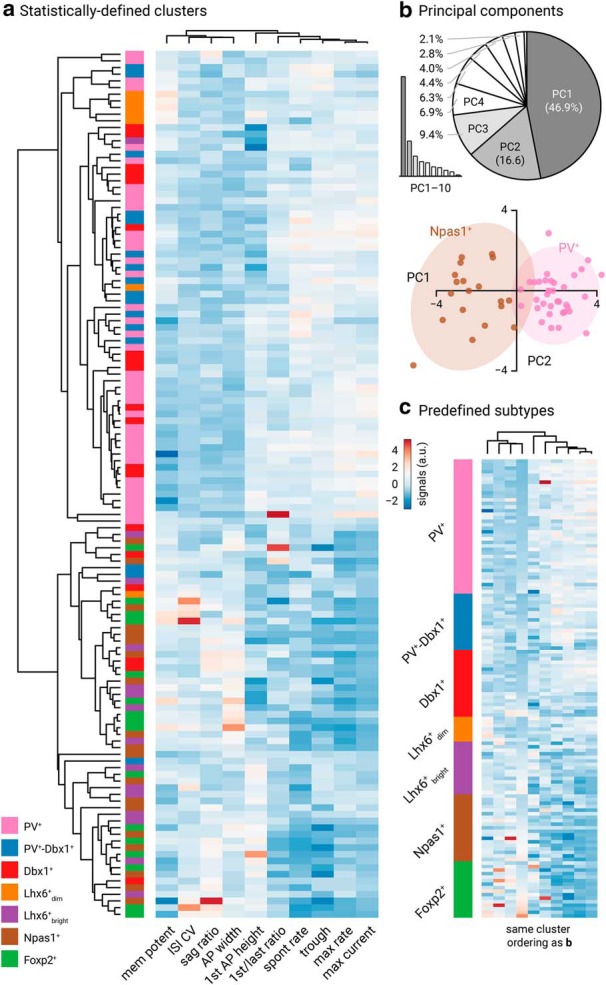
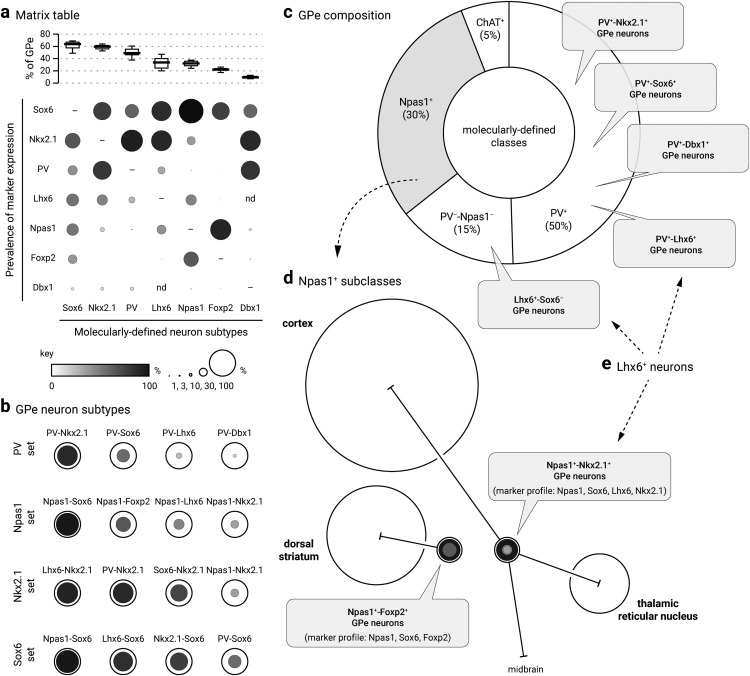
Within the basal ganglia circuit, the external globus pallidus (GPe) is critically involved in motor control. Aside from Foxp2+ neurons and ChAT+ neurons that have been established as unique neuron types, there is little consensus on the classification of GPe neurons. Properties of the remaining neuron types are poorly defined. In this study, we leverage new mouse lines, viral tools, and molecular markers to better define GPe neuron subtypes. We found that Sox6 represents a novel, defining marker for GPe neuron subtypes. Lhx6+ neurons that lack the expression of Sox6 were devoid of both parvalbumin and Npas1. This result confirms previous assertions of the existence of a unique Lhx6+ population. Neurons that arise from the Dbx1+ lineage were similarly abundant in the GPe and displayed a heterogeneous makeup. Importantly, tracing experiments revealed that Npas1+-Nkx2.1+ neurons represent the principal noncholinergic, cortically-projecting neurons. In other words, they form the pallido-cortical arm of the cortico-pallido-cortical loop. Our data further show that pyramidal-tract neurons in the cortex collateralized within the GPe, forming a closed-loop system between the two brain structures. Overall, our findings reconcile some of the discrepancies that arose from differences in techniques or the reliance on preexisting tools. Although spatial distribution and electrophysiological properties of GPe neurons reaffirm the diversification of GPe subtypes, statistical analyses strongly support the notion that these neuron subtypes can be categorized under the two principal neuron classes: PV+ neurons and Npas1+ neurons.SIGNIFICANCE STATEMENT The poor understanding of the neuronal composition in the external globus pallidus (GPe) undermines our ability to interrogate its precise behavioral and disease involvements. In this study, 12 different genetic crosses were used, hundreds of neurons were electrophysiologically characterized, and >100,000 neurons were histologically- and/or anatomically-profiled. Our current study further establishes the segregation of GPe neuron classes and illustrates the complexity of GPe neurons in adult mice. Our results support the idea that Npas1+-Nkx2.1+ neurons are a distinct GPe neuron subclass. By providing a detailed analysis of the organization of the cortico-pallidal-cortical projection, our findings establish the cellular and circuit substrates that can be important for motor function and dysfunction.

Keywords: arkypallidal neurons; basal ganglia; cellular diversity; globus pallidus; pallidocortical neurons; prototypic neurons.


Figures

Figure 1.
Figure 1.
GPe neuron diversity. a, The location of the GPe in a mouse brain is illustrated (side view). b, GPe neurons at three different lateral, intermediate, and medial levels (∼2.5, 2.1, and 1.7 lateral from bregma) were sampled. c, Using HuCD as a neuronal marker, population data for the relative abundance of GPe neuron markers was determined. Each circle represents a section. Inset: low-magnification confocal image of a sagittal brain section showing HuCD-labeling in the GPe with the dStr and ic defining the rostral and caudal borders, respectively. Note the low density of HuCD-labeled cells outside of the GPe. d, Low-magnification confocal images of the GPe and TRN in PV-L-tdTom (PV-Cre;LSL-tdTomato, top) and PV-tdTom (bottom) mice. e, PV-F-tdTom (PV-Flp;FSF-tdTomato) and Nkx2.1-F-tdTom (Nkx2.1-Flp;FSF-tdTomato) were used in this study. The PV-F-tdTom (PV-Flp;FSF-tdTomato) transgenic mouse line produces faithful reporting of PV+ neurons and similar cytoplasmic neuron labeling as the PV-L-tdTom and PV-tdTom lines (as shown in d). Top, low-magnification showing the PV-F-tdTom line produces prominent tdTomato expression (tdTomato+) in PV+ neurons in the TRN in addition to the GPe. To confirm the validity of the mouse line, tdTomato expression was compared against PV immunostaining. A higher magnification of the GPe shows nearly all tdTomato+ (magenta) neurons colocalize with PV-ir (green). Bottom, Nkx2.1-F-tdTom reliably captures neurons that arise from the Nkx2.1 lineage. Note that no cell bodies were found in the TRN (see also Fig. 5c). Double immunolabeling with tdTomato and Nkx2.1 demonstrated ∼90% colocalization. Arrowheads indicate neurons that do not colocalize. f, Triple immunostaining with PV, Npas1, and GFP on Lhx6-GFP brain sections confirmed the existence of a Lhx6+-PV-Npas1 GPe population. Circles indicate Lhx6+ neurons that colocalize with either PV or Npas1. Arrowheads point to unique Lhx6+ neurons. Note that there are both bright and dim populations of Lhx6+ neurons. g, Sox6+ neurons express established GPe markers. Note that there are both bright and dim populations of Sox6+ neurons. Bottom, arrowheads indicate Lhx6+-Sox6 neurons. dStr = dorsal striatum; TRN, thalamic reticular nucleus; VPL/VPM, ventral posterior nucleus; ic, internal capsule.
Figure 2.
Figure 2.
Lhx6+ and Dbx1+ GPe neurons colocalize with established GPe markers. a, Left, low and high-magnification images of PV+, Sox6+, and Lhx6+ (GFP+) GPe neurons. Right, low and high-magnification images of Npas1+, Sox6+, and Lhx6+ (GFP+) GPe neurons. b, In situ hybridization signals from Dbx1-L-tdTom mouse line for tdTomato+ and Cre+ in the adult GPe and neighboring areas (left). Note the widespread tdTomato+ across brain areas (top right) resulted from the cumulative recombination from early developmental stages despite the absence of Cre+ expression in adult (bottom right). Data are adopted from Allen Brain Atlas. The Dbx1-L-tdTom mouse line labeled Dbx1+ (tdTomato+) neurons (HuCD, magenta) and glia in the GPe. c, Dbx1+ GPe neurons colocalized with established GPe markers and are largely PV+. Note that there was no overlap between Dbx1 and Foxp2. Circles indicate colocalization, star (bottom right) presents an example of astrocytic labeling in the Dbx1-L-tdTom mouse line. dStr, dorsal striatum; GPi, internal globus pallidus; SI, substantia innominata; TRN, thalamic reticular nucleus; ac, anterior commissure; ic, internal capsule.
Figure 3.
Figure 3.
Retrograde tracing analysis. a, Representative injection sites from retrograde tracing connectome analysis. CTb (green) with or without LVretro-Cre (LV, red) was injected into dStr (top left), STN (top right), SNr (bottom right) and mounted with DAPI (blue) to visualize cytoarchitecture. b, Retrograde labeling of GPe-STN neurons with both CTb and LV tracing techniques. CTb (top left, green) labeled and LV (bottom left, magenta) GPe neurons from STN injection were primarily PV+ and did not colocalize with Npas1 immunostaining (top and bottom right). c, Retrograde labeling in Dbx1-L-tdTom mice shows Dbx1+ neurons (magenta) project to STN (top left) and SNr (top right) as indicated by colocalization with CTb (green). Circles denote colocalization. Arrowheads denote CTb+ STN projecting neurons that lack expression of Dbx1. Bottom, coronal view of a representative injection to the PF (left) along with expected positive cortical fluorescence (MO, right). No fluorescence was observed in the GPe. dStr, dorsal striatum; Ctx, cortex; GPe, external globus pallidus; GPi, internal globus pallidus; Hp, hippocampus; Pf, parafascicular nucleus; LGd, lateral geniculate, dorsal; MO, somatomotor cortex; ORB, orbital cortex; SI, substantia innominata; SNr, substantia nigra pars reticulata; STN, subthalamic nucleus; TRN, thalamic reticular nucleus; ZI, zona incerta; ac, anterior commissure; cpd, cerebral peduncle; ic, internal capsule; wm, white matter.
Figure 4.
Figure 4.
Cortico-pallido-cortical macroscopic anatomy. a, Different cortical subregions examined in this study are highlighted. For clarity, frontal (top) and horizontal (bottom) views are shown. b, A confocal micrograph showing a representative example of retrogradely-labeled cortex-projecting GPe neurons (arrowhead) using LVretro-Cre in a LSL-tdTomato mouse; PV-immunolabeling (green) was performed in this example. Inset: experimental setup. LVretro-Cre and CTb were injected into different cortical areas mentioned in a, c, Top left, experimental setup: LVretro-Cre and CTb were injected into the GPe. Cortical inputs to the GPe were mapped using two-photon tomography. Top right, Two-photon image showing the location of the injection site. Bottom, representative two-photon images from coronal sections showing GPe-projecting cortical neurons were found primarily in layer 5 and 6 of MO and SS. d, Left, quantification of GPe-projecting neurons across the entire cortex. Medians, interquartile ranges, and 10th to 90th percentiles are represented in a graphical format. Right, laminar position of GPe-projecting neurons. e, Low-magnification image of Npas1+ pallido-cortical axons spanning across ORB, MO, and SS. Note the highest density occurred in layers 5 and 6 of MO followed by SS and dropped off precipitately rostrally in the ORB. Axons extend as far as layer 2/3. f, Local cortical infection in a Npas1-Cre-tdTom mouse confirmed axons visible in rostral cortical regions were from GPe projection and not ectopic infection of cortical neurons in the caudal areas. Injection site in SS (left) resulted in very low density of caudal to rostral cortico-cortical connectivity in MO and ORB (right). Arrowheads indicate the presence of cortical axons that arose from the more caudal regions. dStr, dorsal striatum; CLA, claustrum; MOp, primary somatomotor; MOs, secondary somatomotor; ORB, orbital; Sp, septum; SSp-n, primary somatosensory, nose; SSp-bfd, primary somatosensory, barrel field; SSp-ll, primary somatosensory, lower limb; SSp-m, primary somatosensory, mouth; SSp-ul, primary somatosensory, upper limb; SSp-tr, primary somatosensory, trunk; SSs, secondary somatosensory; VISC, visceral; ac, anterior commissure; fa, anterior forceps; wm, white matter.
Figure 5.
Figure 5.
Cortex-projecting neuron properties. a, LV retrograde labeled (magenta) GPe neurons with PV immunostaining (green). Note that cortical projecting GPe neurons are not PV+. Arrowhead indicates a LV-labeled neuron with a large cell body characteristic of cholinergic neurons. b, Confocal micrograph showing the coexpression (dotted circles) of Npas1 (yellow) and Nkx2.1 (blue) in cortex-projecting GPe neurons (magenta). Inset: an example of a neuron (shown at the same magnification) that has a large cell body and low Nkx2.1 expression, features of cholinergic neurons within the confines of the GPe. c, High-magnification confocal micrographs of axons in the Ctx, dStr, and TRN with injection of a CreOn-ChR2 AAV into the GPe of a Npas1-Cre-tdTom mouse. Asterisks in the top left denote putative terminals. Bottom right, high density of synaptic boutons in the TRN of Nkx2.1-F-tdTom mice. d, Voltage-clamp recordings of the Npas1+ input in a cortical neuron within layers 5 and 6. The recorded neuron was held at -70 mV with a high Cl internal; IPSCs (IPSCs) were evoked from 20 Hz paired-pulse blue light stimulation (indicated by gray circles). Note the fast and depressing responses evoked. Inset: location of the recorded neuron (asterisk) in the Ctx is shown. IPSCs were attenuated with extracortical stimulation (data not shown) and abolished with tetrodotoxin (TTX, 1 μm). Application of 4-aminopyridine (4-AP, 100 μm) in the presence of TTX restored the response with intracortical stimulation. IPSCs were completely blocked with SR95531 (10 μm). e, Voltage-clamp recording of a TRN neuron with identical experimental setup shown in d, Note the facilitating responses evoked. Inset: location of the recorded neuron (asterisk) is shown. Responses were sensitive to the application of SR95531 (10 μm). f, Left, Pie charts summarizing the percentages of responders in Ctx and TRN. Right, Medians and interquartile ranges of IPSC amplitudes are represented in a graphical format. dStr, dorsal striatum; Ctx, cortex; TRN, thalamic reticular nucleus; ic, internal capsule; wm, white matter.
Figure 6.
Figure 6.
Pyramidal-tract but not intratelencephalic axons collateralize in the GPe. a, Single-axon reconstruction of a layer 5 (L5) cortico-pallidal neuron (neuron #AA0122) in the motor cortex. Data are adapted from the MouseLight project (http://mouselight.janelia.org). The axonal projection pattern is consistent with a pyramidal-tract (PT)-type neuron. Inset: axonal arborization of 10 different cortical neurons. GPe and axonal endpoint were used as the target location and structure queries, respectively. b, Injection site center of mass of Sim1-Cre (L5-PT) plotted and spatially clustered (n = 62, triangles). These injection sites correspond to vibrissal, forelimb, and orofacial somatosensory cortices (vS1, fS1, and orfS1); vibrissal, forelimb, and lower limb motor cortices (vM1, fM1, and llM1); and frontal areas (anterior lateral motor cortex (ALM) and secondary motor cortex (M2)). Eight clusters shown in red (M2), orange (ALM), purple (vM1), burgundy (fM1), green (llM1), yellow (fS1), teal (vS1), and gray (orfS1). Indeterminate injection sites are white. Sites are superimposed on an image of the dorsal surface of mouse cortex. Black cross marks indicate midline and bregma. For simplicity, injection sites in Tlx3-Cre (L5-IT) are not shown (see Hooks et al., 2018, for further information). c, d, Tlx3-Cre (IT-type) projections from fM1 in dStr but not GPe. Sim1-Cre (PT-type) projections from fS1 (left) and fM1 (right) in dStr and GPe (pink arrows). Inset: Coronal images of injection sites in Tlx3-Cre and Sim1-Cre showing the cell body locations and their axonal projections. e, Coronal images of the average normalized PT-type projection to GPe from eight cortical areas. Each column is a cortical projection, with rows going from anterior (top) to posterior (bottom). Each projection is normalized for comparison within the projection.
Figure 7.
Figure 7.
Cortex neurons form functional synapses on GPe neurons. a, Top, Confocal micrograph of a sagittal section from an Emx1-Cre mouse, showing the neuronal elements expressing ChR2-eYFP delivered from an AAVretro injection into the GPe. Inset, ChR2-eYFP+ layer 5 neuron with morphology typical of pyramidal neurons is shown. Bottom left, Cortical axons were observed at the GPe level. An enrichment of axons was present at the rostral pole of the GPe, immediate adjacent to the dStr (pink arrows). Bottom right, High density of cortico-pallidal axons were observed to collateralize in the subthalamic nucleus (STN). b, A high-magnification image showing the colocalization (white arrowheads) of VGluT1 (magenta) in corticopallidal axons (green). c, Epifluorescence image from ex vivo tissue showing robust expression of ChR2-eYFP in cortical neurons. Top, AAVretro-CreOn-ChR2-eYFP was injected into the GPe of an Emx1-Cre mouse. Robust ChR2-eYFP expression in the MO was observed (left). ChR2-eYFP+ neurons were readily seen at high-magnification (right). Asterisk indicates the soma of a typical ChR2-eYFP+ neuron. Bottom, Cortico-pallidal axons were preserved in an ex vivo slice preparation. d, Top, Functional cortical inputs were recorded in GPe neurons (20 of 25) and dStr projection neurons (6 of 6). EPSCs were evoked with optogenetics. Bottom, Box and scatter plots summarizing EPSC amplitude recorded from GPe neurons (left) and dStr SPNs (right). Note the large variance in the data. Red arrowheads indicate cortical axon bundles; white arrowheads indicate apical dendrites. dStr, dorsal striatum; GPe, external globus pallidus; STN, subthalamic nucleus; ZI, zona incerta; ac, anterior commissure; cpd, cerebral peduncle; ic, internal capsule; wm, white matter.
Figure 8.
Figure 8.
Spatial distribution of GPe neuron subtypes. a, Spatial information of GPe neurons cannot be represented relative to bregma location (top, lower left) because of its complex geometry. To mathematically describe the spatial distribution of GPe neurons in each brain section, fixed mouse brains were sagittally sectioned and histologically processed. Images were manually aligned to a reference atlas. GPe neurons located at six different lateromedial levels (2.73 mm, 2.53 mm, 2.35 mm, 2.15 mm, 1.95 mm, and 1.73 mm) were charted and collapsed onto a single plane. As the GPe is similarly shaped across the lateromedial extent (lower right), both the rostrocaudal and dorsoventral extent were assigned to 0 and 1. The address of each neuron is defined by their x–y coordinates and represented with a marker (black). To capture the aggregate spatial distribution, a geometric centroid (red) of each neuron population was then determined to represent the center of mass in both x and y dimensions. Centroids are then used as the origin for the polar histograms in b, Size of each sector represents the relative neuron count as a function of direction. b, Representative data of neurons from two individual mice are shown in each case, except for retrogradely labeled cortically projecting neurons (n, 7 mice; 119 neurons; 15 sections). Each marker represents a neuron. The density of neurons are encoded with a yellow-blue gradient. Hash marks, which represent the dorsoventral and rostrocaudal axes, are presented with the centroids and polar histograms to facilitate comparison. Bin sizes in the polar histograms were chosen based on the size of each neuron population. The (x, y) centroid values for the respective GPe distributions were as follows: HuCD+ (0.3798, 0.4168); Nkx2.1+ (0.3599, 0.4439); Sox6+ (0.3587, 0.4529); PV+ (0.3205, 0.4699); Lhx6+ (0.3918, 0.3827); Lhx6+-Sox6 (0.3755, 0.3164), Dbx1+ (0.3679, 0.3828); ChAT+ (0.6024, 0.3569); Npas1+ (0.4106, 0.4140); Npas1+-Foxp2+ (0.3695, 0.4676); Npas1+-Nkx2.1+ (0.4026, 0.4278); Ctx-projecting GPe neurons (0.5061, 0.2911).
Figure 9.
Figure 9.
Lateromedial gradients and relative abundance of different GPe neuron classes. a, Spatial maps of the pan-Lhx6+ and unique Lhx6+ Sox6 GPe neuron populations. Both populations display a lateromedial gradient with more neurons populating the medial GPe. b, Relative abundance of neuron classes in different lateromedial subdivisions of the GPe (Sox6+, lateral: 60 ± 12%, n, 4457 neurons, intermediate: 63 ± 11%, n, 5112 neurons, medial: 50 ± 11%, n, 3286 neurons; Nkx2.1+, lateral: 56 ± 7%, n, 3365 neurons, intermediate: 53 ± 9%, n, 3878 neurons, medial: 64 ± 14%, n, 3265 neurons; PV+, lateral: 46 ± 10%, n, 4368 neurons, intermediate: 45 ± 11%, n, 5113 neurons, medial: 32 ± 7%, n, 2829 neurons; Lhx6+, lateral: 28 ± 6%, n, 1422 neurons, intermediate: 42 ± 9%, n, 2050 neurons, medial: 45 ± 12%, n, 2190 neurons; Npas1+, lateral: 32 ± 6%, n, 2635 neurons, intermediate: 31 ± 6%, n, 2903 neurons, medial: 27 ± 7%, n, 2252 neurons; Foxp2+, lateral: 24 ± 3%, n, 939 neurons, intermediate: 26 ± 4%, n, 1115 neurons, medial: 25 ± 6%, n, 686 neurons; Dbx1+, lateral: 10 ± 2%, n, 1219 neurons, intermediate: 9 ± 2%, n, 1540 neurons, medial: 8 ± 2%, n, 1121 neurons; ChAT+, lateral: 6 ± 1%, n, 100 neurons, intermediate: 4 ± 1%, n, 76 neurons, medial: 6 ± 3%, n, 91 neurons). Percentage total was calculated from HuCD+ cells within each section. Note that PV and Npas1 were expressed in a largely nonoverlapping fashion (2 ± 2%, n, 96 neurons, 12 sections). In contrast, considerable overlap between Lhx6 and PV (28 ± 7%, n, 654 neurons, 12 sections) or Npas1 (35 ± 5%, n, 818 neurons, 12 sections) was observed; the remaining fraction was uniquely labeled with Lhx6. Medians and interquartile ranges are represented in a graphical format. Asterisks denote statistical significance level: **p < 0.01, Mann–Whitney U test.
Figure 10.
Figure 10.
Genetically identified GPe neurons differ in their spontaneous activity. a, Representative bright-field and epifluorescence images of GPe neuron subtypes in ex vivo brain slices. Foxp2+ neuron (top, bright-field and mCherry), Lhx6+bright neurons and Lhx6+dim (bottom left, GFP), and PV+-Dbx1+ neurons (bottom right, tdTomato) were captured at 60× magnification. Note the difference in the morphology and GFP expression among Lhx6+ neurons. b, Box-plot summary of the electrophysiological properties of identified GPe neuron subtypes. Data are ranked based on the median values. See Tables 5 and 6 for median values, sample sizes, and statistical analysis. Medians, interquartile ranges, and 10th to 90th percentiles are represented in a graphical format. c, Top left, visualization of the clustered data on spontaneous activity (rate and CVISI) for k, 2 clusters. Centroid values for cluster 1 (teal circle) and 2 (tan squares) are as follows: 18.9 Hz, 0.16 and 7.9 Hz, 0.24. Middle left, Silhouette plots for different clusters. Bottom right, Silhouette values are plotted against cluster numbers showing an optima at k, 2. Large positive silhouette values indicate that the data point is close to its cluster's centroid, whereas negative silhouette values indicate that the data point is closer to the centroid of the other cluster. Right, a series of pie charts showing the membership assignment of different genetically defined GPe neuron subtypes. The membership assignment in cluster 1 (teal) and 2 (tan) for each neuron subtypes are as follows: PV+-Dbx1+ (81.3%, 18.8%, n, 16), PV+ (73.9%, 26.1%, n, 111), Lhx6+dim (71.4%, 28.6%, n, 7), Npas1+-Lhx6+ (21.4%, 78.6%, n, 14), Npas1+ (17.7%, 82.3%, n, 62), Lhx6+bright (13.3%, 86.7%, n, 15), Foxp2+ (0.0%, 100.0%, n, 20). Data are not shown for Dbx1+ (50.0%, 50.0%, n, 20) and Lhx6+ (61.1%, 38.9%, n, 18), which both contain a mixture of PV+ neurons and Npas1+ neurons. d, Bias-corrected and accelerated (BCa) bootstrap estimation of effect sizes (median differences) and 95% confidence intervals. The median difference in spontaneous rate for seven comparisons against the PV+ neurons (left) and Npas1+ neurons (right) are shown. Median differences are plotted as bootstrap sampling distributions. Each median difference is depicted as a circle. Median differences are also encoded by color saturation. Lower and upper confidence interval bounds are indicated by the horizontal bars. Lhx6+dim neurons and PV+-Dbx1+ neurons are statistically nonsignificant from PV+ neurons (p, 0.45 and 0.24). Lhx6+bright neurons, Npas1+-Lhx6+ neurons, and Lhx6+ neurons are statistically nonsignificant from Npas1+ neurons (p = 0.44, 0.29, and 0.066).
Figure 11.
Figure 11.
Electrophysiological multivariate analysis of GPe neurons. a, Heatmap representation of electrical signatures of genetically identified GPe neuron subtypes. Dendrograms show the order and distances of neuron clusters and their electrical characteristics. A total of 130 neurons (n, PV+: 38, Npas1+: 19, Dbx1+: 19, Foxp2+: 16, PV+-Dbx1+: 16, Lhx6+bright: 16, Lhx6+dim: 7) were included in this analysis. Neurons with incomplete data were excluded from the analysis. b, Top, Scree plot (left) and pie chart (right) showing that the first three principal components (gray) capture 72.9% of the total variability in the data. Bottom, Principal component 1 and 2 account for 46.9% and 16.6% of the total variance, respectively. Prediction ellipses for PV+ neurons (pink) and Npas1+ neurons (brown) are shown. With probability 0.95, a new observation from the same group will fall inside the ellipse. c, Same dataset as a. Data are sorted by genetically identified neuron subtypes. Ordering of the clustering is the same as a.
Figure 12.
Figure 12.
Diagrams summarizing the marker expression profile and classification scheme derived from the current study. a, Data from Table 3 are graphically represented to convey the coexpression of markers (vertical axis) within each molecularly defined neuron subtype (horizontal axis). As visualized at the top of the matrix table, medians are presented as thick horizontal lines (Fig. 1) and data are sorted according to the abundance of neuron subtypes within the GPe. Both the size and grayscale intensity of each circle represents the prevalence of expression within specific GPe neuron subtypes. Circles along each column do not add up to 100% as there is overlapping marker expression with each neuron subtype. −, Not shown; nd, not determined. For example, Foxp2 (sixth row) is selectively expressed in Npas1 neurons and a subset of Sox6 neurons; it is absent in Nkx2.1+ and PV+ neurons. Within the Foxp2+ population (sixth column), Sox6 and Npas1 are the only markers expressed. The high prevalence of Npas1 and Sox6 within the Foxp2+ neuron subtype (sixth column) is demonstrated by larger and darker circles. Note that because Foxp2 and Nkx2.1 are nonoverlapping, there is no circle for Nkx2.1. Accordingly, Npas1+-Foxp2+ subclass and Npas1+-Nkx2.1+ subclass represent 57% and 32% of the Npas1+ population, respectively. As a comparison, Sox6 (first row) is expressed across all identified neuron types. Sox6 expression (first row) was observed in a major fraction of each population, especially Npas1+ neurons. The Sox6 neuron subtype (first column) expresses a broader range of markers. Last, neurons from the Dbx1 lineage (seventh row) are heterogeneous and overall contribute to only a small fraction of each molecularly defined neuron subtype. b, Summary of the GPe neuron classification based on the expression profile of different molecular markers, i.e., data from a. c, Pie chart summarizing the neuronal composition of the mouse GPe. The area of the sectors represents the approximate size of each neuron class. PV+ neurons (which constitute 50% of the GPe) are heterogeneous. Nkx2.1, Sox6, Lhx6, and Dbx1 are coexpressed in PV+ neurons to a varying extent. How they intersect with each other remains to be determined. Npas1+ neurons (gray) are 30% of the GPe; they can be subdivided into two subclasses (see d). ChAT+ neurons are ∼5% of the total GPe neuron population and show no overlap with other known classes of GPe neurons. d, Two bona fide subclasses of Npas1+ neurons (Npas1+-Foxp2+ and Npas1+-Nkx2.1+) are identified in the mouse GPe. They differ in their molecular marker expression, axonal projections, and electrophysiological properties. Although Npas1+-Foxp2+ neurons project to the dorsal striatum, Npas1+-Nkx2.1+ neurons project to the cortex, thalamus, and mid/hindbrain areas. Size of the target areas (circles) is an artistic rendering based on the volume of those areas, but not the axonal density, synaptic strength, or contacts formed by Npas1+ neuron subclasses. e, Lhx6+ neurons are highlighted. Both PV+-Lhx6+ neurons and Npas1+-Lhx6+ neurons coexpress Sox6. Lhx6+-Sox6 neurons are a subset of PV-Npas1 neurons.

References

    1. Abdi A, Mallet N, Mohamed FY, Sharott A, Dodson PD, Nakamura KC, Suri S, Avery SV, Larvin JT, Garas FN, Garas SN, Vinciati F, Morin S, Bezard E, Baufreton J, Magill PJ (2015) Prototypic and arkypallidal neurons in the dopamine-intact external globus pallidus. J Neurosci 35:6667–6688. 10.1523/JNEUROSCI.4662-14.2015 - DOI - PMC - PubMed
    1. Abrahao KP, Lovinger DM (2018) Classification of GABAergic neuron subtypes from the globus pallidus using wild-type and transgenic mice. J Physiol 596:4219–4235. 10.1113/JP276079 - DOI - PMC - PubMed
    1. Abs E, Poorthuis RB, Apelblat D, Muhammad K, Pardi MB, Enke L, Kushinsky D, Pu DL, Eizinger MF, Conzelmann KK, Spiegel I, Letzkus JJ (2018) Learning-related plasticity in dendrite-targeting layer 1 interneurons. Neuron 100:684–699.e6. 10.1016/j.neuron.2018.09.001 - DOI - PMC - PubMed
    1. Ährlund-Richter S, Xuan Y, van Lunteren JA, Kim H, Ortiz C, Pollak Dorocic I, Meletis K, Carlén M (2019) A whole-brain atlas of monosynaptic input targeting four different cell types in the medial prefrontal cortex of the mouse. Nat Neurosci 22:657–668. 10.1038/s41593-019-0354-y - DOI - PubMed
    1. Anderson ME, Horak FB (1985) Influence of the globus pallidus on arm movements in monkeys. III. Timing of movement-related information. J Neurophysiol 54:433–448. 10.1152/jn.1985.54.2.433 - DOI - PubMed

Publication types

MeSH terms

Substances

LinkOut - more resources