. 2019 Dec 6;4(42):eaay8556.
doi: 10.1126/sciimmunol.aay8556.

T cell-derived interferon-γ programs stem cell death in immune-mediated intestinal damage

Affiliations

T cell-derived interferon-γ programs stem cell death in immune-mediated intestinal damage

S Takashima et al. Sci Immunol. .

Abstract

Despite the importance of intestinal stem cells (ISCs) for epithelial maintenance, there is limited understanding of how immune-mediated damage affects ISCs and their niche. We found that stem cell compartment injury is a shared feature of both alloreactive and autoreactive intestinal immunopathology, reducing ISCs and impairing their recovery in T cell-mediated injury models. Although imaging revealed few T cells near the stem cell compartment in healthy mice, donor T cells infiltrating the intestinal mucosa after allogeneic bone marrow transplantation (BMT) primarily localized to the crypt region lamina propria. Further modeling with ex vivo epithelial cultures indicated ISC depletion and impaired human as well as murine organoid survival upon coculture with activated T cells, and screening of effector pathways identified interferon-γ (IFNγ) as a principal mediator of ISC compartment damage. IFNγ induced JAK1- and STAT1-dependent toxicity, initiating a proapoptotic gene expression program and stem cell death. BMT with IFNγ-deficient donor T cells, with recipients lacking the IFNγ receptor (IFNγR) specifically in the intestinal epithelium, and with pharmacologic inhibition of JAK signaling all resulted in protection of the stem cell compartment. In addition, epithelial cultures with Paneth cell-deficient organoids, IFNγR-deficient Paneth cells, IFNγR-deficient ISCs, and purified stem cell colonies all indicated direct targeting of the ISCs that was not dependent on injury to the Paneth cell niche. Dysregulated T cell activation and IFNγ production are thus potent mediators of ISC injury, and blockade of JAK/STAT signaling within target tissue stem cells can prevent this T cell-mediated pathology.


Figures

Fig. 1.
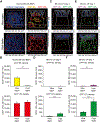
Fig. 1.. Alloreactive and autoreactive immune responses injure the intestinal stem cell compartment.
(A to C) LP-into-Lgr5-LacZ-B6 MHC-matched BMT. (A) Representative images of SI (ileum) Lgr5-LacZ staining on day 3 and day 10 post-BMT. Scale bars = 500μm (Upper) or 50μm (Lower). (B) SI ISC frequency (n = 8–25 independent sections/group) and (C) SI lysozyme+ Paneth cell frequency (n = 6–15 independent sections/group) on day 3 and day 10 post-BMT (D and E) B6-into-Lgr5-LacZ-BDF1 MHC-mismatched BMT, SI ISC frequency (D, n = 5–15 independent sections/group) and SI lysozyme+ Paneth cell frequency (E, n = 6–13 independent sections/group) on day 3 and day 10 post-BMT. (F and G) Foxp3-WT and Foxp3-DTR mice treated with DT. SI ISC frequency (F) and SI lysozyme+ Paneth cell frequency (G) 5 days after DT treatment (n = 19–20 independent sections/group). (H and I) Representative images and numbers of day 5 SI organoids from recipients day 3 (H) and day 10 (I) after LP-into-B6 BMT. Organoid culture from 150 crypts. Scale bars = 500μm (Upper) or 200μm (Lower). (n = 3 mice/group). (J) Day 5 SI organoid numbers from 150 crypts harvested 9 days after DT treatment (n = 4 mice/group). Data are mean and s.e.m.; comparisons performed with t-tests (two groups) or one-way ANOVA (multiple groups); *P < 0.05, **P < 0.01, ***P < 0.001. Data are representative of at least two independent experiments, or combined from two experiments (A to E)
Fig. 2.
Fig. 2.. Donor T cells infiltrate the epithelial layer and lamina propria in the crypt region after bone marrow transplantation.
3-D whole-mount immunofluorescent confocal imaging of mouse ileum. (A and B) T cells in normal B6 mice were identified by anti-CD3 immunofluorescence. (A) Left panels: Representative 3-D projection images of full-thickness SI tissue divided into villus and crypt regions, with cellular membrane staining (DiD lipophilic dye; blue) indicating the tissue architecture utilized for distinguishing IELs and LPLs within the ileum; yellow, CD3+ IELs; red, CD3+ LPLs. Right panels: 3-D projections of CD3+ IELs and CD3+ LPLs in the villus and crypt regions, with cellular membrane staining removed and tissue orientation (and thus T cell localization within the 3-D tissues) indicated by 2-D slices shown on the posterior projection walls. (B) Quantification of CD3+ IEL and CD3+ LPL densities in normal B6 (n = 6 independent 3-D views/group). (C to F) B6-into-LP allogeneic BMT was performed using wild-type B6 marrow and purified GFP+ B6 T cells, with donor T cells in the epithelium shown in purple and donor T cells in the lamina propria shown in green. (C) Representative 3-D projections and (D) quantifications of donor T cells in the villus and crypt regions 4 days post-BMT (n = 24 independent 3-D views/group combined from 2 transplants). (E) Representative 3-D projections and (F) quantifications of donor T cells in the villus and crypt regions 7 days post-BMT (n = 12 independent 3-D views/group). Tissue orientation and T cell localization are again indicated by 2-D slices shown on the posterior walls of the 3-D projections. Graphs indicate mean and s.e.m.; comparisons performed with t-tests; **P < 0.01, ***P < 0.001. Data are representative of two independent experiments unless otherwise mentioned.
Fig. 3.
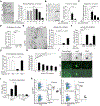
Fig. 3.. T-cell-derived IFNγ targets intestinal epithelium leading to reduction of Lgr5+ stem cells.
(A) Representative images and number of SI organoids after co-culture of B6 organoid cells with activated by allogeneic B6 dendritic cells or naive allogeneic BALB/c T cells (culture day 7, n = 3–6 wells/group); scale bars = 500μm. (B) Representative images and number of human SI organoids cultured with human allogeneic CD8+ T cells (culture day 7, n = 7–13 wells/group); scale bars = 1000μm. (C) Numbers of B6 SI organoids after culture with anti-CD3/CD28-activated B6 syngeneic T cells (culture day 7, n = 3 wells/group). (D) Human LI organoids after culture with autologous human CD4+ and CD8+ T cells (culture day 7, n = 3 wells/group). (E) Representative images and numbers of B6 SI organoids after culture with anti-CD3/CD28-activated BALB/c T cells and anti-IFNγ neutralizing antibodies (culture day 7, n = 4 wells/group); scale bars = 500μm. (F) Human SI organoids after culture with human allogeneic T cells and anti-IFNγ (culture day 7, n = 9 wells/group). (G) WT or Ifngr−/− B6 SI organoids cultured with BALB/c T cells (culture day 7, n = 4 wells/group). (H) B6 SI organoids after culture with rmIFNγ (culture day 7, n = 3 wells/group). (I) Representative images after co-culture of BDF1 organoid cells with GFP+ allogeneic B6 T cells. Shown are bright field (upper), fluorescent (middle), or overlap (lower) images; scale bars = 50μm. (J) IFNγ ELISA on supernatants from culture of B6 SI organoids with BALB/c T cells (n = 4–8 wells/group; ND, not detected. (K) FACS analysis of Lgr5-GFPhigh ISCs in organoids cultured with rmIFNγ for 16 or 72 hours (n = 3–5 wells/group). Data are mean and s.e.m.; comparisons performed with t-tests (two groups) or one-way ANOVA (multiple groups); *P < 0.05, **P < 0.01, ***P < 0.001. Data are representative of at least two independent experiments, or combined from two or three (B, F, J) independent experiments.
Fig. 4.
Fig. 4.. JAK/STAT inhibition protects intestinal stem cells from IFNγ.
(A) Representative images and numbers of B6 organoids after culture with BALB/c T cells and ruxolitinib (culture day 7, n = 4 wells/group); scale bars = 500μm. (B) Numbers of B6 SI organoid cells after culture with rmIFNγ and ruxolitinib (culture day 7, n = 4 wells/group). (C) Human SI organoids cultured with rhIFNγ (culture day 7, n = 3 wells/group) and ruxolitinib. (D) FACS analysis of Lgr5–GFPhigh ISCs in organoids cultured with rmIFNγ and ruxolitinib for 16 or 72 hours (n = 3–4 wells/group). (E) Jak1-deficient B6 SI organoids from Jak1fl/flxRosa-cre-ert2 mice cultured with BALB/c T cells or rmIFNγ (culture day 7, n = 4 wells/group). (F) Crypt pSTAT1 western blots after 30 minutes incubation with rmIFNγ +/− ruxolitinib. (G) WT or Stat1−/− B6 SI organoids cultured with rmIFNγ (culture day 7, n = 4 wells/group). Graphs indicate mean and s.e.m.; t-tests (two groups) or one-way ANOVA (multiple groups); *P < 0.05, **P < 0.01, ***P < 0.001. Data are representative of at least two independent experiments.
Fig. 5.
Fig. 5.. IFNγ programs stem cell death.
(A) Apoptosis-related genes expression in mouse SI organoids cultured with rmIFNγ for 6 hours (n = 6 wells/group); Mann–Whitney U analysis. (B) Apoptosis-related genes expression in human SI organoids cultured with rhIFNγ for 24 hours (n = 9–10 wells/group, data are from 3 different SI donors); Mann–Whitney U analysis. (C and D) FACS plots (C) and quantifications (D) of Lgr5-GFPhigh cells and Annexin V analysis from SI organoids cultured with rmIFNγ for 16 hours (n = 4 wells/group). (E) Relative caspase-3/7 activity as evaluated by Caspase-Glo assay; fold increase over baseline after treatment with rhIFNγ for 24 hours (n = 6 wells/group). (F) Human organoid cleaved caspase-3 western blot after 48 hours incubation with rhIFNγ. (G) Apoptosis-related genes expression in mouse SI organoids cultured with rmIFNγ and ruxolitinib for 24 hours (n = 6 wells/group); Kruskal–Wallis analysis. Graphs indicate mean and s.e.m.; comparisons performed with t-tests (two groups) or one-way ANOVA (multiple groups) unless otherwise stated; *P < 0.05, **P < 0.01, ***P < 0.001. Data are representative of two, or combined from two (E) independent experiments.
Fig. 6.
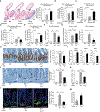
Fig. 6.. T-cell-derived-IFNγ decreases ISCs in vivo.
(A) ISCs 10 days after LP-into-B6 BMT with isotype or anti-IFNγ antibodies. Representative images and frequency of SI Lgr5-LacZ+ ISCs (n = 15–27 independent sections/group); scale bars = 500μm (Upper) or 50μm (Lower). (B) SI Lgr5+ ISCs in Foxp3-DTR+ or Foxp3-DTR Lgr5-LacZ reporter mice 5 days after DT treatment along with Isotype or anti-IFNγ antibodies (n = 29–31 independent sections/group). (C) Frequency of SI Lgr5-LacZ+ ISCs 10 days after LP-into-B6 BMT with vehicle or ruxolitinib (n = 6–10 independent sections/group). (D) Frequency of SI Lgr5-LacZ+ ISCs 10 days after B6-into-BDF1 BMT with wild type or Ifng−/− marrow (n = 5–13 independent sections/group). (E to M) B6-into-BDF1 BMT with wild type or Ifng−/− T cells. (E) Frequency of SI Lgr5-LacZ+ ISCs (n = 5–11 independent sections/group). (F) Intestinal GVHD histopathology score 10 days after BMT (n = 6–12 mice). (G) Crypt numbers (n = 6–21 independent sections/group) and villus blunting histopathology scores (n = 6–12 mice/group) 10 days after BMT. (H) Representative images and quantification of Ki67 IHC in the crypt area 10 days after BMT (n = 47–77 crypts/group); scale bars = 100μm. (I) Apoptosis-related genes expression in mouse SI crypts 10 days after BMT (n = 10 mice; Mann–Whitney U analysis). (J) Images and quantification of crypt cleaved caspase-3 IHC 10 days after BMT. Arrows indicate cleaved caspase-3+ apoptotic crypt cells (n = 489–974 crypts/group); scale bars = 50μm. (K) Quantification of crypt TUNEL staining 10 days after BMT (n = 251–491 crypts/group). (L) Double immunofluorescent staining of β-gal (green) and cleaved caspase-3 (red) from Lgr5-LacZ recipient mice 10 days after BMT. Shown are representative images and average frequencies of cleaved caspase-3+ apoptotic ISCs per mouse ileum as a percentage of the total Lgr5+ ISCs detected; scale bars = 50μm. (M) Day 5 SI organoid numbers per 100 crypts cultured 10 days after BMT (n = 5–7 mice/group). Graphs demonstrate mean and s.e.m.; comparisons performed with t-tests (two groups) or one-way ANOVA (multiple groups) unless otherwise stated; *P<0.05, **P<0.01, ***P<0.001. Data are representative of two, or combined from two (A, B, F, G and I) independent experiments.
Fig. 7.
Fig. 7.. IFNγ directly targets intestinal stem cells and induces apoptosis.
(A to D) Allogeneic B10.Br-into-B6 (Allo) or syngeneic B6-into-B6 (Syn) BMT using Ifngrfl/flxVillin-Cre (IfngrΔIEC) or Cre-negative Ifngrfl/fl (IfngrWT) littermate controls. (A) Representative images and frequency of SI (ileum) IHC for Olfm4+ ISCs 7 days after BMT (n = 6–17 independent sections/group); scale bars = 100μm. (B) Intestinal GVHD histopathology score 9 days after BMT (n = 3–5 mice/group). (C) Crypt number quantification (n = 9–17 independent sections/group) and villus blunting histopathologic scoring 9 days after BMT (n = 3–5 mice/group). (D) Quantification of crypt cleaved caspase-3 (cCaspase-3) IHC 9 days after BMT (n = 489–974 crypts/group). (E) FACS analysis of CD119 (IFNγR1) expression on ISCs and Paneth cells. (F) Numbers of B6 SI organoids 7 days after culture with BALB/c T cells +/− Wnt3a and Jagged1 (n = 3 wells/group). (G) Paneth-cell-deficient Atoh1ΔIEC SI organoids cultured in WNT3-supplemented ENR media for 7 days +/− BALB/c T cells or IFNγ (n = 4 wells/group). (H) SI organoids from sort-purified SI Lgr5-GFPhigh ISCs and sort-purified Paneth cells cultured for 7 days +/− BALB/c T cells (n = 3–6 wells/group). (I) RNAseq indicating IFNγ-responsive gene expression in sorted Lgr5-GFPhigh ISCs incubated with IFNγ for 1.5 hours. (J) Organoids from sorted WT or Ifngr−/− Lgr5-GFPhigh SI ISCs cultured for 6 days +/− BALB/c T cells (n = 7–8 wells/group). (K to Q) ISC colonies cultured in WENR with HDAC and GSK3β inhibition +/− IFNγ. (K) Representative confocal images of cleaved caspase-3 (cCaspase-3) immunofluorescence in ISC colonies cultured +/− IFNγ (culture day 6, arrows indicate apoptotic ISCs in the cellular layer, and arrow heads indicate apoptotic ISCs in the colony lumen), scale bars = 50μm. (L) Frequency of epithelial-layer cCaspase-3+ ISCs (n = 40–72 colonies/group). (M) cCaspase-3 staining intensity in the lumen area (n = 76–136 colonies/group). (N) qPCR analysis of apoptosis-related genes in mouse SI ISC colonies cultured with rmIFNγ for 24 hours (n = 6 wells/group; Mann–Whitney U analysis). (O to Q) Representative images and viability quantification of ISC colonies cultured with IFNγ. Images show bright field microscopy (Upper), Hoechst staining (Middle), or propidium iodide (Lower); scale bars = 200 μm. (O) Images of Lgr5-GFP+ SI ISC colonies cultured with rmIFNγ +/− caspase inhibitor Q-VD-OPh (culture day 7). (P) Images of SI ISC colonies initiated from sorted WT or Bak/Bax double knockout (DKO) SI ISCs cultured with IFNγ (culture day 7). (Q) Quantification of ISC colony survival after cultured with IFNγ (n = 3 colonies/group); t-tests at each concentration of IFNγ. Graphs indicate mean and s.e.m.; comparisons performed with one-way ANOVA unless otherwise stated; *P<0.05, **P<0.01, ***P<0.001. Data are representative of at least two, or combined from three independent experiments (I).

Comment in

References

    1. Gehart H, Clevers H, Repairing organs: lessons from intestine and liver. Trends Genet 31, 344–351 (2015). - PubMed
    1. Barker N, van Es JH, Kuipers J, Kujala P, van den Born M, Cozijnsen M, Haegebarth A, Korving J, Begthel H, Peters PJ, Clevers H, Identification of stem cells in small intestine and colon by marker gene Lgr5. Nature 449, 1003–1007 (2007). - PubMed
    1. Clevers H, The intestinal crypt, a prototype stem cell compartment. Cell 154, 274–284 (2013). - PubMed
    1. Sato T, van Es JH, Snippert HJ, Stange DE, Vries RG, van den Born M, Barker N, Shroyer NF, van de Wetering M, Clevers H, Paneth cells constitute the niche for Lgr5 stem cells in intestinal crypts. Nature 469, 415–418 (2011). - PMC - PubMed
    1. Barker N, Huch M, Kujala P, van de Wetering M, Snippert HJ, van Es JH, Sato T, Stange DE, Begthel H, van den Born M, Danenberg E, van den Brink S, Korving J, Abo A, Peters PJ, Wright N, Poulsom R, Clevers H, Lgr5(+ve) stem cells drive self-renewal in the stomach and build long-lived gastric units in vitro. Cell Stem Cell 6, 25–36 (2010). - PubMed

Publication types

Substances