. 2019 Dec 6;9(1):18486.
doi: 10.1038/s41598-019-54873-w.

RAG-2 deficiency results in fewer phosphorylated histone H2AX foci, but increased retinal ganglion cell death and altered axonal growth

Affiliations

RAG-2 deficiency results in fewer phosphorylated histone H2AX foci, but increased retinal ganglion cell death and altered axonal growth

Noemí Álvarez-Lindo et al. Sci Rep. .

Abstract

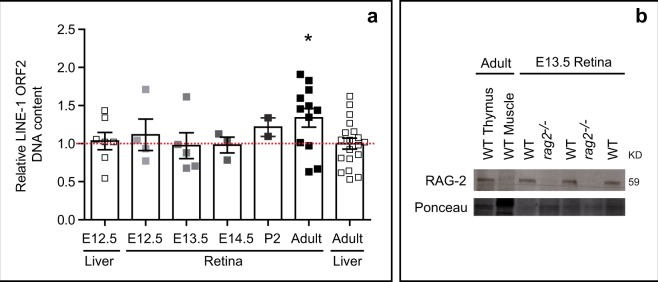
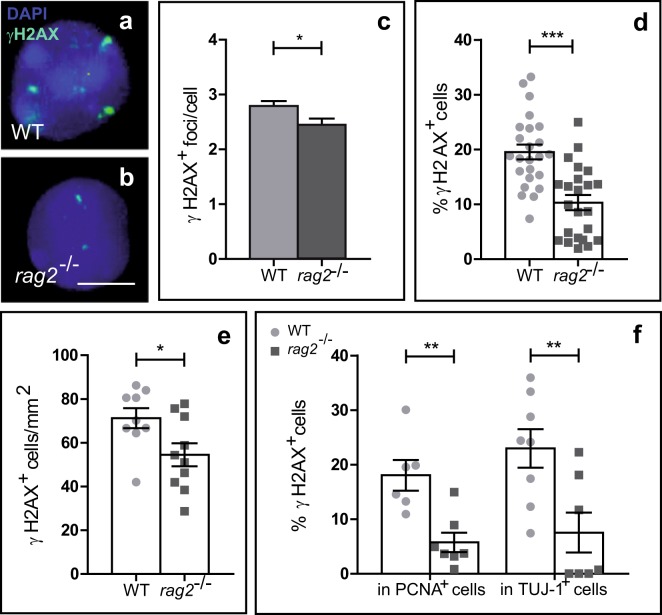
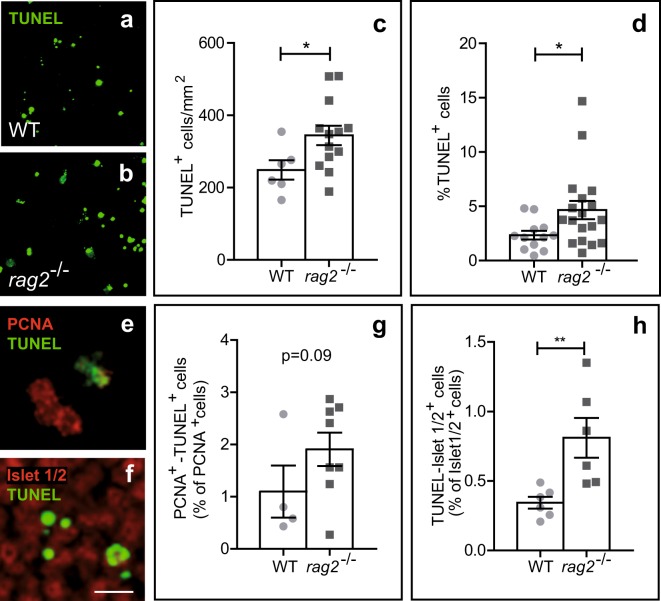
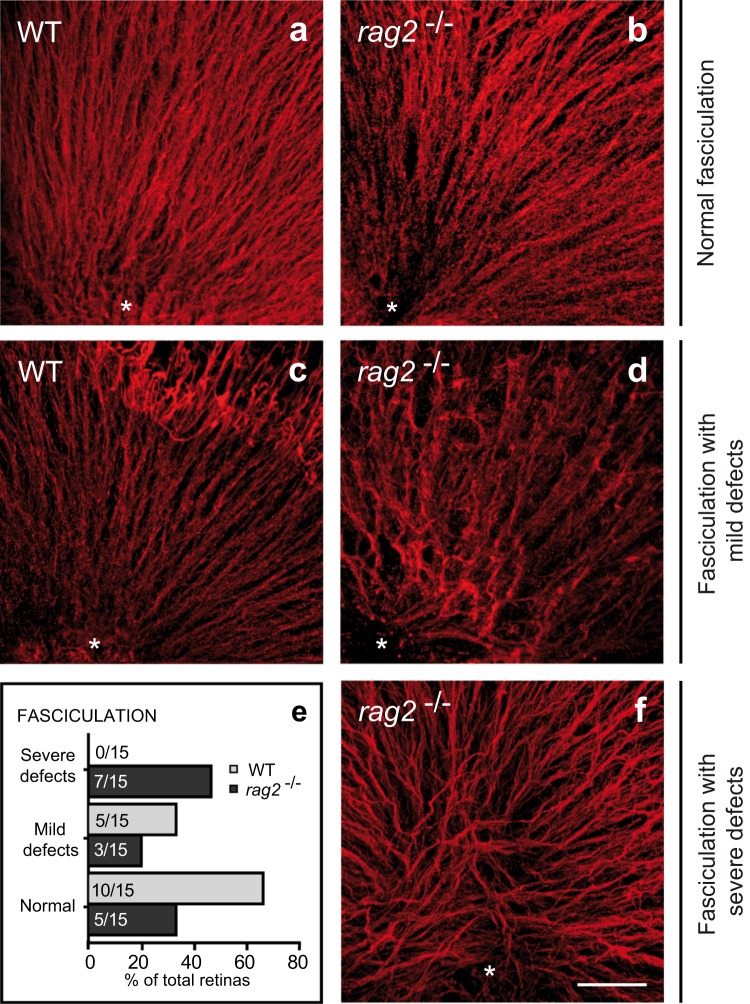
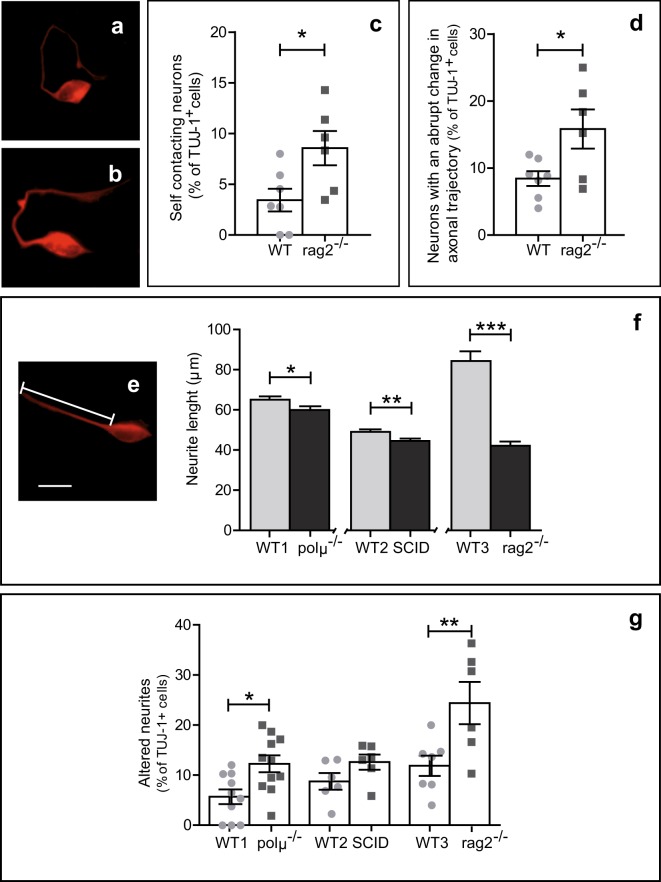
DNA double-strand breaks (DSBs), selectively visualized as γ-H2AX+ foci, occur during the development of the central nervous system, including the retina, although their origin and biological significance are poorly understood. Mutant mice with DSB repair mechanism defects exhibit increased numbers of γ-H2AX+ foci, increased cell death during neural development, and alterations in axonogenesis in the embryonic retina. The aim of this study was to identify putative sources of DSBs. One of the identified DSBs sources is LINE-1 retrotransposition. While we did not detect changes in LINE-1 DNA content during the early period of cell death associated with retinal neurogenesis, retinal development was altered in mice lacking RAG-2, a component of the RAG-1,2-complex responsible for initiating somatic recombination in lymphocytes. Although γ-H2AX+ foci were less abundant in the rag2-/- mouse retina, retinal ganglion cell death was increased and axonal growth and navigation were impaired in the RAG-2 deficient mice, a phenotype shared with mutant mice with defective DNA repair mechanisms. These findings demonstrate that RAG-2 is necessary for proper retinal development, and suggest that both DSB generation and repair are genuine processes intrinsic to neural development.


Conflict of interest statement

The authors declare no competing interests.

Figures

Figure 1
Figure 1
Possible sources of DSBs in the developing retina. (a) Relative levels of LINE-1 DNA detected by genomic qPCR in WT mouse liver and retinal extracts collected at different developmental stages and in adulthood. Dotted red line indicates the mean LINE-1 DNA content in the adult liver. Each datapoint represents a pool of littermates in the case of embryonic tissue samples, and a single animal in the case of adult tissue samples (only 2 animals in P2). Histograms depict the mean ± SEM. *P < 0.05 vs. LINE-1 adult liver content. (b) Western blot analysis of RAG-2 protein levels in retinal extracts from E13.5 WT and rag2−/− mice. WT adult thymus was used as positive control; WT adult muscle was used as negative control. E, embryonic day; P, postnatal day.
Figure 2
Figure 2
DSB number is reduced in the retinas of E13.5 rag2−/− mice. (a,b) Presence of DSBs in WT and rag2−/− mice as determined by γH2AX immunostaining (green). Nuclei were counterstained with DAPI (cyan). Quantification of nuclear γH2AX positive foci per cell (c) and percentage of γH2AX+ cells (d) in dissociated retinal cells from WT and rag2−/− mice (n > 100). (e) Density of γH2AX+ cells in whole-mount retinas. (f) Immunostaining for γH2AX, PCNA, and TUJ-1 in dissociated retinal cells from WT and rag2−/− animals. The percentage of γH2AX+ proliferative cells (PCNA+) and γH2AX+ neurons (TUJ-1+) are shown. Histograms depict the mean ± SEM values. *P ≤ 0.05, **P ≤ 0.01, ***P ≤ 0.001 vs. corresponding controls. Individual values are depicted as circles (WT) and squares (rag2−/−). Scale bar, 5 µm in a and b.
Figure 3
Figure 3
Neuronal cell death is increased in E13.5 rag2−/− retinas. (a,b,e,f) Apoptotic cells as visualized by TUNEL (green) in WT and rag2−/− mouse retinas. Density of TUNEL+ nuclei in whole-mount retinas (c) and percentage of TUNEL+ cells in dissociated retinal cells (d) are shown. (e,g) Dissociated retinal cells were immunostained for PCNA (red) and processed for TUNEL (green), and labelled cells were scored. (f,h) Apoptotic neurons were scored in whole-mount retinas immunostained for Islet 1/2 (red) and processed for TUNEL. Histograms show the mean ± SEM values. *P < 0.05, **P < 0.01 vs. corresponding controls. Individual values are depicted as circles (WT) and squares (rag2−/−). Scale bar, 50 µm in a and b, 12 µm in e and f.
Figure 4
Figure 4
In vivo axonal navigation is altered in E13.5 rag2−/− mice. RGC axonal trajectories were visualized by TUJ-1 immunostaining in whole-mount retinas from E13.5 WT (a,c) and rag2−/− mice (b,d,f). The optic nerve head is indicated with an asterisk. According to the axonal trajectory observed, fasciculation was classified as normal (a-b), mildly defective (c,d), or severely defective (f). The histogram (e) depicts the proportion (%) and absolute number (indicated within each bar) of retinas for which each phenotype was observed. Scale bar, 50 µm in a-d and f.
Figure 5
Figure 5
Altered neurite growth in E13.5 rag2−/−, SCID, and polμ−/− cultured retinal cells. E13.5 dissociated retinal cells from the indicated mouse genotypes were cultured on surfaces pretreated with polyornithine and laminin. Neurons and their neurites were visualized by TUJ-1 immunostaining and classified based on trajectory as straight (e), self-contacting (a), or with abrupt changes in their directionality (b), and plotted by typology (c,d). Neurite length (e) was measured in retinal cells from rag2−/−, polμ−/−, and SCID mutant mice after culture for 18 hours and compared with that of WT counterparts (WT1-C57BL/6; WT2-Balb/C; WT3-C57BL/10) (n > 100 cells) (f). The total percentage of neurites exhibiting alterations in directionality was determined in retinal cultures from the 3 mutant mice and compared with that observed in corresponding WT controls (n > 100 cells) (g). Percentages in c, d and g refer to the number of TUJ-1+ cells emitting neurites. Histograms show the mean ± SEM. *P < 0.05, **P < 0.01, **P < 0.001 vs. corresponding controls. Individual values are depicted as circles (WT) and squares (mutant mice). Scale bar, 10 µm in a, b and e.

References

    1. Chavarria T, Baleriola J, Mayordomo R, de Pablo F, de la Rosa EJ. Early neural cell death is an extensive, dynamic process in the embryonic chick and mouse retina. ScientificWorldJournal. 2013;2013:627240. doi: 10.1155/2013/627240. - DOI - PMC - PubMed
    1. Yeo W, Gautier J. Early neural cell death: dying to become neurons. Dev Biol. 2004;274:233–244. doi: 10.1016/j.ydbio.2004.07.026. - DOI - PubMed
    1. Boya P, de la Rosa EJ. Cell death in early neural life. Birth Defects Res C Embryo Today. 2005;75:281–293. doi: 10.1002/bdrc.20054. - DOI - PubMed
    1. de la Rosa EJ, de Pablo F. Cell death in early neural development: beyond the neurotrophic theory. Trends Neurosci. 2000;23:454–458. doi: 10.1016/S0166-2236(00)01628-3. - DOI - PubMed
    1. Dekkers MP, Nikoletopoulou V, Barde YA. Cell biology in neuroscience: Death of developing neurons: new insights and implications for connectivity. J Cell Biol. 2013;203:385–393. doi: 10.1083/jcb.201306136. - DOI - PMC - PubMed

Publication types