. 2019 Dec 6;9(1):18512.
doi: 10.1038/s41598-019-54366-w.

Transcription activity contributes to the firing of non-constitutive origins in African trypanosomes helping to maintain robustness in S-phase duration

Affiliations

Transcription activity contributes to the firing of non-constitutive origins in African trypanosomes helping to maintain robustness in S-phase duration

Marcelo S da Silva et al. Sci Rep. .

Abstract

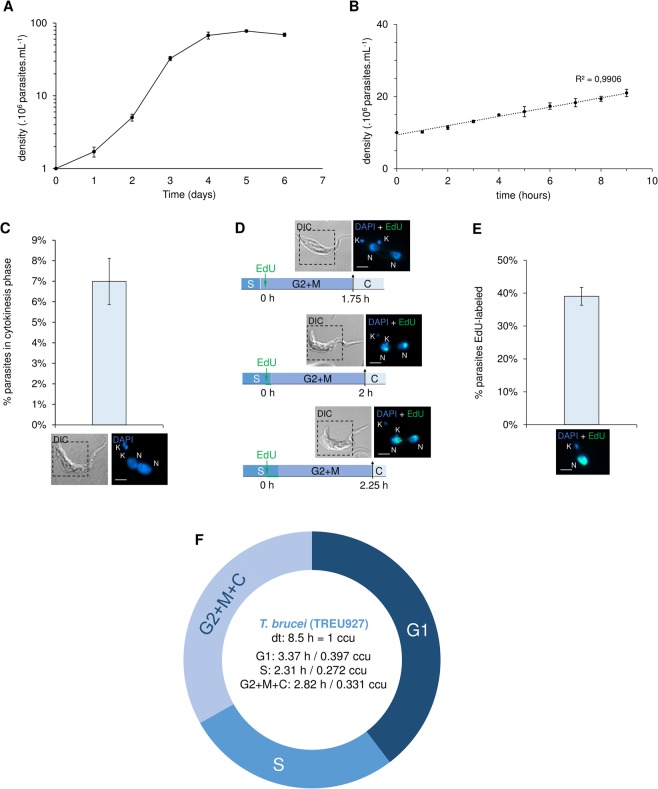
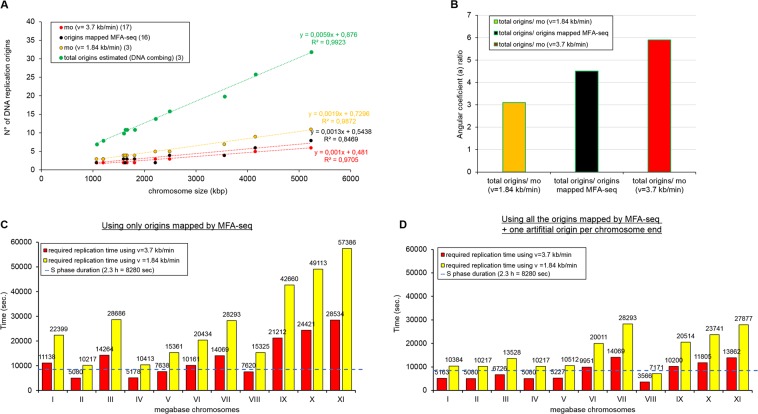
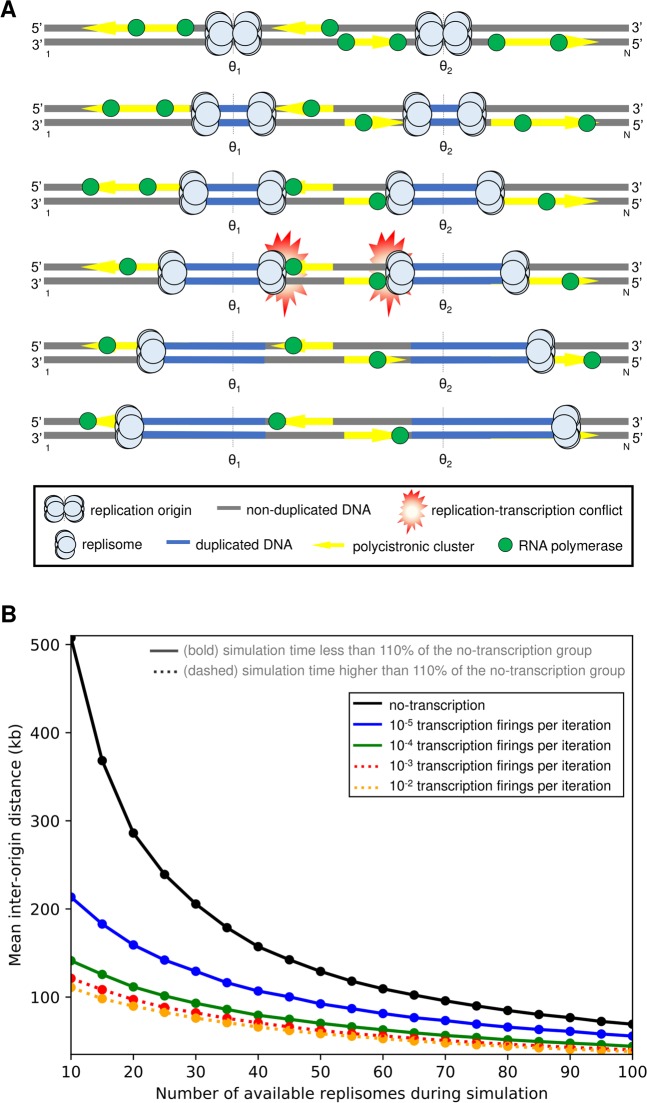
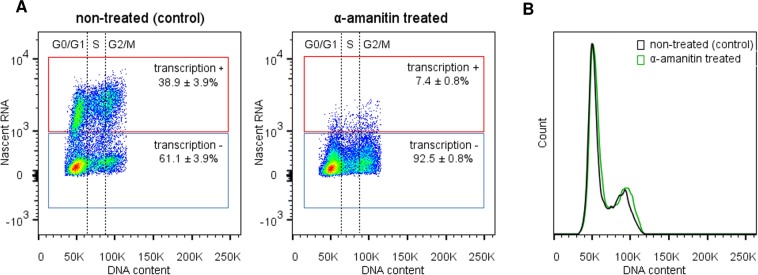
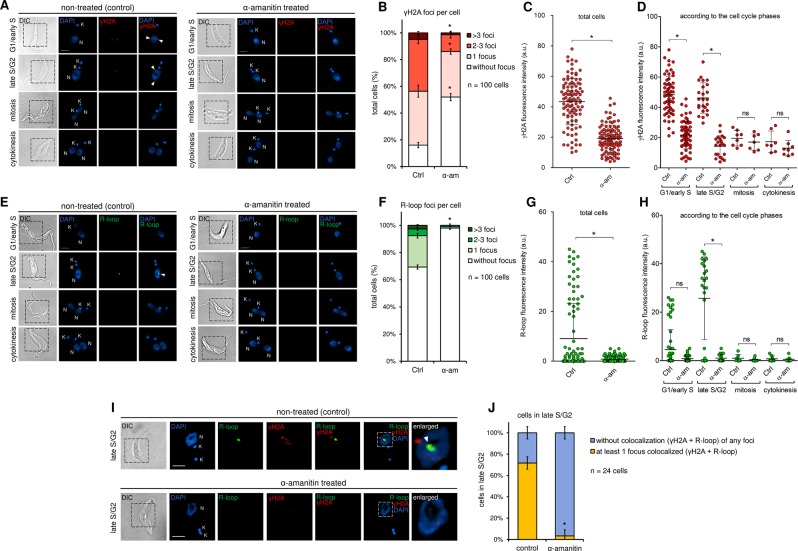
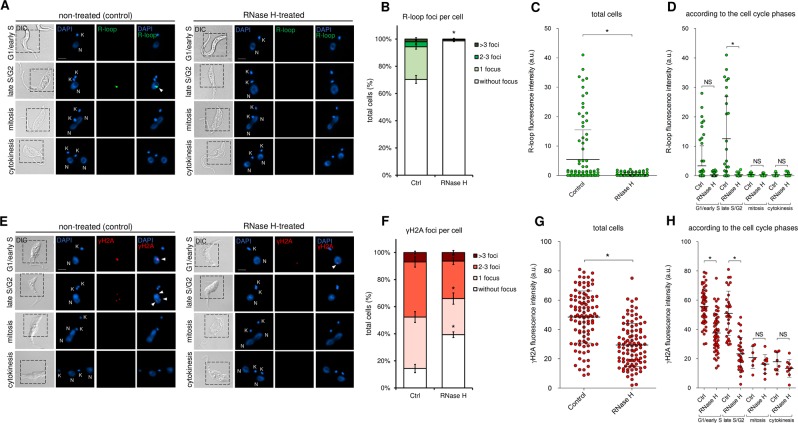
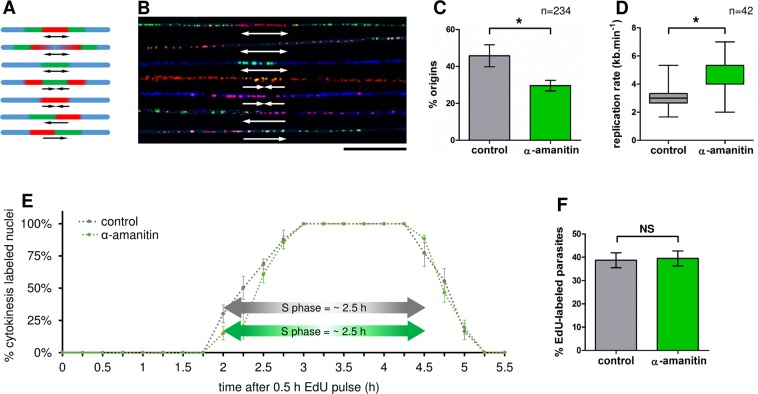
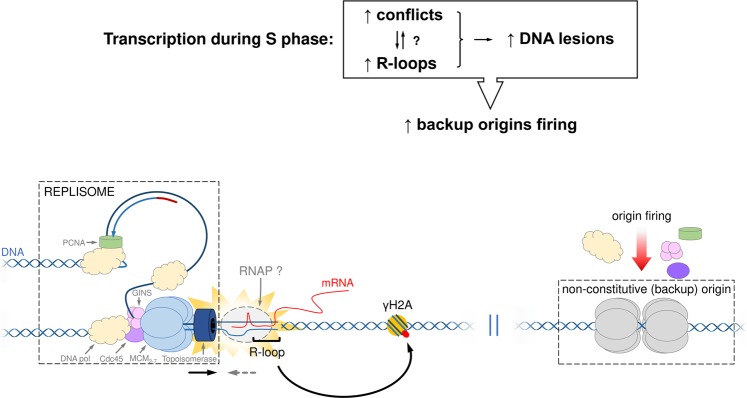
The co-synthesis of DNA and RNA potentially generates conflicts between replication and transcription, which can lead to genomic instability. In trypanosomatids, eukaryotic parasites that perform polycistronic transcription, this phenomenon and its consequences are still little studied. Here, we showed that the number of constitutive origins mapped in the Trypanosoma brucei genome is less than the minimum required to complete replication within S-phase duration. By the development of a mechanistic model of DNA replication considering replication-transcription conflicts and using immunofluorescence assays and DNA combing approaches, we demonstrated that the activation of non-constitutive (backup) origins are indispensable for replication to be completed within S-phase period. Together, our findings suggest that transcription activity during S phase generates R-loops, which contributes to the emergence of DNA lesions, leading to the firing of backup origins that help maintain robustness in S-phase duration. The usage of this increased pool of origins, contributing to the maintenance of DNA replication, seems to be of paramount importance for the survival of this parasite that affects million people around the world.


Conflict of interest statement

The authors declare no competing interests.

Figures

Figure 1
Figure 1
Estimation of S-phase duration in T. brucei TREU927. (A,B) The doubling time (dt) for procyclic forms of T. brucei was estimated to be 8.5 h (r2 = 0.9906). This estimate was confirmed taking the values at exponential phase and using Doubling Time software (http://www.doubling-time.com). Error bars indicate SD of three independent experiments. (C) DAPI-labeled parasites (2K2N) were used to measure the percentage of parasites in cytokinesis, which was estimated to be 6.99 ± 1.13% (n = 358). Error bars represent SD. The scale bars for the fluorescence images correspond to 2 µm. This value was used in Eq. 1 (19) to estimate the cytokinesis-phase duration. (D) To estimate the duration of the G2 + M phases, EdU was added to the culture, and parasites were continuously collected every 15 min until parasites containing two EdU-labeled nuclei in the same cell (cytokinesis) were observed. This pattern was observed after 2 h. This assay was carried out in triplicate, and in all replicates, we found a parasite containing two EdU-labeled nuclei at the same time. Scale bar = 2 µm. (E) EdU-labeled parasites (after 1 h EdU pulse) were used to estimate the percentage of parasites able to uptake this thymidine analog (39 ± 2.7%). Error bars represent SD. Scale bar = 2 µm. This value was used in Eq. 2 to estimate the S-phase duration. These assays were carried out in biological triplicate (n = 358 parasites). (F) New estimates for G1- and S-phase duration. ccu means cell cycle unit, where one unit corresponds to the specific doubling time for each strain.
Figure 2
Figure 2
The constitutive origins mapped in T. brucei are not enough to accomplish the complete DNA replication within S-phase duration. (A) Graph showing positive correlations between chromosome length and the number of replication origins estimated by DNA combing (total origins) (green dots), number of origins estimated by MFA-seq (black dots), minimum origins (mo) estimated using v = 3.7 kb.min−1 (red dots), and mo estimated using v = 1.84 kb.min−1 (yellow dots). The trend lines for all groups, as well as the equations, are shown. (B) Angular coefficient ratios between total origins and mo using v = 1.84 kb.min−1 (yellow bar = 3.1), total origins and origins estimated by MFA-seq (black bar = 4.5), and total origins and mo using v = 3.7 kb.min−1 (red bar = 5.9). (C) Minimum time required for each T. brucei chromosome to complete DNA replication according to the positions of the origins mapped by MFA-seq (16), using two different values for the replication rate: v = 3.7 kb.min−1 (red) or v = 1.84 kb.min−1 (yellow). The dashed line represents the estimated S-phase duration reported in this study. (D) To resolve the bias generated by the possible presence of origins hidden in subtelomeric/telomeric regions, we repeated the assay shown in C by adding an artificial origin per chromosome end. Of note, each origin was localized 50 kb upstream of the chromosome end.
Figure 3
Figure 3
A mechanistic model of DNA replication considering replication-transcription conflicts predicts an increase in the number of origins activated to keep robustness in S-phase duration. (A) Example of replication-transcription conflicts in T. brucei. When replication and transcription are simulated at the same time, if there is a head-to-head collision (replication-transcription conflicts), then the replication fork collapses, leading to an unbinding of its respective replisome and the involved RNAP. (B) Results of simulations with a stochastic dynamic model show the mean inter-origin distance (which is inversely proportional to the activation of origins) as a function of the transcription frequency and the number of available replisomes during a simulation (parameter F). The black line represents sets of simulations without the presence of constitutive transcription. The remaining bold lines (blue and green) represent simulations with constitutive transcription whose adopted frequencies (10−5 and 10−4 RNAP firings per iteration, respectively) result, for each F value, in a mean simulation time less than 110% of the no-transcription group. On the other hand, the dashed lines (red and orange) are simulations whose adopted frequencies (10−3 and 10−2 RNAP firings per iteration, respectively) incur in a mean simulation time higher than 110% of the no-transcription group.
Figure 4
Figure 4
Transcription landscape throughout the T. brucei cell cycle. (A) Density plot showing the distribution of the population according to DNA content and nascent RNA synthesis. Left – Non-treated (control) population showing transcriptional activity (nascent RNA) = 38.9 ± 3.9% (red square). Right – After transcription inhibition using α-amanitin, nascent RNA decreased to 7.4 ± 0.8% (red square). The cell cycle phases (G0/G1, S, and G2/M) are indicated. Red square – transcription-positive, blue square – transcription-negative. (B) Histograms show virtually unchanged DNA content profiles for the control (black line) and α-amanitin treated groups (green line). These assays were carried out in biological triplicate, and 20,000 parasites (n = 20,000) were counted in each analysis.
Figure 5
Figure 5
DNA lesions and R-loops are dependent on the transcription activity and partial colocalize at late S/G2 phases. (A) Left – The endogenous γH2A foci shown by nontreated (control) parasites suggest the presence of DNA lesions mainly during G1/early S and late S/G2. Right – γH2A foci decreased after transcription inhibition (α-amanitin treated). (B) Graph showing the number of γH2A foci per cell before and after α-amanitin treatment. (C) Graph showing the γH2A fluorescence intensity (red) per cell in total cells and (D) according to the cell cycle phase analyzed. Errors bars indicate SD. The difference observed was statistically significant using Student’s t-test (*p < 0.001) for a biological triplicate assay (n = 100). (E) Left – The control parasites showed endogenous R-loops foci predominantly during late S/G2. Right – After transcription inhibition, these R-loop foci decreased. (F) Graph showing the number of R-loop foci per cell before and after α-amanitin treatment. (G) Graph showing the R-loop fluorescence intensity (green) per cell in total cells and (H) according to the cell cycle phase analyzed. Errors bars indicate SD. The difference observed was statistically significant using Student’s t-test (*p < 0.01) for a biological triplicate assay (n = 100). (I) Representative confocal images show partial colocalization (white triangle) between γH2A (red) and R-loop (green) during late S/G2 in the control group. After transcription inhibition, this partial colocalization disappeared, as expected. (J) Bar graph shows 69.9 ± 3.35% of parasites that are in late S/G2 phase show at least 1 focus colocalized (γH2A + R-loop). After transcription inhibition, this value fell to 1.1 ± 1.9%. Yellow bar – at least one focus colocalized (γH2A + R-loop), blue bar – without colocalization of any foci (γH2A + R-loop). Errors bars indicate SD. The difference observed was statistically significant using Student’s t-test (*p < 0.01) for a biological triplicate assay (n = 24 parasites). Using Pearson’s correlation coefficient, we obtained r = 0.5, suggesting a moderate correlation.
Figure 6
Figure 6
R-loops contributes to the generation of DNA lesions. (A) RNase H treatment resolves R-loops. Just like results showed on Fig. 5E, the non-treated (control) parasites showed basal levels of R-loops only during late S/G2 (green). After RNase H treatment, the basal levels of fluorescence intensity, as well as the number of R-loop foci per cell disappear, which confirm the specificity of the antibody used. (B) Graph showing the number of R-loop foci per cell before and after RNase H treatment. (C) Graph showing the R-loop fluorescence intensity (green) per cell in total cells and (D) according to the cell cycle phase analyzed, before and after RNase treatment. (E) After RNase treatment, the endogenous levels of γH2A fluorescence intensity, as well as the number of foci per cell, decrease significantly, which suggests that R-loops contributes to the DNA lesions observed. (F) Graph showing the number of γH2A foci per cell before and after RNase H treatment. (G) Graph showing the γH2A fluorescence intensity (red) per cell in total cells and (H) according to the cell cycle phase analyzed, before and after RNase treatment. Error bars indicate SD. The differences observed were statistically significant using the Student’s t-test (*p < 0.05).
Figure 7
Figure 7
Transcription contributes to the backup-origins firing helping to maintain robustness in S-phase duration. (A) Scheme showing the possible DNA fibers-patterns we looked for during our analysis. (B) Representative images of the DNA fibers analyzed after a random capture of several image fields. From top to bottom, the fibers represent: origin, origin, origin, termination, termination, replication fork, and replication fork. The arrows represent the fork direction. Bar = 20 μm. (C) Bar graph showing that the percentage of origins measured in control (45.77 ± 3.4%) relative to α-amanitin treated group (29.6 ± 1.6%). Error bars indicate SD. The differences observed were statistically significant using the Student’s t-test (*p < 0.05) for a biological triplicate assay (n = 234). (D) Using the formula (142length/42)/timeofCldUpulse, we compared the replication rate in control (3.06 ± 0.21 kb.min−1) and α-amanitin treated group (4.76 ± 0.27 kb.min−1). Error bars indicate SD. The differences observed were statistically significant using the Student’s t-test (*p < 0.05) for a biological triplicate assay (n = 42). (E) To estimate the S-phase duration after transcription inhibition, we performed a 30-min EdU pulse and quantified the percentage of cytokinesis-labeled nuclei every 15 min. The bars represent the SD from an assay carried out in biological triplicate (n = 20 cells for each time point analyzed, totaling n = 460 cells). (F) Bar graph showing the percentage of parasites able to uptake EdU after a 30-min pulse: 38.7 ± 3.2% for control and 39.5 ± 3.2% for the α-amanitin-treated group. The difference observed was not statistically significant using Student’s t-test (NS = not-significant) for a biological triplicate assay (n = 569 cells).
Figure 8
Figure 8
Model showing consequences of the transcription activity during the S phase in T. brucei. During the S phase, transcription can generate replication-transcription conflicts and R-loops. Our findings did not allow us to distinguish if R-loops are a consequence of replication-transcription conflicts or the cause of replication hindering, However, according to our data, both conflicts and R-loops contribute to the presence of endogenous DNA lesions (γH2A) and backup-origins firing, helping to maintain robustness in S-phase duration. The backup-origins firing may help to explain the discrepancy observed by us regarding the number of constitutive origins are not enough to allow a complete DNA replication within the S-phase duration (Fig. 2). Further studies are necessary to investigate if the activation of the backup origins occurs in an active (triggered by replication stress) or passive (stochastic) manner.

References

    1. Leonard AC, Méchali M. DNA replication origins. Cold Spring Harb. Perspect. Biol. 2013;5:a010116. doi: 10.1101/cshperspect.a010116. - DOI - PMC - PubMed
    1. Myllykallio H, et al. Bacterial mode of replication with eukaryotic-like machinery in a hyperthermophilic archaeon. Science. 2000;288:2212–5. doi: 10.1126/science.288.5474.2212. - DOI - PubMed
    1. Stanojcic S, et al. Single-molecule analysis of DNA replication reveals novel features in the divergent eukaryotes Leishmania and Trypanosoma brucei versus mammalian cells. Sci. Rep. 2016;6:23142. doi: 10.1038/srep23142. - DOI - PMC - PubMed
    1. Turrero García M, Chang Y, Arai Y, Huttner WB. S-phase duration is the main target of cell cycle regulation in neural progenitors of developing ferret neocortex. J. Comp. Neurol. 2016;524:456–470. doi: 10.1002/cne.23801. - DOI - PMC - PubMed
    1. Günesdogan U, Jäckle H, Herzig A. Histone supply regulates S phase timing and cell cycle progression. Elife. 2014;3:e02443. doi: 10.7554/eLife.02443. - DOI - PMC - PubMed

Publication types

LinkOut - more resources