. 2020 Jan;30(1):34-49.
doi: 10.1038/s41422-019-0259-z. Epub 2019 Dec 6.

Tissue-specific transcription reprogramming promotes liver metastasis of colorectal cancer

Affiliations

Tissue-specific transcription reprogramming promotes liver metastasis of colorectal cancer

Shuaishuai Teng et al. Cell Res. 2020 Jan.

Abstract

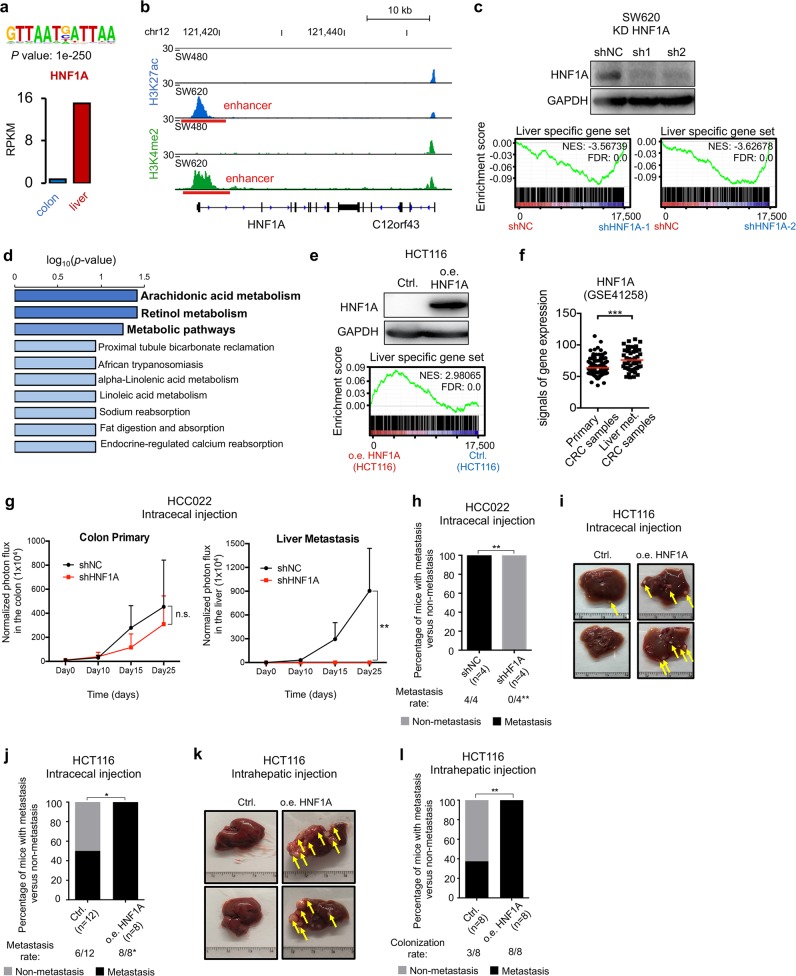
Metastasis, the development of secondary malignant growths at a distance from a primary tumor, is the cause of death for 90% of cancer patients, but little is known about how metastatic cancer cells adapt to and colonize new tissue environments. Here, using clinical samples, patient-derived xenograft (PDX) samples, PDX cells, and primary/metastatic cell lines, we discovered that liver metastatic colorectal cancer (CRC) cells lose their colon-specific gene transcription program yet gain a liver-specific gene transcription program. We showed that this transcription reprogramming is driven by a reshaped epigenetic landscape of both typical enhancers and super-enhancers. Further, we identified that the liver-specific transcription factors FOXA2 and HNF1A can bind to the gained enhancers and activate the liver-specific gene transcription, thereby driving CRC liver metastasis. Importantly, similar transcription reprogramming can be observed in multiple cancer types. Our data suggest that reprogrammed tissue-specific transcription promotes metastasis and should be targeted therapeutically.


Conflict of interest statement

The authors declare no competing interests.

Figures

Fig. 1
Fig. 1
Reprogrammed tissue-specific transcription in liver metastatic CRC tumors. a Schematic diagram demonstrating primary and liver-metastatic tumors for our CRC experiments. b GSEA of liver-specific gene set, as defined by using the expression data from GTEx project database, in human liver metastasis CRC tumors from the GSE41258, GSE49355, and GSE50760 datasets. Genes are ranked by log2 fold changes of averaged expression values of multiple primary and liver metastasis CRC samples. The normalized enrichment scores (NES) and tests of statistical significance (FDR) are shown. met., metastasis. c GSEA of liver-specific gene set, as defined using the expression data from the GTEx project database, for human liver metastasis CRC tumors growing in mice (PDX model). Genes are ranked by log2 fold change of expression values in liver metastasis CRC sample versus primary CRC sample. The normalized enrichment scores (NES) and tests of statistical significance (FDR) are shown. met., metastasis. d Plots showing the IHC scores for LIPC, INHBE, and CYP27A1 in human primary CRC tumors and in liver metastatic tumors. Each dot represents one primary or liver metastatic CRC tumor, and the red bar represents the mean value. Statistically-significant P values are indicated with asterisks (*P < 0.05, **P < 0.01, ***P < 0.001, by t-test). e Representative IHC images of LIPC, INHBE and CYP27A1 expression in human primary CRC tumor and liver metastatic CRC tumor. f Liver-specific genes with significantly up-regulated transcription in liver metastatic CRC tumor samples. The expression data are from the GSE41258 dataset. Each dot represents one primary or liver metastatic CRC tumor; red bars represent mean values. Statistically significant P values are indicated with asterisks (***P < 0.001, by t-test). g Proportion surviving analyses were performed using published clinical data in the cancer genome atlas (TCGA). The subset of CRC patients from the GSE41258 dataset with high expression levels for liver-specific genes in their primary tumors had significantly worse overall survival (OS) outcomes than did the subset of patients with low expression levels for these genes. Liver specific genes were obtained by overlapping highly expressed genes in human liver metastatic samples compared with primary tumors (log2FC > 0.6) and a tissue-specific gene set defined by GTEx (see Methods) (Left panel). The subset of CRC patients with high expression levels for LIPC and CYP27A1 in their primary tumors had significantly worse overall survival (OS) outcomes than did the subset of patients with low expression levels for these genes (Right two panels). High, Top 20% patients; Low, bottom 20% patients; Med, the rest; FC: fold change of expression. P values were calculated by a log-rank (Mantel-Cox) test
Fig. 2
Fig. 2
Reprogrammed tissue-specific transcription in liver metastatic CRC cells. a Schematic diagram demonstrating paired primary and liver metastasis cells for our CRC experiments. b GSEA of liver-specific gene set (left) and colon-sigmoid-specific gene set (right) as defined from the GTEx project database in SW620 and SW480 cells. The genes are ranked by the log2 fold change of the FPKM values in SW620 and SW480 cells. The NES and FDR are shown. met., Metastasis. c Heatmap showing expression levels of 50 out of 112 liver- and 24 out of 77 colon-specific genes in SW480 and SW620 cells are consistent with them in human primary and liver metastatic CRC tumors. Gene expression values for tumor samples are from GSE41258 dataset. met., metastasis. d Tissue-specific transcription reprogramming occurs in metastatic cancer cells (CCLE data) of 11 types of cancer metastases. The red and blue bars in the chart show the % of cell pairs gain gene signature of distant tissue and original tissue, respectively. We integrated multiple GSEA for representative examples into a bubble map. Each enrichment is summarized as a bubble in a color matching the population in which the gene set was enriched. Bubble area and color intensity indicate NES and FDR, respectively. met., Metastasis. e GSEA of original- and distant-tissue gene sets in prostate-to-bone metastasis, colon-to-lung metastasis, lung-to-liver metastasis, prostate-to-brain metastasis and pancreas-to-liver metastasis. The NES and FDR are shown. The number of samples used for the GSEA are listed in brackets for primary and metastatic tumors, respectively. met., metastasis
Fig. 3
Fig. 3
Variations in enhancer and super-enhancer landscape between primary and liver metastatic CRC cells. a Venn diagram indicating overlap and specificity of enhancers marked by H3K4me2 and H3K27ac in SW480 and SW620 cells. b Heatmap showing the densities of enhancers marked by H3K4me2 and H3K27ac at the nearest differentially expressed genes between non-metastatic SW480 and liver metastatic CRC SW620 cells. Rows are ordered the same for all plots. RNA-seq and ChIP-seq signals are shown as log2 of tag counts normalized to 1 × 107 uniquely mapped tags. c Boxplots showing log2 ratios of SW620 to SW480 tag densities for genomic regions marked by H3K4me2 (left) and H3K27ac (right) around genes that are colon-specific genes with high expression in SW480 cells and liver-specific genes with high expression in SW620 cells. Statistically significant P value is indicated with asterisks (***P < 0.005, by t-test). spec., specific; reg., regulation. d Boxplots showing log2 ratios of PC-3 (bone metastatic prostate cancer cells) to 22Rv1 (primary prostate cancer cells) (left), T84 (lung metastatic CRC cells) to HCT116 (primary CRC cells) (middle) and Capan-1 (liver metastatic pancreas cancer cells) to Capan-2 (primary pancreas cancer cells) (right) tag densities for genomic regions marked by H3K27ac around tissue-specific genes that are relatively highly expressed in corresponding cells. Statistically significant P value is indicated with asterisks (***P < 0.005, by t-test). spec., specific; reg., regulation. e Enhancers are ranked by increasing H3K27ac ChIP-seq signal in primary (SW480) and liver-prone metastasis CRC cells (SW620). Points in red indicated super-enhancers, which are past the point where the slope is greater than 1. f Venn diagram indicating overlap and specificity of super-enhancers in SW480 and SW620 cells. g Scatterplot of the relationship between the ratio of SW480 to SW620 H3K27ac tag density at super-enhancers (x axis) and the ratio of nearest gene expression (y axis). The RNA-seq and ChIP-seq signals are shown as log2 of tag counts normalized to 1 × 107 uniquely mapped tags. Red dots represent some liver-specific genes (FOXA2, SARDH, ENO3, SLC9A3R2, ABHD2, LRP5 and PROX1) associated with super-enhancers. The Pearson correlation coefficient is 0.807 and P < 2.2e-16. h UCSC genome browser images of super-enhancers around a liver-specific gene SARDH and a colon-specific gene GLI3 in SW620 and SW480 covered genomic regions marked by H3K27ac. Bars labeled with SE indicate super-enhancers
Fig. 4
Fig. 4
FOXA2 is required for the activation of liver-specific genes and liver colonization of CRC cells. a Top enriched DNA binding motifs with significant P values, identified in a de novo motif analysis of SW620-unique enhancers (non-promoter regions marked by H3K4me2, far from 3 kb up- or downstream of TSS). b The blue and red bars in the chart show the expression of FOXA2 in normal colon and liver tissues, respectively. The Y axis shows the mean RPKM value. RNA-seq data were obtained from the GTEx project database. c UCSC genome browser images of a super-enhancer around the liver-specific gene FOXA2 in SW620 and SW480 covered genomic regions marked by H3K27ac and H3K4me2, with corresponding RNA-seq data for SW480 and SW620 cells. Bars labeled with SE indicate super-enhancers. d Immunoblot analysis was used to assess the efficiency of FOXA2 knockdown in SW620 cells. GAPDH served as a loading control (Left panel). GSEA of liver-specific signatures as defined from the GTEx project database is shown. Genes are ranked by the log2 fold change of the FPKM values in SW620 FOXA2-knockdown versus shNC cells. The NES and FDR are shown (Right two panels). e Immunoblot analysis was used to assess efficiency of FOXA2 knockdown in Colo205 cells. GAPDH served as a loading control (Left panel). GSEA of liver-specific signatures as defined from the GTEx project database is shown. Genes are ranked by the log2 fold change of the FPKM values in Colo205 FOXA2-knockdown versus shNC cells. The NES and FDR are shown (Right two panels). f Immunoblot analysis was used to assess efficiency of FOXA2 overexpression in SW480 cells. GAPDH served as a loading control (Left panel). GSEA of liver-specific signatures as defined from the GTEx project database is shown. Genes are ranked by the log2 fold change of the FPKM values in SW480 FOXA2-overexpression versus Control cells. The NES and FDR are shown (Right panel). g Immunoblot analysis was used to assess efficiency of FOXA2 overexpression in HCT116 cells. GAPDH served as a loading control (Left panel). GSEA of liver-specific signatures as defined from the GTEx project database is shown. Genes are ranked by the log2 fold change of the FPKM values in HCT116 FOXA2-overexpression versus Control cells. The NES and FDR are shown (Right panel). h FOXA2 is highly expressed in human liver metastatic CRC tumors as compared with primary tumors. The expression data are from the GSE41258 dataset. Each dot represents one primary or liver metastatic CRC tumor, and the red bar represents the mean value. Statistically significant P values are indicated with asterisks (***P < 0.001, by t-test). i Plots showing the IHC scores for the nuclear FOXA2 in human primary CRC tumors and liver metastatic CRC tumors. Each dot represents one primary or liver metastatic CRC tumor, and the red bar represents the mean value. Statistically-significant P values are indicated with asterisks (**P < 0.005, by t-test). j Representative IHC images of FOXA2 expression in paired CRC primary tumors and liver metastatic tumors. Scale bars, 500 µm. k Representative images of the liver colonies upon intrahepatic injection of SW620 shNC and shFOXA2 cells. l The stacked bars indicate the percentage of mice with liver colonies or with no liver colonies relative to the total number of mice in each section. Data were analyzed using Pearson’s Chi-square test. *P < 0.05, ***P < 0.001. The hepatic colonization rate is indicated at the bottom. m Representative images of the liver colonies (Top panel) upon intrahepatic injection of SW480 Control and FOXA2-overexpressing cells. The stacked bars indicate the percentage of mice with liver colonies and with no liver colonies relative to the total number of mice in each section. Data were analyzed using Pearson’s Chi-square test. n.s., not significant. The hepatic colonization rate is indicated at the bottom (Bottom panel). n Representative images of the liver colonies (Top panel) upon intracecal injection of HCT116 Control and FOXA2-overexpressing cells. The stacked bars indicate the percentage of mice with liver colonies and with no liver colonies relative to the total number of mice in each section. Data were analyzed using Pearson’s Chi-square test. n.s., not significant. The hepatic metastasis rate is indicated at the bottom (Bottom panel)
Fig. 5
Fig. 5
HNF1A is required and sufficient for the expression of liver specific genes in CRC cells and liver colonization and metastasis. a The blue and red bars in the chart show HNF1A gene expression in normal colon and liver tissues, respectively. The Y axis shows the mean RPKM value. The RNA-seq data were obtained from the GTEx project database. b UCSC genome browser images of an enhancer around the liver-specific gene HNF1A in SW620 and SW480 covered genomic regions marked by H3K27ac and H3K4me2. c Immunoblot analysis was used to assess efficiency of HNF1A knockdown in SW620 cells. GAPDH served as a loading control (Top panel). GSEA of liver-specific signatures as defined from the GTEx project database is shown. Genes are ranked by the log2 fold change of the FPKM values in HNF1A-knockdown versus shNC cells. The NES and FDR are shown (Bottom two panels). d Gene ontology analysis of down-regulated genes by HNF1A knockdown. e Immunoblot analysis was used to assess efficiency of HNF1A overexpression in HCT116 cells. GAPDH served as a loading control (Top panel). GSEA of liver-specific signatures as defined from the GTEx project database is shown. Genes are ranked by the log2 fold change of the FPKM values in HCT116 HNF1A-overexpression versus Control cells. The NES and FDR are shown (Bottom panel). f HNF1A is highly expressed in human liver metastatic CRC tumors as compared with primary tumors. The expression data are from the GSE41258 dataset. Each dot represents one primary or liver metastatic CRC tumor, and the red bar represents the mean value. Statistically-significant P values are indicated with asterisks (***P < 0.001, by t-test). g Luciferase measurements from different time points upon intracecal injection of HCC022 shNC and shHNF1A cells. An shHNF1A virus pool (3 HNF1A shRNA sequences) was expressed in HCC022 cells and shNC and shHNF1A cells were injected into mice using intracecal injection (n = 4 shNC mice and n = 4 shHNF1A mice). Then a time-course analysis of luciferase measurements in mice was performed; Black lines represent shNC control group and red lines represent shHNF1A mice group. Error bars represent standard deviation of the mean. Student’s t test, P < 0.01, n.s., not significant. h The stacked bars indicate the percentage of mice with liver metastases or with no liver metastases relative to the total number of mice in each section. The hepatic metastasis rate of HCC022 cells is indicated at the bottom. Data were analyzed using Pearson’s Chi-square test. **P < 0.01. i Representative images of the metastases upon intracecal injection of HCT116 control and HNF1A-overexpressing cells. j The stacked bars indicate the percentage of mice with liver metastases or with no liver metastases relative to the total number of mice in each section. The hepatic metastasis rate is indicated at the bottom. Data were analyzed using Pearson’s Chi-square test. *P < 0.05. k Representative images of the metastases upon intrahepatic injection of control and HNF1A-overexpressing HCT116 cells. l The stacked bars indicate the percentage of mice with liver colonies and without liver colonies relative to the total number of mice in each section. The hepatic colonization rate is indicated at the bottom. Data were analyzed using Pearson’s Chi-square test. **P < 0.01
Fig. 6
Fig. 6
Model for tissue-specific transcription reprogramming that promotes liver metastasis of colorectal cancer

References

    1. Steeg PS. Targeting metastasis. Nat. Rev. Cancer. 2016;16:201–218. - PMC - PubMed
    1. Yang J, et al. Twist, a master regulator of morphogenesis, plays an essential role in tumor metastasis. Cell. 2004;117:927–939. - PubMed
    1. Hoshino A, et al. Tumour exosome integrins determine organotropic metastasis. Nature. 2015;527:329–335. - PMC - PubMed
    1. Dupuy F, et al. PDK1-dependent metabolic reprogramming dictates metastatic potential in breast cancer. Cell Metab. 2015;22:577–589. - PubMed
    1. Bos PD, et al. Genes that mediate breast cancer metastasis to the brain. Nature. 2009;459:1005–U1137. - PMC - PubMed

Publication types

MeSH terms

Substances