. 2020 Feb 20;77(4):913-925.e4.
doi: 10.1016/j.molcel.2019.11.010. Epub 2019 Dec 4.

Functional Translatome Proteomics Reveal Converging and Dose-Dependent Regulation by mTORC1 and eIF2α

Affiliations

Functional Translatome Proteomics Reveal Converging and Dose-Dependent Regulation by mTORC1 and eIF2α

Kevin Klann et al. Mol Cell. .

Abstract

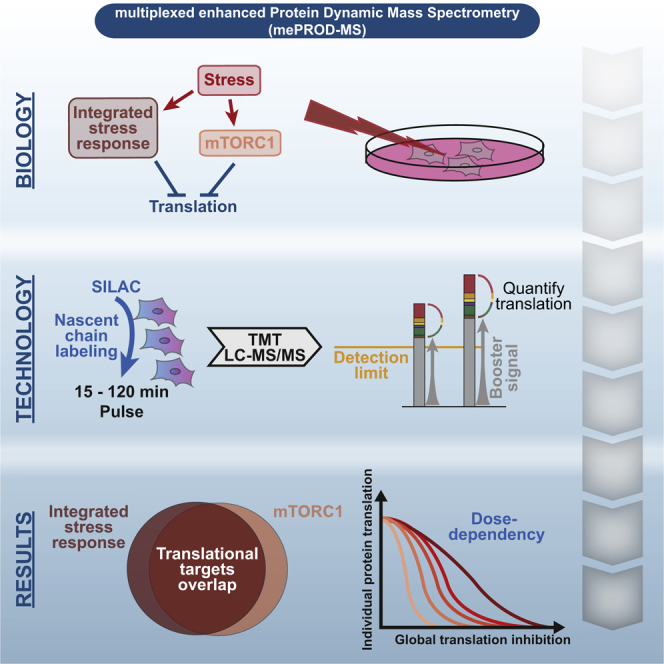
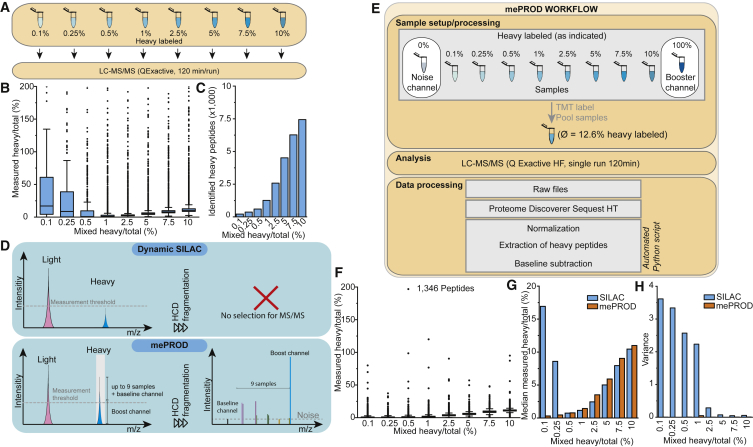
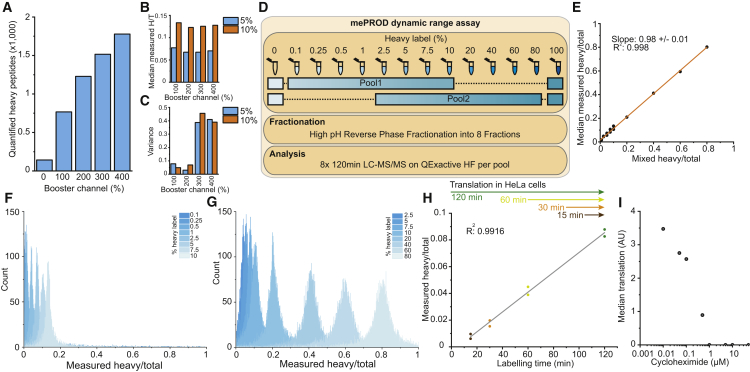
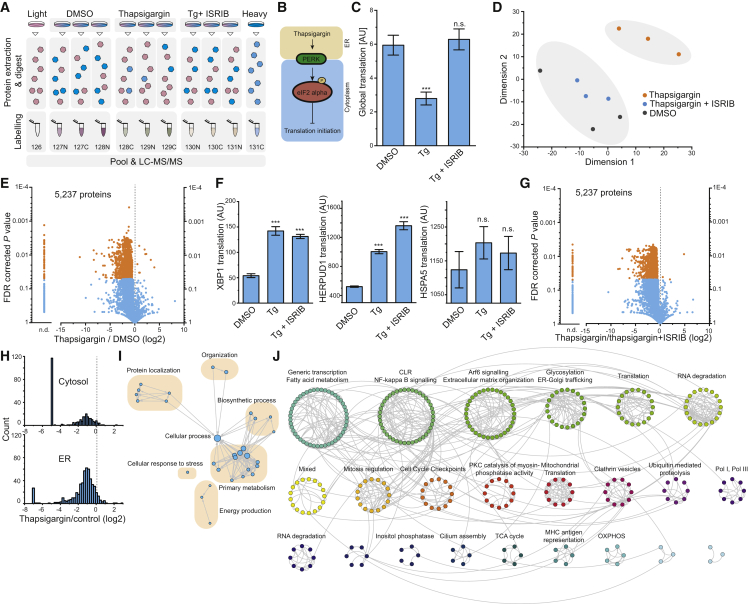
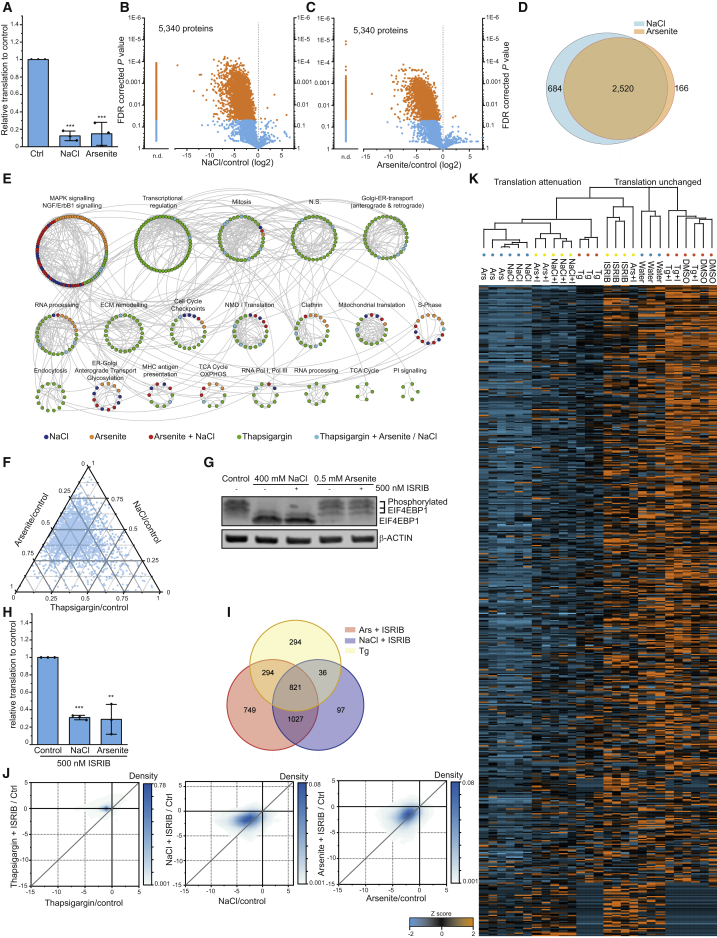
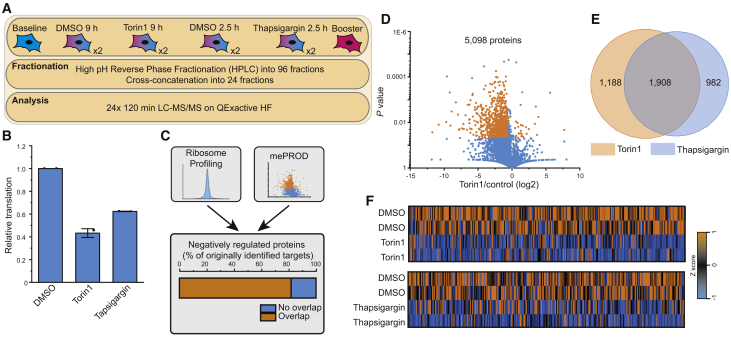
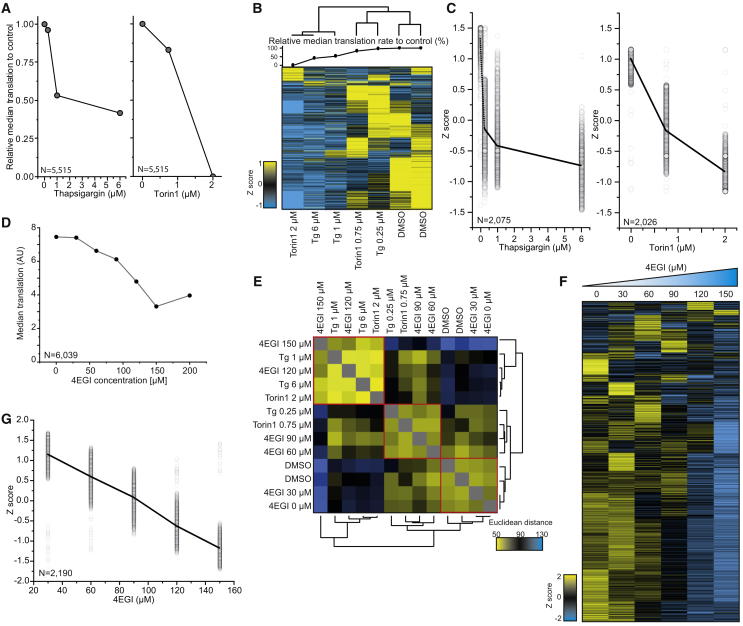
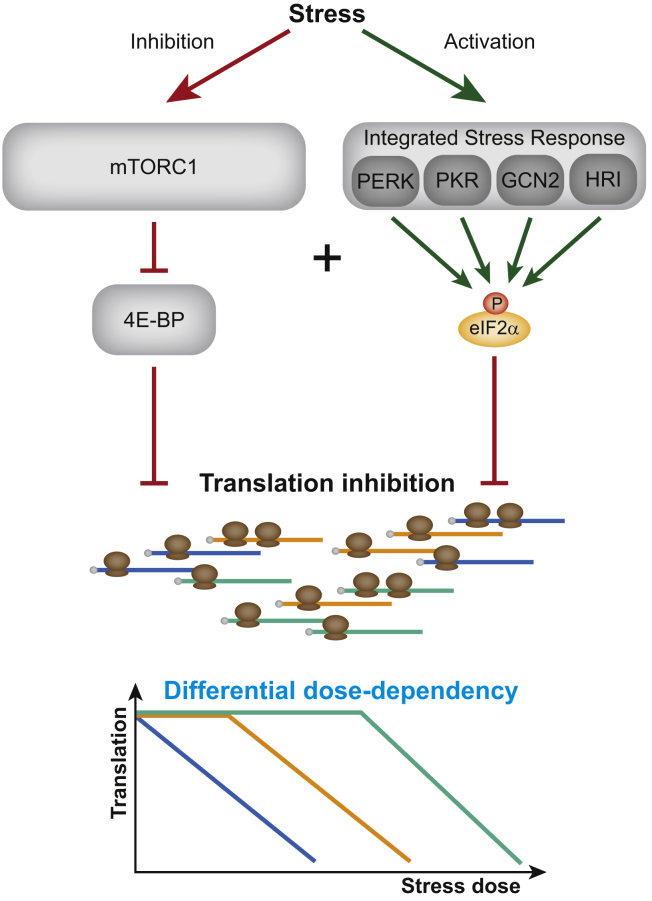
Regulation of translation is essential during stress. However, the precise sets of proteins regulated by the key translational stress responses-the integrated stress response (ISR) and mTORC1-remain elusive. We developed multiplexed enhanced protein dynamics (mePROD) proteomics, adding signal amplification to dynamic-SILAC and multiplexing, to enable measuring acute changes in protein synthesis. Treating cells with ISR/mTORC1-modulating stressors, we showed extensive translatome modulation with ∼20% of proteins synthesized at highly reduced rates. Comparing translation-deficient sub-proteomes revealed an extensive overlap demonstrating that target specificity is achieved on protein level and not by pathway activation. Titrating cap-dependent translation inhibition confirmed that synthesis of individual proteins is controlled by intrinsic properties responding to global translation attenuation. This study reports a highly sensitive method to measure relative translation at the nascent chain level and provides insight into how the ISR and mTORC1, two key cellular pathways, regulate the translatome to guide cellular survival upon stress.

Keywords: SILAC; TMT; cap-dependent translation; integrated stress response; mTOR; proteomics; pulse labeling; stress response; translation; unfolded protein response.


Conflict of interest statement

Declaration of Interests The authors declare no competing interests.

Figures

None
Graphical abstract
Figure 1
Figure 1
mePROD Proteomics Overcomes Low Accuracy and Identifications of Peptides at Low Heavy-to-Light Ratio (A) Scheme of experimental design. Heavy and light peptides were mixed at indicated ratios. (B) Measured heavy to total ratios on peptide level. Boxes indicate 25%/50% quartiles and the median; whiskers show standard deviation. (C) Number of heavy labeled peptides quantified in (B). (D) Underlying principle of mePROD to increase signals of interest. Low labeling stoichiometry prevents reaching the measurement threshold using standard dynamic SILAC approaches (top). In mePROD, a booster channel comprised of a fully heavy labeled proteome boosts the signal of interest above the MS1 detection level (bottom). Heavy/total ratios for individual samples are then then determined from TMT signals quantified in MS2 (right). (E) Experimental mePROD design and data processing. Samples from (A) were combined with noise and booster channels, TMT-labeled, pooled, analyzed by LC-MS2, and raw files processed. Reporter ion intensities for peptides were sum normalized and heavy peptide intensities extracted. To enhance accuracy, baseline values derived from the non-SILAC labeled channel were subtracted from each peptide. (F) Samples as in (A) were analyzed using mePROD (using 1/8th of the LC-MS2 machine time used in A). Comparison of measured versus expected heavy/total ratios. Boxes indicate 25%/50% quartiles and the median; whiskers show standard deviation. (G and H) Comparison of median measured heavy/total peptide ratios (G) or variance (H) for samples measured by SILAC or mePROD. See also Figure S1.
Figure 2
Figure 2
High Dynamic Range of mePROD to Measure Heavy/Light Peptide Ratios and Translation (A–C) mePROD 6-plex samples were prepared mixing noise channel, two replicates of each 5% and 10% heavy/total peptide mix, and indicated amounts (relative to samples) of fully labeled booster channel. Shown are numbers of identified and quantified peptides (A), measured heavy/total (H/T) ratios (B), and variance (C). (D–G) Experimental design (D). Two mePROD 10-plex samples including samples ranging from 0.1% to 10% and 2.5% to 80% heavy labeled peptides were mixed with noise and booster channel as indicated, fractionated, and analyzed. Comparison of measured versus expected heavy/total ratios (E). Histograms depicting count distributions of measured heavy/total ratios of 10-plexes ranging from 0.1%–10% (F) and 2.5%–80% (G). (H) Measured heavy/total peptide ratios of cells incorporating heavy amino acids into newly synthesized proteins for different lengths of time measured by mePROD (n = 2). (I) Cells were pre-treated for 2 h with indicated concentrations of cycloheximide and pulse-labeled for an additional 2 h with SILAC medium. Median global translation was measured and plotted against cycloheximide concentration. See also Figure S1.
Figure 3
Figure 3
Changes in the Cellular Translatome upon Activation of the Integrated Stress Response by Protein Misfolding in the Endoplasmic Reticulum (A) Experimental layout. Three different conditions were pooled (in triplicate) with noise and booster channels and analyzed by mePROD MS. (B) Scheme of translational repression during the UPR, induced by PERK activation. (C and D) Global translation levels assessed by mePROD MS for cell treated with DMSO, 1 μM thapsigargin (Tg), or 1 μM thapsigargin and 500 nM ISRIB (Tg + ISRIB) for 2.5 h. Shown are median intensities of heavy labeled peptides (C). Error bars indicate standard deviation (n = 3). ∗∗∗p < 0.001; n.s., not significant (two-sided, unpaired Student’s t test with equal variance). AU, arbitrary units. Multidimensional scaling analysis of samples standardized by unit variance (D). (E) Volcano plot showing fold change of relative translation versus adjusted p value of thapsigargin versus control treated cells. Orange dots indicate significantly changing proteins (p values < 0.05 and fold change [log2] ≤ −0.5 or ≥ 0.5). Samples for which abundances in thapsigargin treated samples dropped below baseline and no fold change could be calculated are indicated as not determinable (n.d.). (F) Changes in translation levels of XBP1, HERPUD1, and HSPA5 (better known as BIP) measured by mePROD MS. Mean heavy abundance was plotted with error bars indicating standard deviation (n = 3). ∗∗∗p < 0.001; n.s., not significant (two-sided, unpaired Student’s t test with equal variance). Tg, thapsigargin. (G) Volcano plot showing fold change versus adjusted p value between thapsigargin and thapsigargin+ISRIB treated samples. Significantly changing proteins in orange (as in E). (H) Histogram depicting translation changes for cytosolic versus endoplasmic reticulum resident proteins. (I) EnrichmentMap network showing significantly (q value < 0.001) enriched GO terms for proteins without significantly changed relative translation rates upon thapsigargin treatment. (J) ReactomeFI cluster analysis for proteins not changing relative translation rates upon thapsigargin treatment. Proteins were FI annotated, clustered, and clusters analyzed for significantly enriched Reactome pathways (q value < 0.001). The most prominent pathway of each cluster is indicated. Connecting lines show interaction of protein nodes. See also Table S1 and Figures S2–S4.
Figure 4
Figure 4
Translatome Repression Patterns Shared across Stress Response Pathways (A) Mean median translation levels of samples treated with water, 400 mM NaCl, or 0.5 mM arsenite for 2.5 h measured by mePROD MS. Individual values are indicated. Error bars show standard deviation (n = 3). ∗∗∗p < 0.001 (Two-way Student’s t test). (B and C) Volcano plot showing fold change versus p value for NaCl (B) or arsenite (C) versus control. Orange dots indicate significantly changing proteins. n.d., not determinable (intensities for treated samples below noise levels). (D) Overlap between translational repressed proteins (fold change [log2] < −0.5 and adj. p < 0.05) in NaCl or arsenite-treated cells. (E) ReactomeFI cluster network (q value < 0.001). Unchanged proteins in three treatments (thapsigargin, NaCl, arsenite, fold change [log2] > −0.35) were merged into one network, clustered by functional enrichment, and clusters analyzed for reactome pathway enrichment. Proteins were colored according to dataset and most prominent pathways of each cluster annotated. Connecting lines show interaction of protein nodes. (F) Ternary plot comparing fold changes for each protein between thapsigargin, NaCl, or arsenite treatments. For each protein and treatment, fold changes were summed and ratios to total fold changes determined and plotted. (G) Western blot showing phosphorylation of EIF4EBP1 upon control, NaCl, or arsenite treatment with or without ISRIB co-treatment. EIF4EBP1 antibody reveals both non-phosphorylated and phosphorylated species. (H) Cells were treated as in (A) with addition of 500 nM ISRIB. Histogram of global translation relative to control with standard deviation (n = 3). ∗∗p < 0.01; ∗∗∗p < 0.001 (Two-sided Student’s t test). (I) Overlap of proteins translationally repressed via eIF2α phosphorylation (by thapsigargin) and proteins not showing reversal by co-treatment with ISRIB and NaCl and arsenite. (J) Density plots showing translation fold changes for each protein between stressor alone and co-treatment with ISRIB. Grey lines represent the reference line for equal fold changes. (K) Heatmap and hierarchical clustering summarizing result for all shown treatments (Figures 3 and 4). Datasets were combined, Z scores calculated, and hierarchical clustering performed using Euclidean distance between the samples. Depicted are Z score values for each treatment and replicate (n = 3). Colored circles indicate the 11plex experiment in which the sample was included. I, ISRIB; Ars, arsenite; Tg, thapsigargin. See also Tables S2 and S3 and Figures S4 and S5.
Figure 5
Figure 5
Converging Translatome Regulation by the Integrated Stress Response and mTORC1 (A) Experimental scheme. Cell were treated with thapsigargin or Torin1 for different lengths of time to achieve comparable global translation attenuation. (B) Bar plot showing median global translation levels normalized to the respective control with standard deviation (n = 2). (C) Overlap of proteins with reduced relative translation rates upon Torin1 treatment determined by ribosome profiling data (Thoreen et. al. 2012), or mePROD MS (A). No overlap indicates proteins only showing reduction in ribosome profiling dataset. (D) Volcano plot showing relative translation changes for Torin1 versus control treated cells plotted against p value (n = 2). (E) Venn diagram displaying the overlap of proteins with reduced relative translation (fold change [log2] < −0.5). (F) Heatmap of translation changes for individual treatments and replicates. Data were row-normalized by computing Z scores. See also Table S4.
Figure 6
Figure 6
Reduction of Individual Protein Translation Rates Is Defined by the Extent of Global Translation Attenuation (A) Median relative translation for cells treated with DMSO, 0.25 μM, 1 μM, or 6 μM thapsigargin (Tg) for 2.5 h (left panel) or DMSO, 0.75 μM, or 2 μM Torin1 for 9 h (right panel). (B) Heatmap showing Z scores of relative translation rates for individual proteins across treatments (Z scores were calculated for each experiment). Clustering of samples were performed with Euclidean distance. Relative median translation rates compared to control are plotted on top of the heatmap for each sample. (C) Standardized (Z score) relative translation rates for the subset of proteins showing a decrease in translation correlating with global translation attenuation after titration of treatments. Clustering was performed on data from (B) and values of the most prominent cluster plotted for each treatment. Black lines indicate averaged curves from all displayed proteins. (D) Median relative translation rates of cells treated with indicated concentrations of 4EGI. (E) Heatmap displaying correlation of samples treated with different concentrations of either 4EGI, thapsigargin (Tg) or Torin1. Values represent Euclidean distance between samples. Clustering was performed over Euclidean distance. Apparent clusters are marked in red. (F) Heatmap displaying standardized relative translation values (Z score) for individual proteins following 4EGI treatment. (G) Standardized translation rates (Z score) for all proteins showing linear behavior of translation repression upon 4EGI titration (Figure S6B). See also Figure S6 and Table S5.
Figure 7
Figure 7
Model of Translation Regulation by mTORC1 and the Integrated Stress Response Model illustrating that the integrated stress response and mTORC1 regulate translation of an overlapping set of proteins despite their altering upstream regulation. Translation of individual proteins is largely explained by intrinsic factors with differential sensitivity of global translation inhibition as major determinant.

References

    1. Andreev D.E., O’Connor P.B., Fahey C., Kenny E.M., Terenin I.M., Dmitriev S.E., Cormican P., Morris D.W., Shatsky I.N., Baranov P.V. Translation of 5′ leaders is pervasive in genes resistant to eIF2 repression. eLife. 2015;4:e03971. - PMC - PubMed
    1. Back S.H., Scheuner D., Han J., Song B., Ribick M., Wang J., Gildersleeve R.D., Pennathur S., Kaufman R.J. Translation attenuation through eIF2α phosphorylation prevents oxidative stress and maintains the differentiated state in β cells. Cell Metab. 2009;10:13–26. - PMC - PubMed
    1. Becher I., Andrés-Pons A., Romanov N., Stein F., Schramm M., Baudin F., Helm D., Kurzawa N., Mateus A., Mackmull M.-T. Pervasive Protein Thermal Stability Variation during the Cell Cycle. Cell. 2018;173:1495–1507.e18. - PMC - PubMed
    1. Bevilacqua E., Wang X., Majumder M., Gaccioli F., Yuan C.L., Wang C., Zhu X., Jordan L.E., Scheuner D., Kaufman R.J. eIF2α phosphorylation tips the balance to apoptosis during osmotic stress. J. Biol. Chem. 2010;285:17098–17111. - PMC - PubMed
    1. Chen K., Hu Z., Xia Z., Zhao D., Li W., Tyler J.K. The Overlooked Fact: Fundamental Need for Spike-In Control for Virtually All Genome-Wide Analyses. Mol. Cell. Biol. 2015;36:662–667. - PMC - PubMed

Publication types

MeSH terms

Substances