Comparative Study
. 2020 Mar:211:159-175.
doi: 10.1016/j.ajo.2019.11.008. Epub 2019 Dec 6.

Prospective Cohort Study of Childhood-Onset Stargardt Disease: Fundus Autofluorescence Imaging, Progression, Comparison with Adult-Onset Disease, and Disease Symmetry

Affiliations
Comparative Study

Prospective Cohort Study of Childhood-Onset Stargardt Disease: Fundus Autofluorescence Imaging, Progression, Comparison with Adult-Onset Disease, and Disease Symmetry

Michalis Georgiou et al. Am J Ophthalmol. 2020 Mar.

Abstract

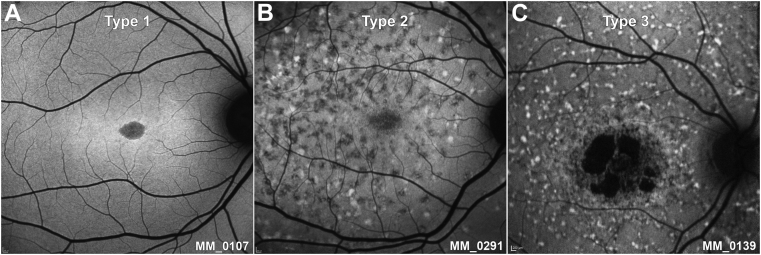
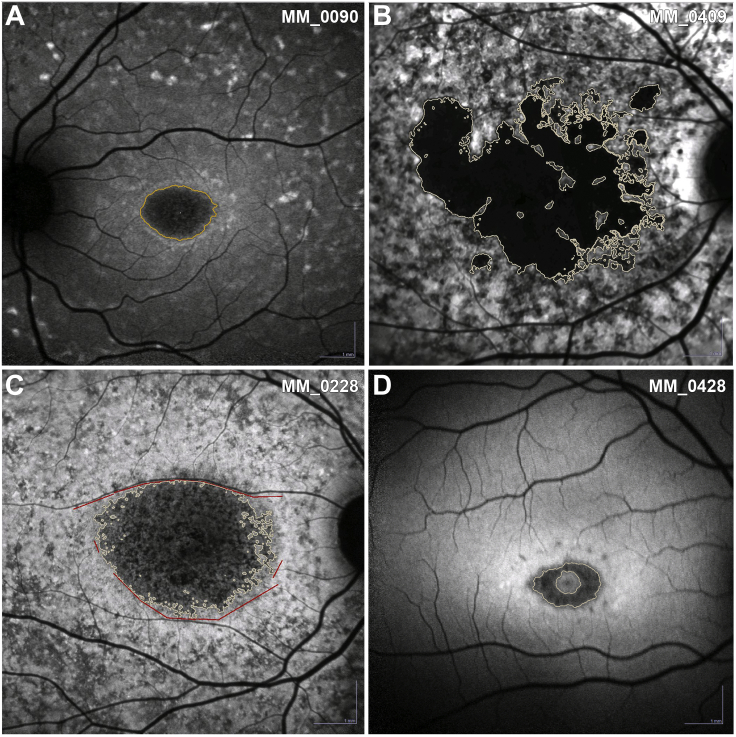
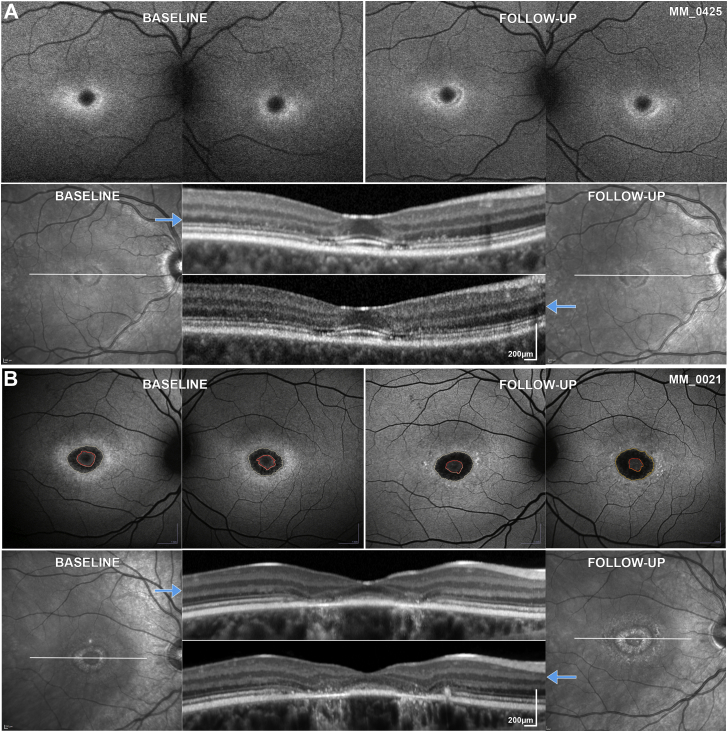
Purpose: To determine the reliability and repeatability of quantitative evaluation of areas of decreased autofluorescence (DAF) from fundus autofluorescence (FAF) images and track disease progression in children with Stargardt disease (STGD1), and to investigate clinical and genotype correlations, disease symmetry, and intrafamilial variability.

Design: Prospective cohort study.

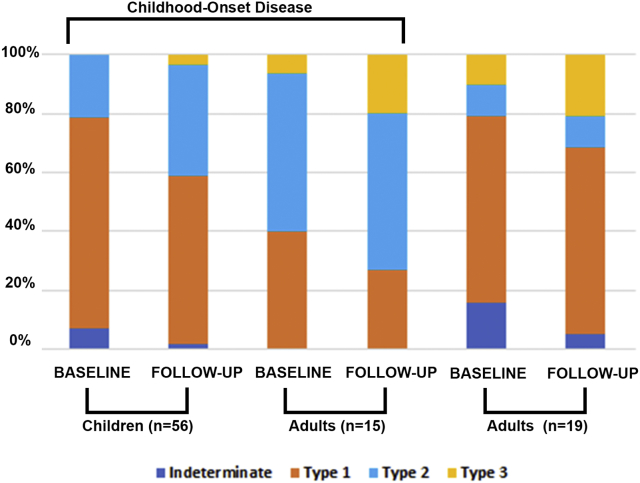
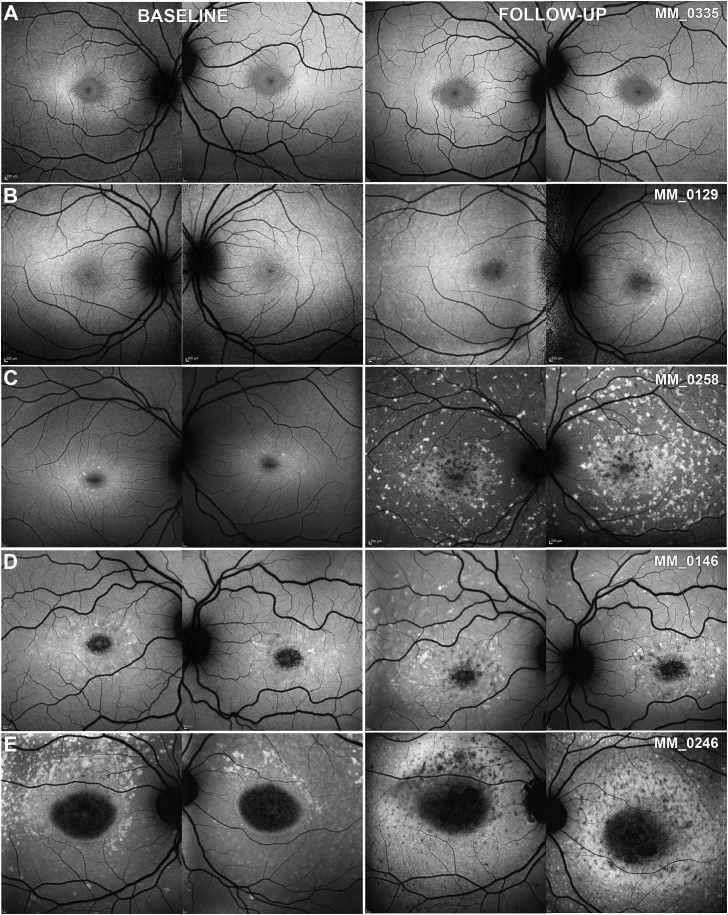
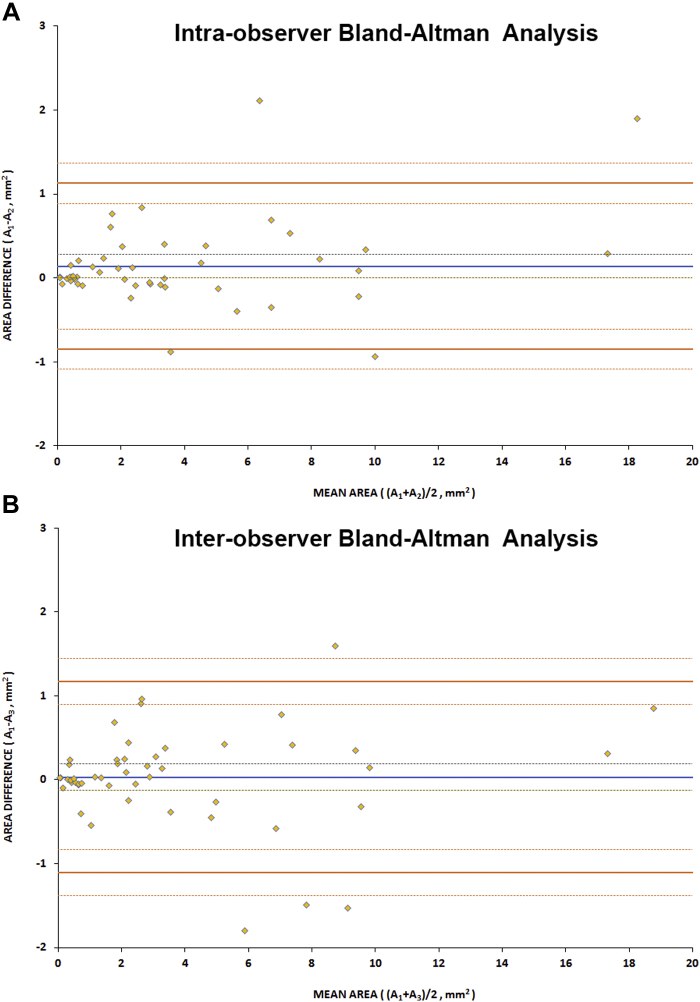
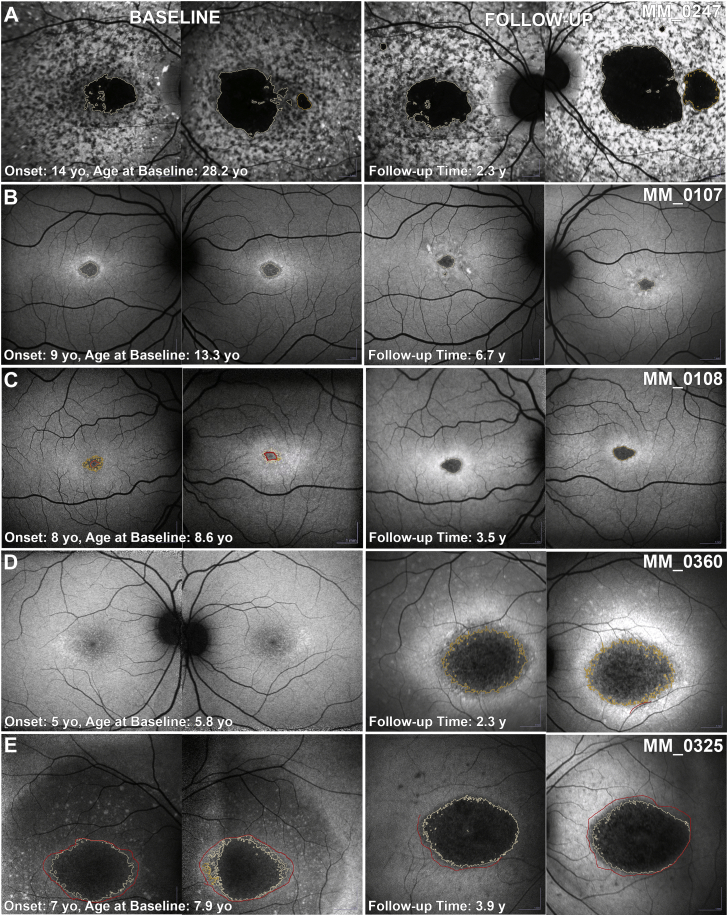
Methods: Children and adults with molecularly confirmed STGD1 (n = 90) underwent longitudinal FAF imaging with subsequent semiautomated measurement of the area of DAF and calculation of the annual rate of progression. The age of disease onset was recorded for all subjects, as well as the electroretinography (ERG) group at baseline (n = 86). Patients were grouped for analysis based on the age at baseline and age of onset, into children (n = 56), adults with childhood-onset STGD1 (n = 15), and adults with adult-onset (n = 19). Fifty FAF images were selected randomly and analyzed by 2 observers to evaluate repeatability and reproducibility. Differences between groups, interocular symmetry, genotype-phenotype correlations, and intrafamilial variability were also investigated both for baseline measurements as well as progression rates. We measured visual acuity, molecular genetics, ERG group, FAF metrics, and their correlations.

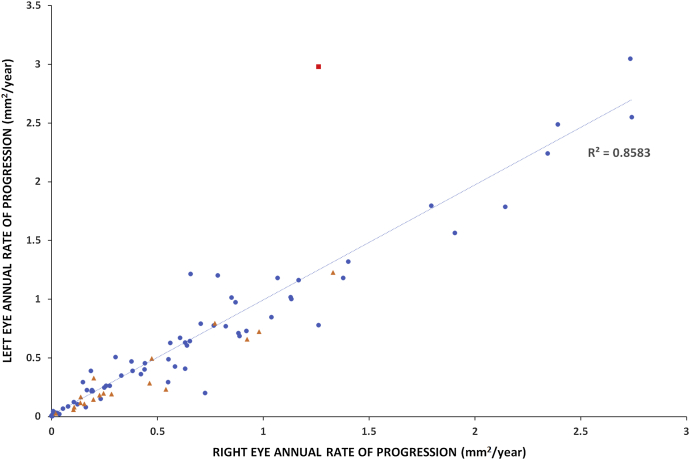
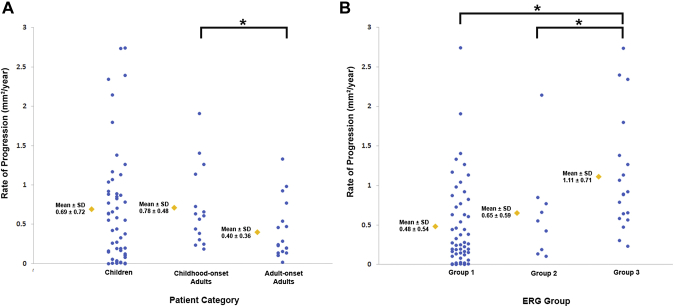
Results: The mean age of onset ± SD was 9.6 ± 3.4 years for childhood-onset (n = 71) and 28.3 ± 7.8 years for adult-onset STGD1 (n = 19). The intra- and interobserver reliability of DAF quantification was excellent (intraclass correlation coefficients 0.995 and 0.987, respectively). DAF area was symmetric between eyes and the mean rate of progression (SD) was 0.69 (0.72), 0.78 (0.48), and 0.40 (0.36) mm2/year for children, adults with childhood-onset, and adults with adult-onset disease, respectively. Patients belonging to a group 3 ERG phenotype (generalized cone and rod dysfunction) had a significantly greater progression rate. Limited intrafamilial variability was observed.

Conclusions: This is the first large prospective study of FAF in a cohort of molecularly confirmed children with STGD1. DAF area quantification was highly reliable and may thereby serve as a robust structural endpoint. A high rate of progression was observed in childhood-onset disease, making this subtype of STGD1 ideally suited to be considered for prioritization in clinical trials.


Figures

Figure 1
Figure 1
Fundus autofluorescence (FAF) types. (A) Type 1, localized low FAF signal at the fovea surrounded by a homogeneous background. (B) Type 2, localized low FAF signal at the macula surrounded by a heterogeneous background, and widespread foci of high or low FAF signal extending anterior to the vascular arcades. (C) Type 3, multiple areas of low FAF signal at the posterior pole with a heterogeneous background, with foci of high and low FAF signal.
Figure 2
Figure 2
Method of decreased autofluorescence (DAF) quantitative analysis. (A) Outlined region of DAF after threshold adjustment. (B) Multifocal lesions, in which the sum of all areas of DAF was calculated. (C) Manual line and freehand constraints were used to distinguish lesion boundaries and to exclude vascular structures. (D) Areas of foveal sparing were delineated with freehand constraints after consulting the infrared images and the ring-shaped DAF was evaluated.
Figure 3
Figure 3
Categorization of fundus autofluorescence (FAF) by type and presentation. Colored bar charts depict the percentage of each type of FAF at baseline and follow-up for all 3 patient groups. There is a trend for childhood-onset disease over time (from baseline to follow-up and from children to adults) of a declining percentage in type 1 and an increasing percentage in type 2 and 3 (suggesting a worsening FAF phenotype over time).
Figure 4
Figure 4
Quantitative analysis of fundus autofluorescence (FAF). FAF images from both eyes of 5 children at baseline and follow-up. All patients have the same FAF type between eyes. (A) Indeterminate FAF at both time points. (B) Progression from indeterminate to type 1. (C) Progression from indeterminate to type 2. (D) Progression from type 1 to type 2. (E) Progression from type 2 to type 3. All images are to scale.
Figure 5
Figure 5
Intrafamilial variability. (A and B) First line: fundus autofluorescence (FAF) images at baseline and follow-up of both eyes. Second line: infrared image of the right eye at baseline and follow-up; the white horizontal lines mark the corresponding location of the optical coherence tomography (OCT) B-scan indicated by the blue arrows. (A) MM_0425 and (B) MM_0021 are siblings with ages of disease onset at 26 and 14 years of age, respectively. The younger sibling (B) was diagnosed earlier. Electroretinography at baseline was within normal limits for the older sister (A) and electroretinography group 1 for the younger brother (B). The patients have a mild genotype, harbouring the missense variants p.Gly1961Glu and p.Ala1598Asp. Both siblings had foveal sparing and the rate of progression was among the lowest in the study (0.08 and 0.21 mm2/year, respectively). Both have perifoveal ellipsoid zone changes on OCT. FAF and OCT images are to scale within modalities. Foveal sparing is clearly visible on the infrared and OCT images. These images were used in outlining the normal decreased autofluorescence of the fovea and exclude the area [red delineated area on (B)] when quantifying the abnormal decreased autofluorescence.
Figure 6
Figure 6
Bland-Altman reliability assessment for quantitative analysis of fundus autofluorescence. The blue line represents the mean difference and the dashed lines represent the upper and lower standard error. The orange lines represent the upper and lower limits of agreement, with the dashed lines around them their upper and lower confidence intervals. (A) Analysis of intraobserver agreement. (B) Analysis of interobserver agreement. Only 6 pairs of measurements are lying outside the limits of agreement. No bias was observed either for intra- or interobserver analysis. A1 = first area measurements for observer 1; A2 = second area measurements for observer 1; A3 = area measurements for observer 2.
Figure 7
Figure 7
Fundus autofluorescence progression. Fundus autofluorescence images from both eyes of 5 patients with childhood-onset disease at baseline and follow-up. Patient (A) had asymmetric disease at baseline and follow-up, and an asymmetric rate of progression. (B-E) All patients have symmetric disease between eyes. (B and C) and (D and E) are siblings and have a similar disease course. Patients (B) and (C) have a minimal rate of progression of 0.01 and 0.06 mm2/year, respectively. Patients (D) and (E) have a rapidly progressive disease, and are homozygous for the p.Gly72Arg variant. All images are to scale. y = years; yo = years old.
Figure 8
Figure 8
Progression symmetry. Scatter plot presenting the rate of progression for each pair of eyes, with line of best fit. The blue dots correspond to childhood-onset patients and the orange triangles to adult-onset patients. The rate of progression was highly variable from 0-3 mm2/year, with almost all patients having symmetric progression. Patient MM_0247 (Figure 7, A) has a different rate of progression among eyes and was an outlier (red square on the graph).
Figure 9
Figure 9
Stacked scatter plots for rate of progression for patient category and electroretinography group. Blue circles represent the progression rate for patients in the corresponding category or group and are displaced horizontally to aid visualization. Yellow diamonds represent the mean value. Asterisks mark statistically significant differences (P < .05). (A) Rate of progression for each group of patients: the rate of progression was highest for adults with childhood-onset disease, followed by children with childhood-onset disease. In all 3 categories the rate was highly variable. (B) Rate of progression for each electroretinography group: the rate of progression was statistically significantly higher for group 3. In all 3 groups the rate was again highly variable.

References

    1. Tanna P., Strauss R.W., Fujinami K., Michaelides M. Stargardt disease: clinical features, molecular genetics, animal models and therapeutic options. Br J Ophthalmol. 2017;101(1):25–30. - PMC - PubMed
    1. Michaelides M., Hunt D.M., Moore A.T. The genetics of inherited macular dystrophies. J Med Genet. 2003;40(9):641–650. - PMC - PubMed
    1. Fujinami K., Lois N., Davidson A.E. A longitudinal study of stargardt disease: clinical and electrophysiologic assessment, progression, and genotype correlations. Am J Ophthalmol. 2013;155(6):1075–1088.e13. - PubMed
    1. Fujinami K., Zernant J., Chana R.K. Clinical and molecular characteristics of childhood-onset Stargardt disease. Ophthalmology. 2015;122(2):326–334. - PMC - PubMed
    1. Strauss R.W., Ho A., Munoz B. The natural history of the progression of atrophy secondary to Stargardt disease (ProgStar) studies: design and baseline characteristics: ProgStar Report No. 1. Ophthalmology. 2016;123(4):817–828. - PubMed

Publication types

MeSH terms

Substances