. 2019 Dec 18;9(6):548-558.e5.
doi: 10.1016/j.cels.2019.10.010. Epub 2019 Dec 4.

Inferring Leading Interactions in the p53/Mdm2/Mdmx Circuit through Live-Cell Imaging and Modeling

Affiliations

Inferring Leading Interactions in the p53/Mdm2/Mdmx Circuit through Live-Cell Imaging and Modeling

Mathias L Heltberg et al. Cell Syst. .

Abstract

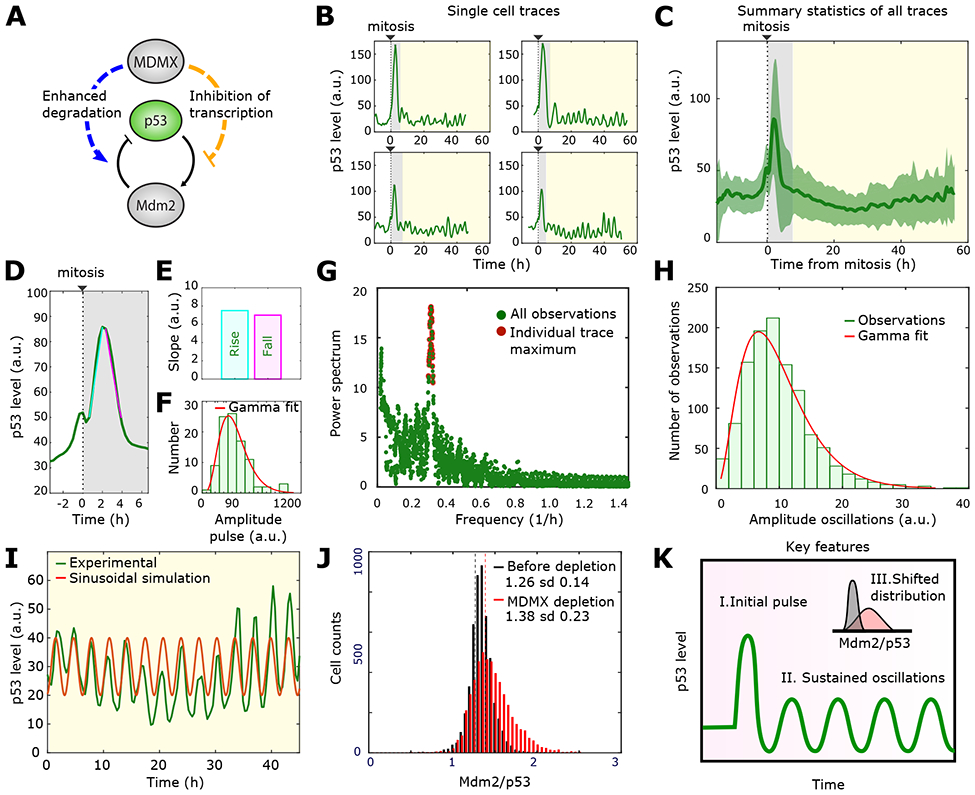
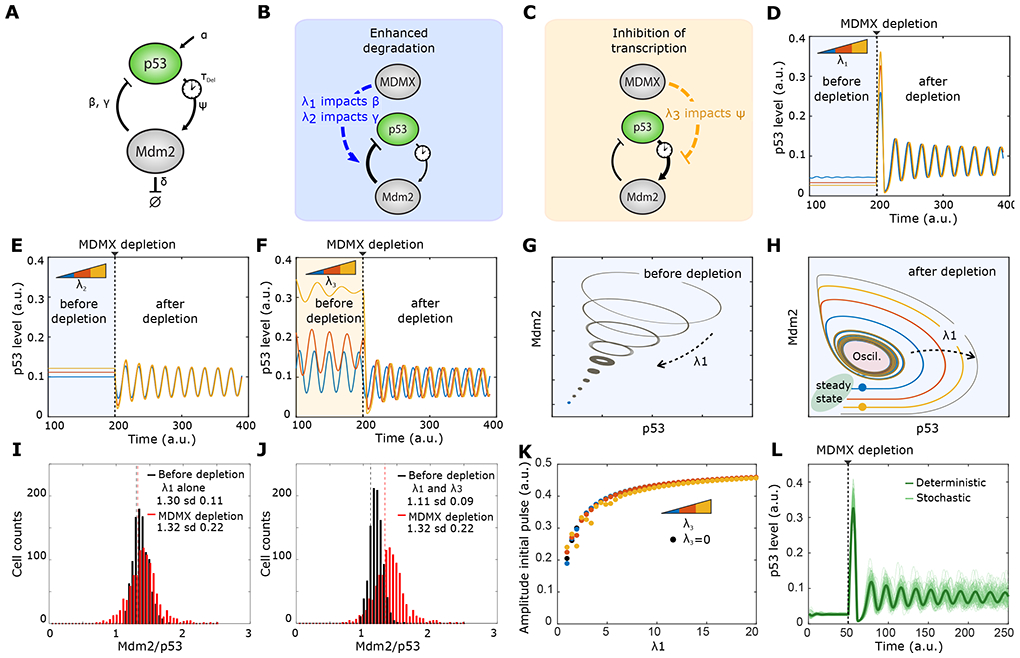
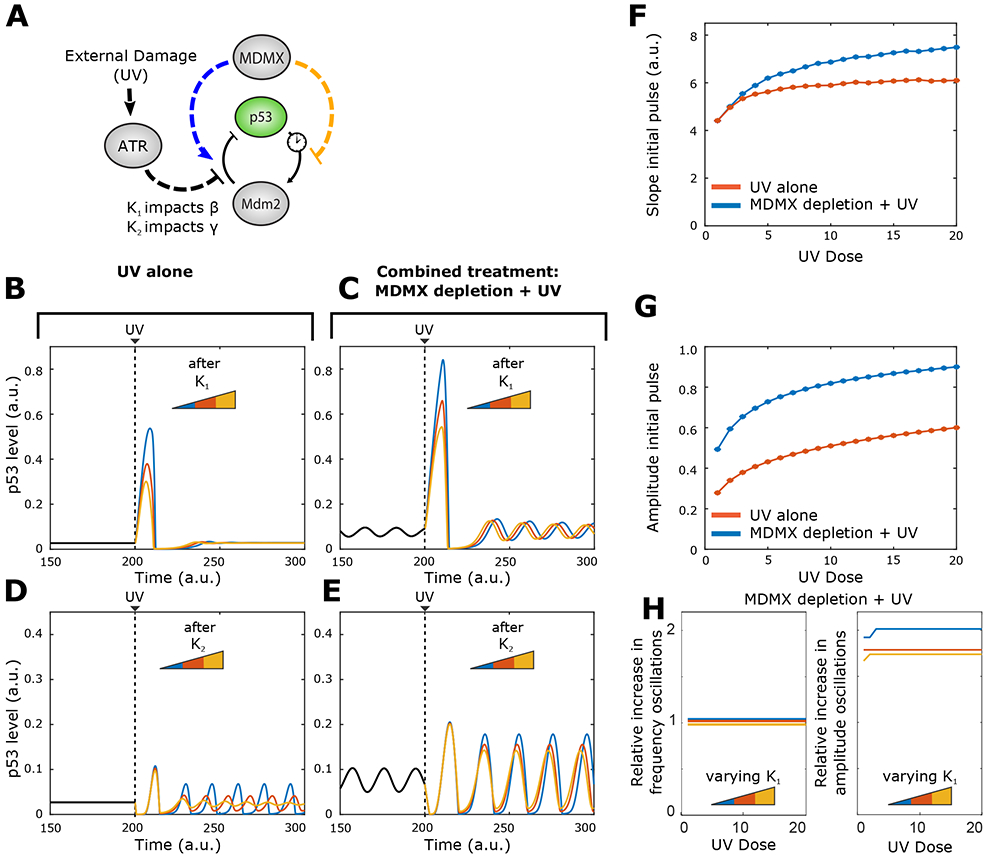
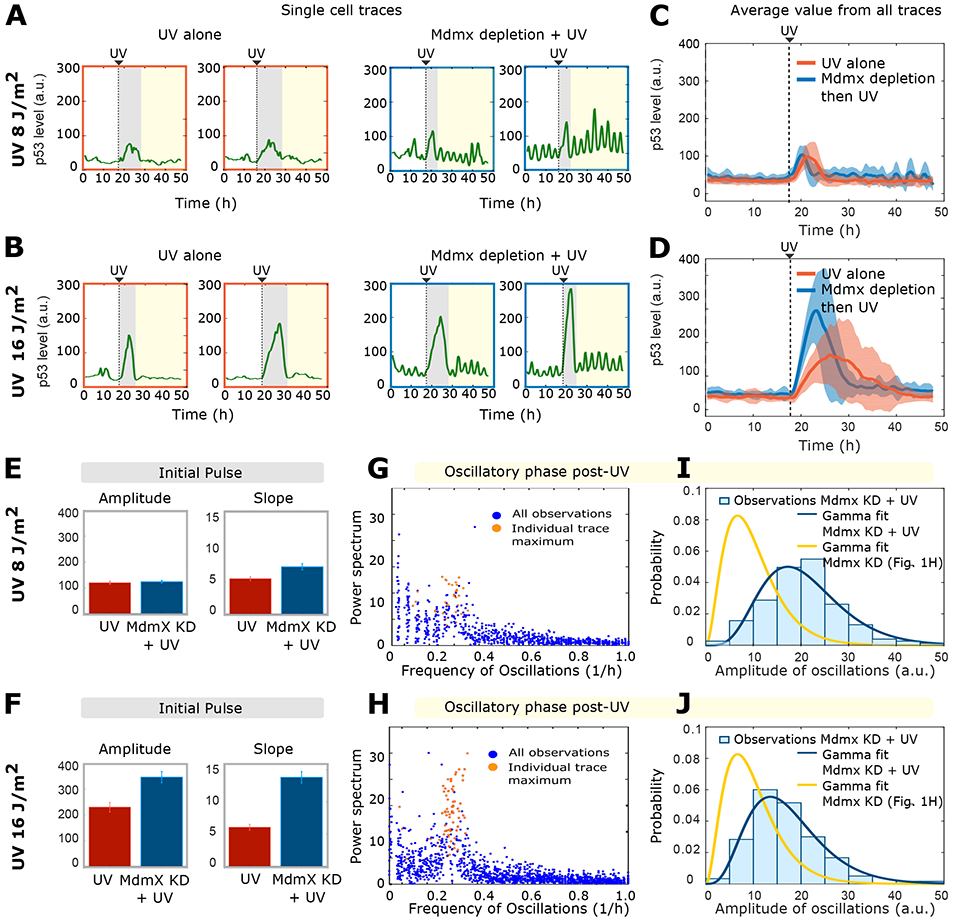
The tumor-suppressive transcription factor p53 is a master regulator of stress responses. In non-stressed conditions, p53 is maintained at low levels by the ubiquitin ligase Mdm2 and its binding partner Mdmx. Mdmx depletion leads to a biphasic p53 response, with an initial post-mitotic pulse followed by oscillations. The mechanism underlying this dynamical behavior is unknown. Two different roles for Mdmx have been proposed: enhancing p53 ubiquitination by Mdm2 and inhibiting p53 activity. Here, we developed a mathematical model of the p53/Mdm2/Mdmx network to investigate which Mdmx functions quantitatively affect specific features of p53 dynamics under various conditions. We found that enhancement of Mdm2 activity was the most critical role of Mdmx under unstressed conditions. The model also accurately predicted p53 dynamics in Mdmx-depleted cells following DNA damage. This work outlines a strategy for rapidly testing possible network interactions to reveal those most impactful in regulating the dynamics of key proteins.

Keywords: ATR; DNA damage; Mdm2; Mdmx; dynamical systems; modeling; oscillations; p53; single cells.


Conflict of interest statement

Declaration of Interest

The authors declare no competing interests.

Figures

Figure 1:
Figure 1:. Quantitative features of p53 dynamics after Mdmx depletion
A) Schematic diagram of the Mdm2-Mdmx -p53 network. Mdmx inhibits the p53-Mdm2 oscillator through two arms: degradation of p53 through catalyzing Mdm2-mediated ubiquitination (blue left arm) and inhibition of p53 transcriptional activity (orange right arm). B) Four representative single-cell time series of p53 dynamics following Mdmx depletion. The grey region indicates the initial pulse and the yellow region highlights the sustained oscillations. C) p53 population dynamics obtained by averaging individual cell traces over time. Green bold line and green shaded areas correspond to mean and standard deviation respectively. Individual p53 traces were aligned based on the time of cell division (n= 96 traces). D) Mean value of the initial peak of p53 expression following Mdmx depletion. Cyan and pink lines were used to calculate the rise and fall slopes of panel E. E) Increasing (Rise) and decreasing (Fall) slopes of the initial p53 pulse shownn in D. F) Histogram showing the distribution of amplitudes of the initial p53 pulse. Fitted gamma distribution in red. G) Fourier spectrum of the sustained oscillations. The red dots mark the highest Fourier signal for each individual cell. H) Histogram showing the distribution of amplitudes of the oscillatory phase. I) Comparison of a single cell oscillatory expression (green) to a modelled sinusoidal oscillation (red) with amplitude and frequency corresponding to the most probable values of the Fourier spectrum in Figure 1G. J) Distribution of the Mdm2/p53 ratio before (black) and after (red) Mdmx depletion based on the immunofluorescent staining of Mdm2 and p53 in single cells. Vertical lines show the corresponding mean values. Sd: standard deviation. K) Characteristic features of p53 dynamics following Mdmx depletion. A large initial pulse (I) is followed by sustained oscillations (II). Mdmx depletion also causes a shift in the Mdm2/p53 ratio (III).
Figure 2:
Figure 2:. Impact factors identify modulation of β as primary function of Mdmx.
A) Schematics of the p53-Mdm2 negative feedback loop with the parameters (β, γ, Ψ, TDel) in our mathematical model. B) Possible mechanisms for Mdmx-enhanced p53 degradation through enhancing Mdm2-mediated p53 poly-ubiquitination. C) Possible mechanism of Mdmx-mediated inhibition of p53 transcriptional activity through competitive binding. D) Predicted p53 dynamics before and after Mdmx depletion at three different values of impact factor λ1., affecting parameter β. λ1 values for blue, red and yellow curves are, respectively,1, 2, 3. E) Predicted p53 dynamics before and after Mdmx depletion at three different values of impact factor λ2 on parameter Ψ. λ2 values for blue, red and yellow curves are, respectively, 2, 4, 6. F) Predicted p53 dynamics before and after Mdmx depletion at three different values of impact factor λ3 affecting parameter γ. λ3 values for blue, red and yellow curves are, respectively, 0.25, 0.5, 0.75. G) Evolution of p53-Mdm2 behavior prior to Mdmx depletion in phase space with increasing λ1. Increase in λ1 drives the limit cycle towards a fixed point. H) Evolution of p53-Mdm2 behavior following Mdmx depletion in phase space when λ1 increases. Increase in λ1 enhances the amplitude of the initial pulse. I) Simulations of the distribution of Mdm2/p53 before (black) and after (red) Mdmx depletion, taking into account λ1 alone (λ1 =3; λ3 =0). Sd: standard deviation. J) Simulations of the distribution of Mdm2/p53 before (black) and after (red) Mdmx depletion, taking into account both λ1 and λ31 =3; λ3=0.15). K) Predicted amplitude of the initial pulse for distinct combinations of λ1 and λ3. λ3 values for black, blue, red and yellow dots respectively: (0; 0.25; 0.5; 0.75). L) 100 simulations of p53 dynamics with Langevin noise before and after Mdmx depletion. λ1 = 3, λ2 = 0, λ3 = 0.15. The green line represents the deterministic trajectory.
Figure 3:
Figure 3:. UV irradiation combined with Mdmx depletion is predicted to increase the amplitude of both the initial p53 pulse and subsequent oscillations.
A) Schematic of the p53-Mdm2 system with regulation by Mdmx and ATR. ATR can inhibit Mdm2-mediated p53 degradation through two impact factors (κ2 or κ2) B, C) p53 dynamics in (B) control and (C) Mdmx-depleted cells before and after UV-irradiation at three different values of κ1. κ1 values for blue, red and yellow curves are, respectively, 1, 2, 3. D, E) p53 dynamics in (D) control and (E) Mdmx-depleted cells before and after UV-irradiation at three different values of κ2. κ2 values for blue, red and yellow curves are, respectively, 0.01; 0.04; 0.09. F) Predicted slope of the increasing phase of the p53 initial pulse with increasing UV dose in control or Mdmx-depleted cells subjected to UV irradiation. κ1 fixed at 1. G) Predicted amplitude of the p53 initial pulse with increasing UV dose in control or Mdmx-depleted cells subjected to UV irradiation. κ1 fixed at 1. H) Predicted amplitude of the p53 sustained oscillations after the initial pulse for different levels of of κ1. κ1 values for blue, red and yellow curves are, respectively, 1, 2, 3.
Figure 4:
Figure 4:. Mdm2-dependent degradation of p53 is the primary interaction regulating p53 dynamics following DNA damage.
A-B) Four representative single-cell p53 traces are colored according to the different phases of their dynamic behavior: before treatment (white region), initial response (grey region) and long-term response (yellow region). Dynamics were measured following UV-radiation (8 and 16 J/m2 respectively). Right-most panels show prior Mdmx depletion. C-D) Mean p53 dynamics trajectories (bold lines) ± std deviation (shaded areas) before and after UV irradiation (8 and 16 J/m2 respectively) in scrambled siRNA-treated (control, red) or Mdmx-depleted (blue) cells. n= 30 selected traces per experiment. E-F) Slope and amplitude of the p53 initial pulse after treatment of scrambled siRNA-treated (control, red) or Mdmx-depleted (blue) cells with 8 J/m2 (E) or 16 J/m2 (F) UV radiation. G-H) Fourier spectrum of the sustained oscillatory phase after treatment of scrambled siRNA-treated (control, red) or Mdmx-depleted (blue) cells with 8 J/m2 (G) or 16 J/m2 (H) UV radiation. I-J) Distribution of amplitudes of the p53 oscillations in Mdmx-depleted cells subjected (blue) or not (yellow) to 8 J/m2 (I) or 16 J/m2 (J) UV radiation. Curves for unirradiated cells in yellow are identical to Figure 1H.

Similar articles

Cited by

References

    1. Batchelor E, Mock CS, Bhan I, Loewer A, and Lahav G (2008). Recurrent Initiation: A Mechanism for Triggering p53 Pulses in Response to DNA Damage. Mol. Cell 30, 277–289. - PMC - PubMed
    1. Batchelor E, Loewer A, Mock C, and Lahav G (2011). Stimulus-dependent dynamics of p53 in single cells. Mol. Syst. Biol 7, 1–8. - PMC - PubMed
    1. Chen S, Forrester W, and Lahav G (2016). Schedule-dependent interaction between anticancer treatments. Science (80-. ). 351, 1204–1209. - PMC - PubMed
    1. Geva-Zatorsky N, Rosenfeld N, Itzkovitz S, Milo R, Sigal A, Dekel E, Yarnitzky T, Liron Y, Polak P, Lahav G, et al. (2006). Oscillations and variability in the p53 system. Mol. Syst. Biol 2, 1–13. - PMC - PubMed
    1. Lahav G, Rosenfeld N, Sigal A, Geva-Zatorsky N, Levine AJ, Elowitz MB, and Alon U (2004). Dynamics of the p53-Mdm2 feedback loop in individual cells. Nat. Genet 36, 147–150. - PubMed

Publication types

MeSH terms