

Identification of a hormone response element that mediates suppression of APOF by LXR and PPARα agonists
- PMID: 31812787
- PMCID: PMC6957717
- DOI: 10.1016/j.bbalip.2019.158583
Identification of a hormone response element that mediates suppression of APOF by LXR and PPARα agonists
Abstract
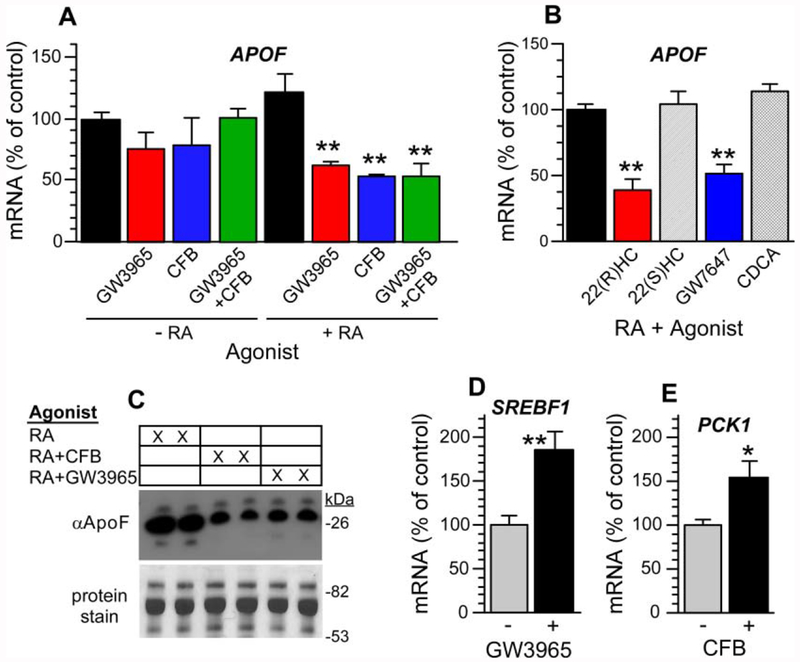
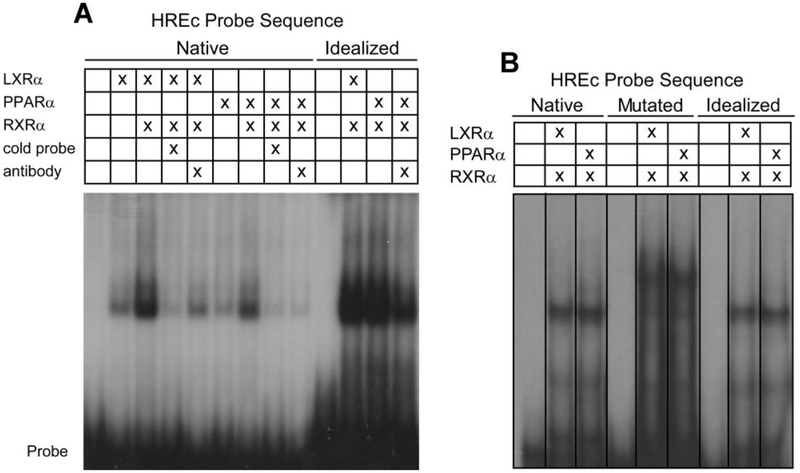
Apolipoprotein F (ApoF) regulates cholesteryl ester transfer protein activity. We previously observed that hepatic APOF mRNA levels are decreased by high fat, cholesterol-enriched diets. Here we show in human liver C3A cells that APOF mRNA levels are reduced by agonists of LXR and PPARα nuclear receptors. This negative regulation requires co-incubation with the RXR agonist, retinoic acid. Bioinformatic analysis of the ~2 kb sequence upstream of the APOF promoter identified one potential LXR and 4 potential PPARα binding sites clustered between nucleotides -2007 and -1961. ChIP analysis confirmed agonist-dependent binding of LXRα, PPARα, and RXRα to this hormone response element complex (HREc). A luciferase reporter containing the 2 kb 5' APOF sequence was negatively regulated by LXR and PPARα ligands as seen in cells. This regulation was maintained in constructs lacking the ~1700 nucleotides between the HREc and the APOF proximal promoter. Mutations of the HREc that disrupted LXRα and PPARα binding led to the loss of reporter construct inhibition by agonists of these nuclear receptors. siRNA knockdown studies showed that APOF gene regulation by LXRα or PPARα agonists did not require an interaction between these two nuclear receptors. Thus, APOF is subject to negative regulation by agonist-activated LXR or PPARα nuclear receptors binding to a regulatory element ~1900 bases 5' to the APOF promoter. High fat, cholesterol-enriched diets likely reduce APOF gene expression via these receptors interacting at this regulatory site.
Keywords: Apolipoprotein F; Apolipoproteins; Cholesteryl ester transfer protein; Gene expression; Nuclear receptors/lipid ligands; Transcription.
Copyright © 2019 Elsevier B.V. All rights reserved.
Figures


Similar articles
-
Apolipoprotein F: a natural inhibitor of cholesteryl ester transfer protein and a key regulator of lipoprotein metabolism.Curr Opin Lipidol. 2020 Aug;31(4):194-199. doi: 10.1097/MOL.0000000000000688. Curr Opin Lipidol. 2020. PMID: 32520778 Free PMC article. Review.
-
The atypical interaction of peroxisome proliferator-activated receptor alpha with liver X receptor alpha antagonizes the stimulatory effect of their respective ligands on the murine cholesterol 7alpha-hydroxylase gene promoter.Biochim Biophys Acta. 2002 Jul 11;1583(2):229-36. doi: 10.1016/s1388-1981(02)00217-2. Biochim Biophys Acta. 2002. PMID: 12117567
-
Transcriptional regulation of the apolipoprotein F (ApoF) gene by ETS and C/EBPα in hepatoma cells.Biochimie. 2015 May;112:1-9. doi: 10.1016/j.biochi.2015.02.013. Epub 2015 Feb 26. Biochimie. 2015. PMID: 25726912
-
Pitavastatin increases ABCA1 expression by dual mechanisms: SREBP2-driven transcriptional activation and PPARα-dependent protein stabilization but without activating LXR in rat hepatoma McARH7777 cells.J Pharmacol Sci. 2011;116(1):107-15. doi: 10.1254/jphs.10241fp. Epub 2011 Apr 27. J Pharmacol Sci. 2011. PMID: 21521932
-
Identification of liver X receptor-retinoid X receptor as an activator of the sterol regulatory element-binding protein 1c gene promoter.Mol Cell Biol. 2001 May;21(9):2991-3000. doi: 10.1128/MCB.21.9.2991-3000.2001. Mol Cell Biol. 2001. PMID: 11287605 Free PMC article.
Cited by
-
Both full length-cholesteryl ester transfer protein and exon 9-deleted cholesteryl ester transfer protein promote triacylglycerol storage in cultured hepatocytes.Lipids. 2022 Jan;57(1):69-79. doi: 10.1002/lipd.12330. Epub 2021 Dec 5. Lipids. 2022. PMID: 34866179 Free PMC article.
-
Apolipoprotein F: a natural inhibitor of cholesteryl ester transfer protein and a key regulator of lipoprotein metabolism.Curr Opin Lipidol. 2020 Aug;31(4):194-199. doi: 10.1097/MOL.0000000000000688. Curr Opin Lipidol. 2020. PMID: 32520778 Free PMC article. Review.
-
Unlocking therapeutic potential: exploring cross-talk among emerging nuclear receptors to combat metabolic dysfunction in steatotic liver disease.NPJ Metab Health Dis. 2024 Jul 3;2(1):13. doi: 10.1038/s44324-024-00013-6. NPJ Metab Health Dis. 2024. PMID: 40603501 Free PMC article. Review.
-
The Roles of Fatty Acids and Apolipoproteins in the Kidneys.Metabolites. 2022 May 20;12(5):462. doi: 10.3390/metabo12050462. Metabolites. 2022. PMID: 35629966 Free PMC article. Review.
-
The Role of Nuclear Receptors in the Pathogenesis and Treatment of Non-alcoholic Fatty Liver Disease.Int J Biol Sci. 2024 Jan 1;20(1):113-126. doi: 10.7150/ijbs.87305. eCollection 2024. Int J Biol Sci. 2024. PMID: 38164174 Free PMC article. Review.
References
-
- Morton RE, Zilversmit DB, Inter-relationship of lipids transferred by the lipid-transfer protein isolated from human lipoprotein-deficient plasma, J. Biol. Chem, 258 (1983) 11751–11757. - PubMed
-
- Tall A, Plasma lipid transfer proteins, Annu. Rev. Biochem, 64 (1995) 235–257. - PubMed
-
- Morton RE, Cholesteryl ester transfer protein and its plasma regulator: lipid transfer inhibitor protein, Curr. Opin. Lipidol, 10 (1999) 321–327. - PubMed
-
- Barter PJ, Nicholls SJ, Kastelein J, P. J, Rye KA, CETP inhibition as a strategy to reduce cardiovascular risk: The pro case, Circulation, 132 (2015) 423–432. - PubMed
-
- Hovingh GK, Ray KK, Boekholdt SM, CETP as a target to lower CVD risk: Suspension of disbelief?, Circulation, 132 (2015) 433–440. - PubMed
Publication types
MeSH terms
Substances
Grants and funding
LinkOut - more resources
Full Text Sources
Miscellaneous
