. 2019 Dec 8;11(23):11541-11564.
doi: 10.18632/aging.102553. Epub 2019 Dec 8.

The local translation of KNa in dendritic projections of auditory neurons and the roles of KNa in the transition from hidden to overt hearing loss

Affiliations

The local translation of KNa in dendritic projections of auditory neurons and the roles of KNa in the transition from hidden to overt hearing loss

Jeong Han Lee et al. Aging (Albany NY). .

Abstract

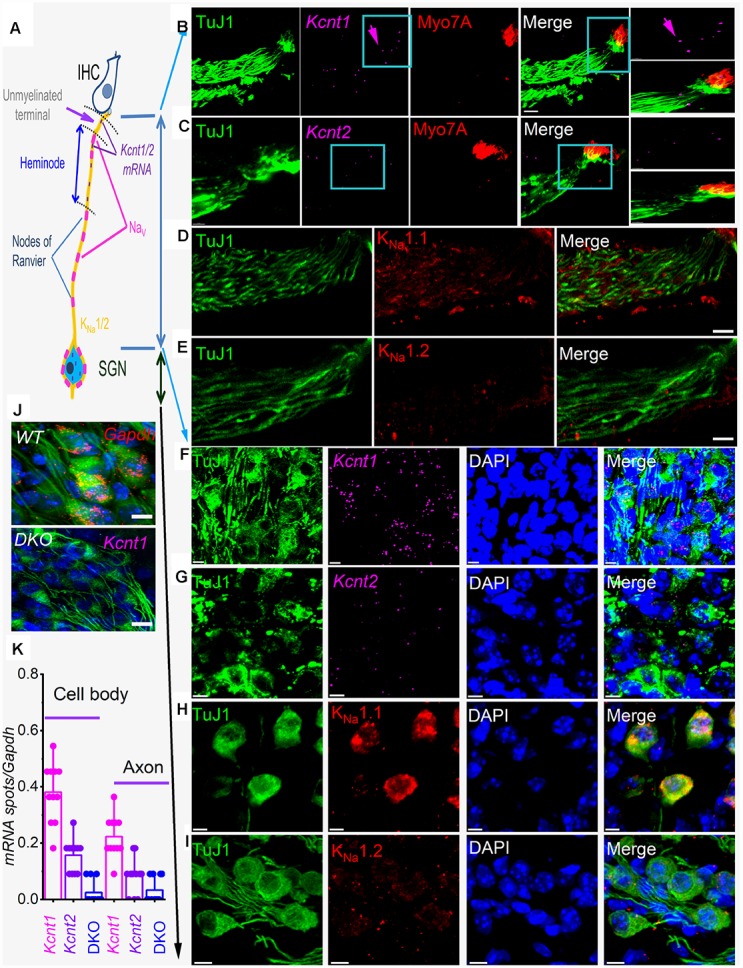
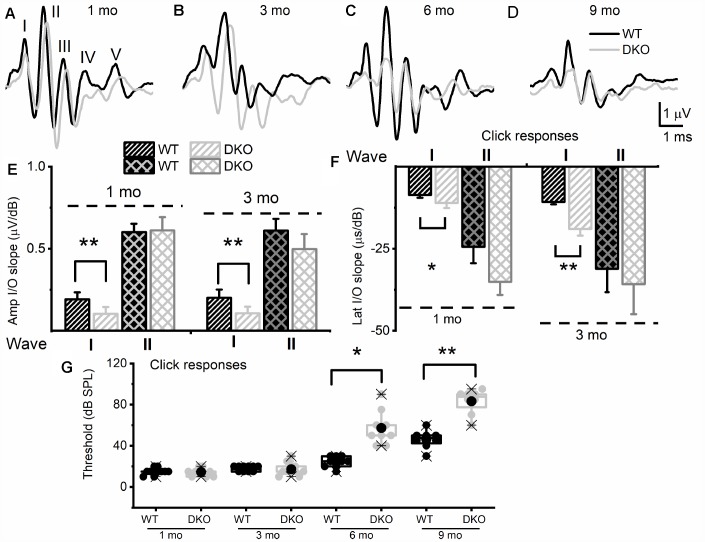
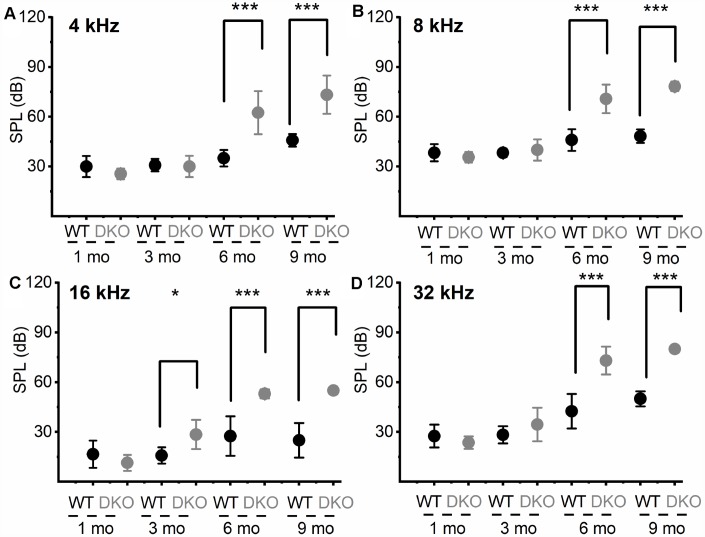
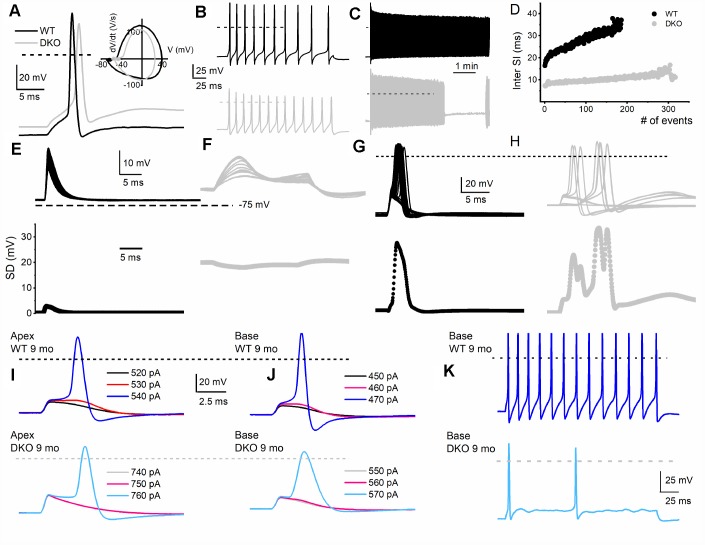
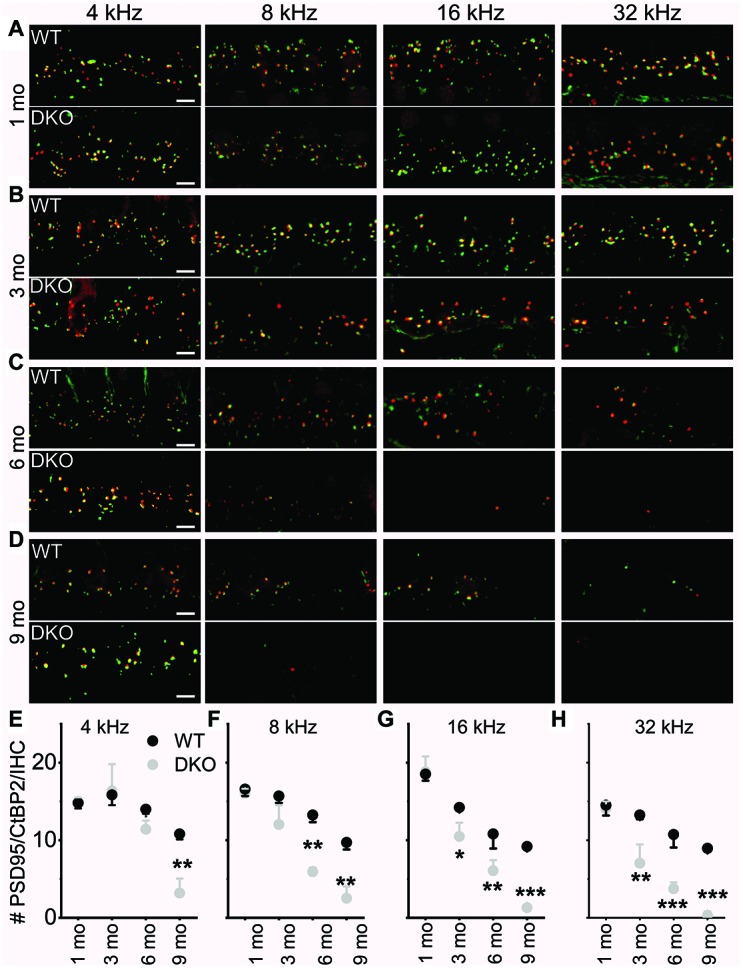
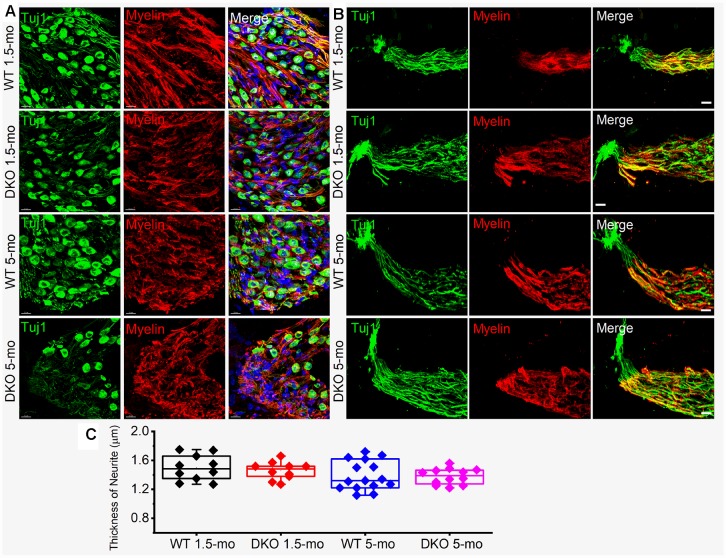
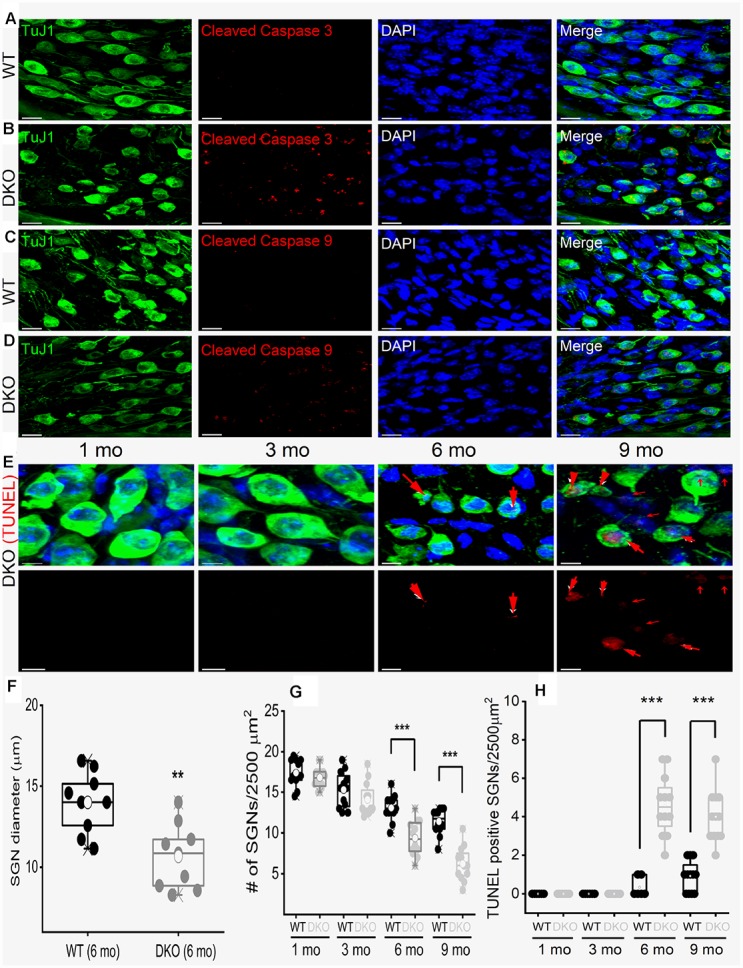
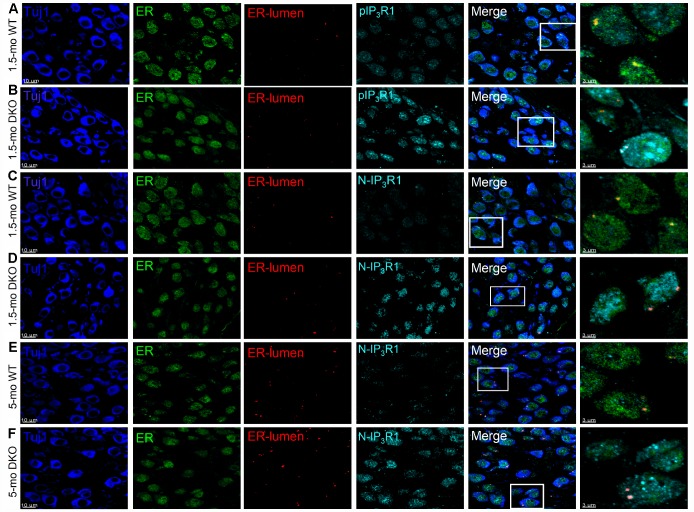
Local and privileged expression of dendritic proteins allows segregation of distinct functions in a single neuron but may represent one of the underlying mechanisms for early and insidious presentation of sensory neuropathy. Tangible characteristics of early hearing loss (HL) are defined in correlation with nascent hidden hearing loss (HHL) in humans and animal models. Despite the plethora of causes of HL, only two prevailing mechanisms for HHL have been identified, and in both cases, common structural deficits are implicated in inner hair cell synapses, and demyelination of the auditory nerve (AN). We uncovered that Na+-activated K+ (KNa) mRNA and channel proteins are distinctly and locally expressed in dendritic projections of primary ANs and genetic deletion of KNa channels (Kcnt1 and Kcnt2) results in the loss of proper AN synaptic function, characterized as HHL, without structural synaptic alterations. We further demonstrate that the local functional synaptic alterations transition from HHL to increased hearing-threshold, which entails changes in global Ca2+ homeostasis, activation of caspases 3/9, impaired regulation of inositol triphosphate receptor 1 (IP3R1), and apoptosis-mediated neurodegeneration. Thus, the present study demonstrates how local synaptic dysfunction results in an apparent latent pathological phenotype (HHL) and, if undetected, can lead to overt HL. It also highlights, for the first time, that HHL can precede structural synaptic dysfunction and AN demyelination. The stepwise cellular mechanisms from HHL to canonical HL are revealed, providing a platform for intervention to prevent lasting and irreversible age-related hearing loss (ARHL).

Keywords: age-related hearing loss; auditory neurons; axonal protein translation; hearing loss; potassium channels.


Conflict of interest statement

CONFLICTS OF INTEREST: The authors have no conflicts of interests to declare.

Figures

Figure 1
Figure 1
sm-FISH and immunocytochemistry localize transcripts and proteins for KNa1.1 and KNa1.2 in axons and cell bodies of spiral ganglion neurons (SGNs). Expression of KNa1-encoding transcripts in the SGNs was examined using smFISH and standard immunocytochemistry in the organ of Corti (OC)/SGN preparations from 1-mo old C57 mice (BI). (A) Schematic illustration of the inner hair cell (IHC), type I SGN, the peripheral axon, and cell body. The unmyelinated terminal, heminode, and nodes of Ranvier are noted, but not to scale. (B) RNA molecules encoding for KNa1.1 (Kcnt1), and (C) KNa1.2 (Kcnt2), were detected as fluorescent spots (purple, arrow) in TUJ1-positive (green) SGN axons, IHCs were labeled with myosin 7A antibody (red), and merged images are shown. Axonal Kcnt1 mRNA were prominent, but only scant Kcnt2 mRNA spots were detected compared to the double knockout (DKO) samples (J). Scale bar = 10 μm (DE) Images of cochlear sections of 1-mo old mice show that KNa1.1 (red) protein is expressed in the auditory nerve in D. Consistent with the faint expression of Kcnt2 mRNA in the axons in (E) there was virtually little or no detectable expression of KNa1.2 in axons of the auditory nerve. Scale bar = 10 μm. (FG) mRNA spots (purple spots) encoding KNa1.1 (Kcnt1), and KNa1.2 (Kcnt2) in the cell bodies of SGNs. Very few spots for Kcnt2 mRNA were detected. Sections were co-labeled with neuronal (TuJ1, green) and nuclei markers (4,6-diamidino-2-phenylindole, DAPI, blue) Scale bar = 5 μm. (HI) Images of the SGNs show KNa1.1 (red) protein is expressed in cell bodies of the auditory nerve. In keeping with low levels of expression of mRNA, KNa1.2 protein expression was faintly positive. The mean number of RNA molecules detected per SGN was calculated as described in the Methods. Kcnt1 levels were higher compared to Kcnt2 in both mRNA and protein levels. (J) (Upper panel). Photomicrograph showing SGN mRNA spots (red spots) encoding Gapdh (data was obtained from DKO tissue). (Lower panel) DKO cochlear section, using kcnt1 probe serving as negative controls. Similar data were obtained using the kcnt2 probe (data not shown). Scale bar = 5 μm. (K) Values of mRNA spots in axons and cell bodies were normalized against Gapdh mRNA spots/100 μm2 (11 ± 2 spots (n = 31)) are summarized in the form of bar graphs. The mean (mean ± SD) was (cell body, kcnt1 = 0.38 ±.0.11; kcnt2 = 0.16 ± 0.06; DKO = 0.02 ± 0.04; n = 11 animals; derived from 50 randomly selected cells and evaluated by 5 blinded individuals. The mean (mean ± SD) was (axons, kcnt1 = 0.22 ±.0.07; kcnt2 = 0.08 ± 0.06; DKO = 0.03 ± 0.05; n = 11 animals; derived from 50 randomly selected cells and evaluated by 5 blinded individuals.
Figure 2
Figure 2
KNa1 DKO mice have reduced and delayed wave I auditory brainstem responses (ABR) but normal absolute thresholds from ages 1 to 3-mo-old in comparison with WT animals, and by 6-mo-old, showed a profound increase in absolute thresholds, relative to the WTs. ABRs were measured in 1-, 3-, 6- and 9-mo old WT and DKO mice. (AD) Representative ABR traces in response to 80 dB SPL sound clicks are shown for WT (black) and DKO (light grey), at ages 1-, 3-, 6- and 9-mo old as indicated. (E) Average waves I and II amplitudes (input/output, I/O) linear regression slope functions were determined for responses to sound clicks. Wave I, but not wave II, amplitudes were significantly reduced in DKO mice compared to WT mice in response to click sound in 1-mo old. In 3-mo old wave II was significantly different. The mean values for 1-mo old mice for wave I (I/O slope (μV/dB); mean ± SD) were; WT = 0.19 ±.0.04; DKO = 0.10 ± 0.04; n = 11; p < 0.0001. Mean wave II values were; WT = 0.60 ±.0.05; DKO = 0.61 ± 0.08; n = 11; p = 0.7. The mean values for 3-mo-old mice for wave I (I/O slope (μV/dB); mean ± SD) were; WT = 0.20 ±.0.05; DKO = 0.11 ± 0.04; n = 11; p < 0.0001. Mean wave II values were; WT = 0.61 ±.0.07; DKO = 0.50 ± 0.09; n = 11; p = 0.004. (F) Average waves I and II latency (input/output, I/O) functions versus sound clicks. Wave I latency I/O linear regression slopes were significantly different between WT and DKO mice. The mean values for 1-mo old mice for wave I latency (I/O slope (μs/dB); mean ± SD) were; WT = 8.60 ±.0.82; DKO = 11.05 ± 1.57; n = 11; p < 0.0002. Mean wave II values were; WT = 24.40 ±.5.01; DKO = 35.09 ± 4.02; n = 11; p = 0.0001. The mean values for 3-mo old mice for wave I (I/O slope (μV/dB); mean ± SD) were; WT = 10.73 ±.0.73; DKO = 18.93 ± 2.02; n = 11; p < 0.0001. Mean wave II values were; WT = 31.09 ±. 7.11; DKO = 35.80 ± 9.12; n = 11; p = 0.192. Additionally, the I/O slope (μV/dB) of wave I amplitude at 6-mos and 9-mos were; WT = 0.16 ± 0.05; DKO = 0.08 ± 0.06; n = 10; p = 0.005 and (9-mos); WT = 0.14 ± 0.08; DKO = 0.05 ± 0.02; n = 10; p = 0.04. The I/O slope (μs/dB) of wave I latency at 6-mos and 9-mos were; WT = 12.37 ± 0.91; DKO = 20.81 ± 3.11; n = 10; p < 0.0001 and (9-mos); WT = 13.21 ± 1.06; DKO = 22.63 ± 4.11; n = 10; p < 0.0001. (G) Mean absolute ABR thresholds in response to click stimulus were not statistically significantly different between WT and DKO mice in 1-3 mo old but were significantly different in 6- and 9-mo old mice. The mean values for ABR thresholds for 6-mo old were (dB SPL); WT = 24.44 ± 5.27; DKO = 57.22 ± 16.41; n = 9; p = 0.0002. Mean thresholds for or 9-mo old were; WT 46.25 ± 8.76; DKO = 83.13 ± 11.93; n = 8; p < 0.0001.
Figure 3
Figure 3
Changes in pure tone responses. (AD) Mean absolute ABR thresholds in response to pure tones (4, 8, 16 and 32 kHz) were not statistically significantly different between WT and DKO mice in 1- and 3-mo old, but were significantly different in 6- and 9-mo old mice. Summary data are expressed as (mean ± SD), and statistical comparisons are shown. For 4 KHz, the mean thresholds (in dB SPL) at 6 mos were; WT = 35.00 ± 5.00; DKO = 62.50 ± 12.94; n = 8; p = 0.0001. Mean thresholds at 9 mos were; WT = 45.83 ± 3.76; DKO = 73.33 ± 11.55; n = 8; p = 0.0001. For 8 KHz, the mean thresholds (in dB SPL) at 6 mos were; WT = 46.00 ± 6.52; DKO = 70.83 ± 8.60; n = 8; p = 0.0001. Mean thresholds at 9 mos were; WT = 48.30 ± 4.10; DKO = 78.30 ± 2.89; n = 8; p = 0.0001. For 16 KHz, the mean thresholds (in dB SPL) at 3 mos were; WT = 15.83 ± 4.91; DKO = 28.50 ± 8.83; n = 8; p = 0.0032. Mean thresholds at 6 mos were; WT = 27.50 ± 11.90; DKO = 53.00 ± 2.74; n = 8; p = 0.0001. Mean thresholds at 9 mos were; WT = 25.00 ± 10.49; DKO = 55.00 ± 0.00; n = 8; p = 0.0001. For 32 KHz, the mean thresholds (in dB SPL) at 6 mos were; WT = 42.50 ± 10.40; DKO = 73.84 ± 8.37; n = 8; p = 0.0001. Mean thresholds at 9 mos were; WT = 50.00 ± 4.47; DKO = 80.00 ± 0.00; n = 8; p = 0.0001.
Figure 4
Figure 4
Membrane properties of SGNs from WT and DKO mice. To minimize experimental variabilities, SGN recordings were performed using mice, with recorded ABR. Current-clamp recordings were performed on SGNs isolated from the basal and apical one-third of the cochlea from 1-, 3-, 4-5- (not shown), 6- and 9-mo old WT and DKO mice. (A) Action potentials (AP) evoked from 1-mo-old SGNs isolated from cochlear apical turn from WT (black trace) and DKO (grey trace) mice. Both the resting membrane potential (RMP) and AP amplitude were significantly altered in WT versus DKO SGNs. RMP of apical SGNs; WT, -65 ± 3 mV, n = 31; DKO, -58 ± 2 mV, n = 27; p < 0.001: RMP of basal SGNs; WT, -57 ± 2 mV, n = 25; DKO, -53 ± 4 mV, n = 31; p < 0.001). AP amplitudes were; apical SGN; WT, 80.0 ± 2.7 mV, n = 15; DKO, 72.1 ± 4.8 mV, n = 15; p < 0.001: basal SGN; WT, 83.2 ± 3.4 mV, n = 17; DKO, 72.0 ± 5.1 mV, n = 19; p < 0.001). Dotted black and gray lines indicate 0 mV. (B, C) Examples of slow adapting SGNs isolated from a 1-mo-old basal cochlear turn. For the example shown in (B) typical spike frequency (in Hz) for WT SGNs = 45 ± 7 (n = 17) and DKO = 67 ± 11 (n = 21); p < 0.0001. (D) The dairy plot of the inter-spike interval of slow adapting SGNs from WT and DKO. (E, F) 50 consecutive subthreshold depolarization (0.075 nA current injection) of WT SGNs (E, black traces), and DKO (F, grey traces), demonstrating the extent of membrane jitters. Plotted below is the corresponding standard deviation. (G, H) 30 consecutive suprathreshold depolarization (0.2 nA current injection; interstimulus interval, 2s) of WT SGNs (G, black traces), and DKO (H, grey traces), demonstrating the extent of membrane jitters in evoked APs. Plotted below is the corresponding standard deviation. DKO membrane voltage is pre-disposed to increased membrane jitters. (I, J) APs evoked in SGNs from 9-mo old WT (upper panel) cochlea were generally slower to initiate and larger in amplitude compared to those evoked in SGNs from DKO (lower panel) cochlea. The magnitudes of the injected current are indicated. (K) Across SGNs, the excitability of DKO SGNs has plummeted by several-fold. For the example shown, the spike frequency was reduced by ~7-fold.
Figure 5
Figure 5
Changes of membrane properties of WT versus DKO SGNs isolated from cochlear apex and base at different ages (1- 3- 4-5- 6- and 9-month). (A) The resting membrane potential (RMP) of SGNs was significantly altered at different stages in development. (B) Changes in AP amplitudes of WT and DKO SGNs from apical and basal cochlea are summarized. (C) Amplitude of afterhyperpolarization (AHP) measured and summarized (*p < 0.05; **p < 0.01; n = number of SGNs are indicated). For these data, significant differences between genotypes were determined using the unpaired two-tailed t-test. Other action potential parameters such as latency and duration were measured but not shown (we did not identify any significant changes in action potential latency and duration in WT versus DKO at different stages of development and location in the cochlea).
Figure 6
Figure 6
Reduced Na+ current density and available current in KNa1 DKO SGNs. (A) Whole-cell inward Na+ currents were elicited using depolarizing steps from -70 mV to 35 mV (ΔV = 2.5 mV). The currents were normalized to individual membrane capacitance (Cm), were recorded from 1-mo-old mice using apical SGNs from WT (shown with black traces) and DKO (shown with grey traces). Data were generated from 19 SGNs from each experimental group. (B) We observed consistent differences in peak Na+ current (I)- voltage (V) relation among WT (●) apical and DKO (●) SGNs. (C) Voltage-dependent inactivation was tested at -10 mV, using pre-pulse voltages ranging from -90 mV to 60 mV (ΔV = 5 mV) (see representative traces, inset). The mean normalized peak recovered-current versus voltage relation for WT (black line and symbol) and DKO (grey line and symbol) SGN from apical third of the cochlea are plotted (n = 9). The half-inactivation potentials (V1/2) were measured by fitting plots to the Boltzmann function. The V1/2 for WT was -62.9 ± 2.5 mV and the slope factor k, was, 6.2 ± 0.7 mV (n = 11) and DKO was -66.3 ± 2.7 mV and the slope factor k, was 6.9 ± 0.3 mV (n = 13). (D, E) WT (D) and DKO (E) activation and inactivation curves to illustrate window current and sustained/persistent Na+ currents available for activation of KNa1 current. The activation curves for Na+ currents from WT and DKO were fitted with the Boltzmann function. The V1/2 for activation WT SGN was -40.4 ±3.6 mV, and the slope factor k, was 2.9 ± 0.5 mV (n = 9) and DKO was -45.1 ± 4.8 mV, and the slope factor k, was 3.08 ± 0.8 mV (n = 11).
Figure 7
Figure 7
Reduced Na+ current density and available current in KNa1 DKO SGNs. (A) Whole-cell inward Na+ currents were elicited using depolarizing steps from -70 mV to 35 mV (ΔV = 2.5 mV). The currents normalized to individual membrane capacitance (Cm), were recorded from 1-mo-old mice using basal SGNs from WT (shown with black traces) and DKO (shown with grey traces). Data were generated from 15 SGNs of each experimental group. (B) Consistent differences were noted in the peak Na+ current (I)- voltage (V) relation among WT (●) apical and DKO (●) SGNs. (C) In WT ~20% of the Na+ current is sustained, and in the DKO, ~10% persisted. Voltage-dependent activation and inactivation curves fitted with Boltzmann functions. Half-inactivation potentials (V1/2) were measured by fitting plots to them. The V1/2 of the steady-state inactivation for WT was -69.5 ± 3.1 mV and the slope factor k, was, 5.1 ± 0.9 mV (n = 9) and DKO was -66.3 ± 2.7 mV and the slope factor k, was 7.3 ± 0.7 mV (n = 11). The activation curves for Na+ currents from WT and DKO were fitted with the Boltzmann function. The V1/2 for activation WT SGN was -45.1 ± 2.8 mV, and the slope factor k, was 3.1 ± 0.8 mV (n = 9) and DKO was -43.8 ± 2.6 mV, and the slope factor k, was 2.7 ± 0.5 mV (n = 11).
Figure 8
Figure 8
Ca2+ transients in 1-mo old SGNs from WT and DKO mice. (A) Representative examples of line-scan images (inset) captured from unstimulated but spontaneous Ca2+ oscillations showing Ca2+ transients recorded from WT (upper panel, in black) and DKO (lower panel, in gray) SGNs. Sample records show SGN loaded with Fluo 4. (B) Summary data for the fast and slow time constant (τ1 and τ2) of the Ca2+ transient decay at baseline using two exponential functions. The τ1 (ms) for WT = 48.4 ± 7.9; DKO = 73.2 ± 6.3; n = 19 (p = 0.019): and τ2 (ms) for WT = 251.7 ± 24.5; DKO = 373.3 ± 44.2; n = 17 (p = 0.022). (C) Sample records show a region of interest (ROI) of ratiometric Fura 2 assessment of field potential (10V/4Hz) depolarization of WT and DKO SGN (arrows show the time of stimulation). Recovery after field stimulation had ~500-1000s time course (not shown). (D, E) Summary data for the amplitude of the total Ca2+ at baseline and after field stimulation in WT and DKO SGNs (1-mo old apical neurons). The F340/380 for WT before field stimulation = 0.23 ± 0.01 (n = 28); DKO = 0.29 ± 0.03; n = 14 (p = 0.029): and after field stimulation WT = 0.29 ± 0.03 (n = 17); DKO = 0.46 ± 0.06; n = 11 (p = 0.007). Significant differences between genotypes were determined using unpaired two-tailed t-test.
Figure 9
Figure 9
Presynaptic and postsynaptic marker counts are normal in KNa1 DKO in 1-3-, but not 6-9-mo old mice. Synapses between the spiral ganglion neurons (SGNs) and inner hair cells (IHCs) were quantified at four tonotopic locations (4, 8, 16, and 32 kHz) in the organ of Corti isolated from 1-9-mo old WT and DKO mice. (AD) There were no obvious differences between WT and DKO mice in the organization of afferent synapses, identified as paired CtBP2 (red) and PSD95-(green) immunopuncta. Images presented as Z-projections were made using stacks of confocal micrographs from the 4, 8, 16, and 32 kHz region as indicated. (EH) Quantification of the average number of synapses per IHC showed no statistically significant differences between WT (black) and DKO (grey) animals at 1 month of age. However, with increasing age from 3- to 9-mo, statistical differences among the synapse counts appeared and gradually encompassed more tonotopic regions. Statistical differences were observed first at the high-frequency segment of the cochlea. Values (mean ± SEM) are illustrated (p < 0.05, 0.01, 0.001 = *, **, ***). Scale bar = 3 μm.
Figure 10
Figure 10
Myelin density and neurite thickness are unaltered in 1.5-5-old WT and DKO mice. (A) Sections of 1.5- and 5-mo-old WT and DKO spiral ganglion (SG) labeled with Tuj1 (green), and myelin (red) antibodies. Sections were obtained from the basal region of the cochlea. (B) Sections of 1.5 and 5-mo old WT and DKO peripheral neurites of SGN labeled as in (A). (C) Box plot of neurite thickness (diameter) at different age groups. Scale bar = 10 μm.
Figure 11
Figure 11
Age-related degeneration of SGN through apoptosis signal. (AD) Immunofluorescence detection of cleaved caspase 3 (red; AB) and caspase 9 (red; C, D) in WT and DKO 5-mo old cochlear sections. SGNs were labeled with neuronal marker TuJ1 (green). The nuclei were stained with DAPI (blue). Scale bar: 20 μm. Increased active caspase 3/9 was seen in DKO cochlear sections. Scale bar = 10 μm. (E) Shown are cochlear sections of in DKO cochleae at difference ages (1-9 mos) assessed for with TUNEL assay (TUNEL-positive in red). Scale bar: 5 μm. (F) Summary histogram showing a significant reduction in SGN size (diameter) between WT and DKO mice at 6-mo old (data from 9 mice each). (G) Age-dependent (1-9 mo) reduction in SGN densities (data from 8-9 mice each). Comparison between WT and DKO mice. (H) Summary data from WT and DKO cochleae at ages indicated, showing increased TUNEL-positive SGNs in 6-9–mo old (data from 8-9 mice each). Significant differences between genotypes were determined using unpaired two-tailed t-test (* p < 0.05, ** < 0.01, *** < 0.001).
Figure 12
Figure 12
Detection of IP3R1, pIP3R1, and its proteolytic fragments in SGNs from WT and DKO cochlea. (AF) Immunofluorescence detection of the endoplasmic reticulum (ER)-lumen domain of IP3R1(red), phosphorylation site (pIP3R1) (cyan; AC), N-terminal domain (N-IP3R1) (cyan; CF). We examined basal cochlear sections at 1.5-mo and 5-mo WT and DKO mice. SGNs were labeled with neuronal marker TuJ1 (blue). The ER was stained with ER-marker (blue). Merged images are shown together with digitally magnified (~3X) images, shown in the last panel. Scale bar 3 μm. For pIP3R1 at 1.5 mos, the percent of SGNs with positive reactivity for WT was 12 ± 3, and DKO was 54 ± 9; (p < 0.0001, data from 7 mice obtained from 25 section/mice). N-IP3R1 at 1.5- and 5-mos, percent cell reactivity for WT = 6 ± 3; DKO = 37 ± 12, and WT = 9 ± 4; DKO = 61 ± 12, respectively (p < 0.0001, data from 6 mice obtained from 25 section/mice). Scale bar = 10 μm.

Similar articles

  • Short-Term Memory Impairment.
    Cascella M, Al Khalili Y. Cascella M, et al. 2024 Jun 8. In: StatPearls [Internet]. Treasure Island (FL): StatPearls Publishing; 2025 Jan–. 2024 Jun 8. In: StatPearls [Internet]. Treasure Island (FL): StatPearls Publishing; 2025 Jan–. PMID: 31424720 Free Books & Documents.
  • Sodium-activated potassium channels shape peripheral auditory function and activity of the primary auditory neurons in mice.
    Reijntjes DOJ, Lee JH, Park S, Schubert NMA, van Tuinen M, Vijayakumar S, Jones TA, Jones SM, Gratton MA, Xia XM, Yamoah EN, Pyott SJ. Reijntjes DOJ, et al. Sci Rep. 2019 Feb 22;9(1):2573. doi: 10.1038/s41598-019-39119-z. Sci Rep. 2019. PMID: 30796290 Free PMC article.
  • Prescription of Controlled Substances: Benefits and Risks.
    Preuss CV, Kalava A, King KC. Preuss CV, et al. 2025 Jul 6. In: StatPearls [Internet]. Treasure Island (FL): StatPearls Publishing; 2025 Jan–. 2025 Jul 6. In: StatPearls [Internet]. Treasure Island (FL): StatPearls Publishing; 2025 Jan–. PMID: 30726003 Free Books & Documents.
  • COL1A1- and COL1A2-Related Osteogenesis Imperfecta.
    Rodriguez Celin M, Steiner RD, Basel D. Rodriguez Celin M, et al. 2005 Jan 28 [updated 2025 May 29]. In: Adam MP, Feldman J, Mirzaa GM, Pagon RA, Wallace SE, Amemiya A, editors. GeneReviews® [Internet]. Seattle (WA): University of Washington, Seattle; 1993–2025. 2005 Jan 28 [updated 2025 May 29]. In: Adam MP, Feldman J, Mirzaa GM, Pagon RA, Wallace SE, Amemiya A, editors. GeneReviews® [Internet]. Seattle (WA): University of Washington, Seattle; 1993–2025. PMID: 20301472 Free Books & Documents. Review.
  • The Black Book of Psychotropic Dosing and Monitoring.
    DeBattista C, Schatzberg AF. DeBattista C, et al. Psychopharmacol Bull. 2024 Jul 8;54(3):8-59. Psychopharmacol Bull. 2024. PMID: 38993656 Free PMC article. Review.

Cited by

References

    1. Holt CE, Schuman EM. The central dogma decentralized: new perspectives on RNA function and local translation in neurons. Neuron. 2013; 80:648–57. 10.1016/j.neuron.2013.10.036 - DOI - PMC - PubMed
    1. Corcoran AJ, Moss CF. Sensing in a noisy world: lessons from auditory specialists, echolocating bats. J Exp Biol. 2017; 220:4554–66. 10.1242/jeb.163063 - DOI - PubMed
    1. Wan G, Corfas G. Transient auditory nerve demyelination as a new mechanism for hidden hearing loss. Nat Commun. 2017; 8:14487. 10.1038/ncomms14487 - DOI - PMC - PubMed
    1. Olusanya BO, Neumann KJ, Saunders JE. The global burden of disabling hearing impairment: a call to action. Bull World Health Organ. 2014; 92:367–73. 10.2471/BLT.13.128728 - DOI - PMC - PubMed
    1. Hind SE, Haines-Bazrafshan R, Benton CL, Brassington W, Towle B, Moore DR. Prevalence of clinical referrals having hearing thresholds within normal limits. Int J Audiol. 2011; 50:708–16. 10.3109/14992027.2011.582049 - DOI - PubMed

Publication types

MeSH terms