

Combined noninvasive metabolic and spindle imaging as potential tools for embryo and oocyte assessment
- PMID: 31812992
- PMCID: PMC6936724
- DOI: 10.1093/humrep/dez210
Combined noninvasive metabolic and spindle imaging as potential tools for embryo and oocyte assessment
Abstract
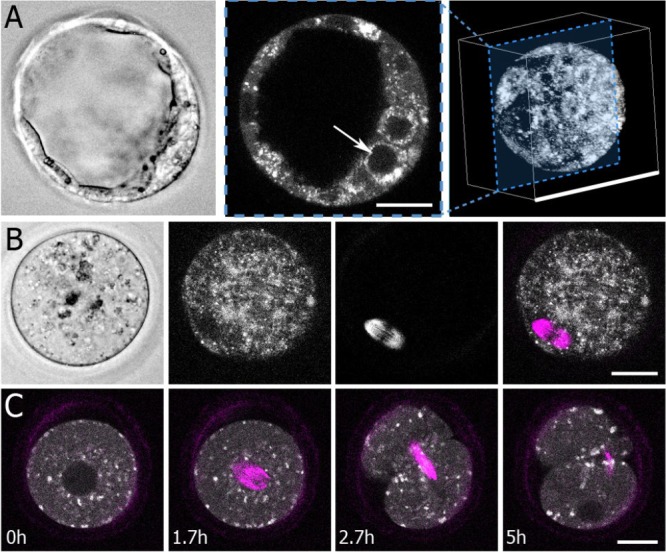
Study question: Is the combined use of fluorescence lifetime imaging microscopy (FLIM)-based metabolic imaging and second harmonic generation (SHG) spindle imaging a feasible and safe approach for noninvasive embryo assessment?
Summary answer: Metabolic imaging can sensitively detect meaningful metabolic changes in embryos, SHG produces high-quality images of spindles and the methods do not significantly impair embryo viability.
What is known already: Proper metabolism is essential for embryo viability. Metabolic imaging is a well-tested method for measuring metabolism of cells and tissues, but it is unclear if it is sensitive enough and safe enough for use in embryo assessment.
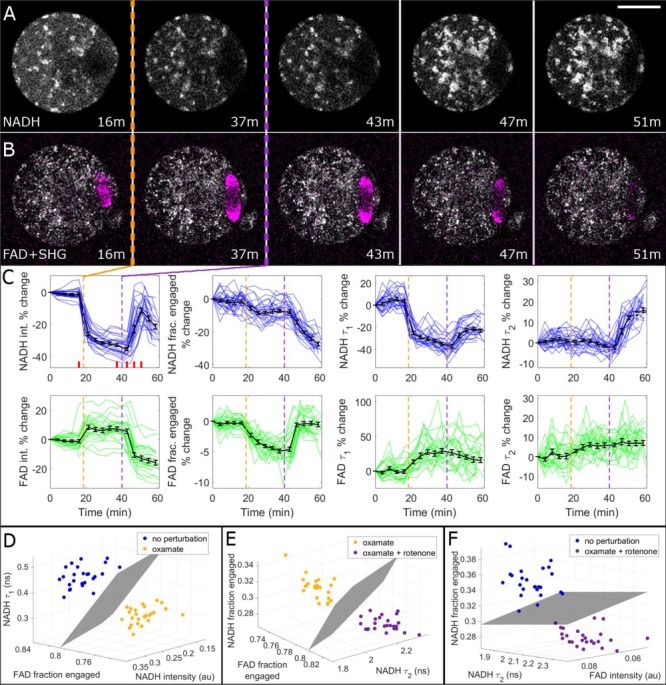
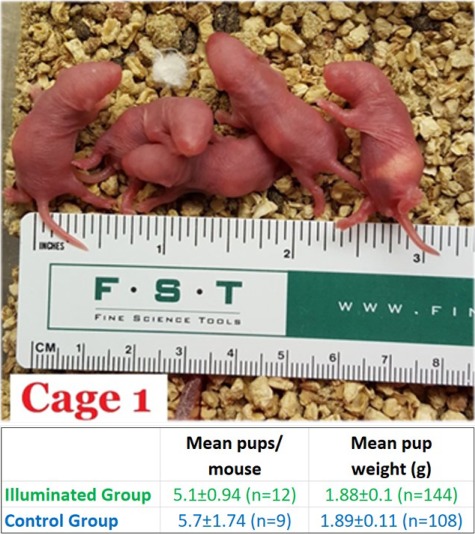
Study design, size, duration: This study consisted of time-course experiments and control versus treatment experiments. We monitored the metabolism of 25 mouse oocytes with a noninvasive metabolic imaging system while exposing them to oxamate (cytoplasmic lactate dehydrogenase inhibitor) and rotenone (mitochondrial oxidative phosphorylation inhibitor) in series. Mouse embryos (n = 39) were measured every 2 h from the one-cell stage to blastocyst in order to characterize metabolic changes occurring during pre-implantation development. To assess the safety of FLIM illumination, n = 144 illuminated embryos were implanted into n = 12 mice, and n = 108 nonilluminated embryos were implanted into n = 9 mice.
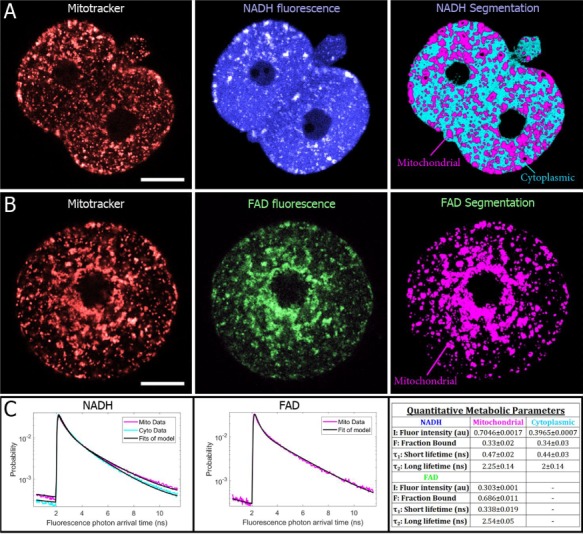
Participants/materials, setting, methods: Experiments were performed in mouse embryos and oocytes. Samples were monitored with noninvasive, FLIM-based metabolic imaging of nicotinamide adenine dinucleotide (NADH) and flavin adenine dinucleotide (FAD) autofluorescence. Between NADH cytoplasm, NADH mitochondria and FAD mitochondria, a single metabolic measurement produces up to 12 quantitative parameters for characterizing the metabolic state of an embryo. For safety experiments, live birth rates and pup weights (mean ± SEM) were used as endpoints. For all test conditions, the level of significance was set at P < 0.05.
Main results and the role of chance: Measured FLIM parameters were highly sensitive to metabolic changes due to both metabolic perturbations and embryo development. For oocytes, metabolic parameter values were compared before and after exposure to oxamate and rotenone. The metabolic measurements provided a basis for complete separation of the data sets. For embryos, metabolic parameter values were compared between the first division and morula stages, morula and blastocyst and first division and blastocyst. The metabolic measurements again completely separated the data sets. Exposure of embryos to excessive illumination dosages (24 measurements) had no significant effect on live birth rate (5.1 ± 0.94 pups/mouse for illuminated group; 5.7 ± 1.74 pups/mouse for control group) or pup weights (1.88 ± 0.10 g for illuminated group; 1.89 ± 0.11 g for control group).
Limitations, reasons for caution: The study was performed using a mouse model, so conclusions concerning sensitivity and safety may not generalize to human embryos. A limitation of the live birth data is also that although cages were routinely monitored, we could not preclude that some runt pups may have been eaten.
Wider implications of the findings: Promising proof-of-concept results demonstrate that FLIM with SHG provide detailed biological information that may be valuable for the assessment of embryo and oocyte quality. Live birth experiments support the method's safety, arguing for further studies of the clinical utility of these techniques.
Study funding/competing interest(s): Supported by the Blavatnik Biomedical Accelerator Grant at Harvard University and by the Harvard Catalyst/The Harvard Clinical and Translational Science Center (National Institutes of Health Award UL1 TR001102), by NSF grants DMR-0820484 and PFI-TT-1827309 and by NIH grant R01HD092550-01. T.S. was supported by a National Science Foundation Postdoctoral Research Fellowship in Biology grant (1308878). S.F. and S.A. were supported by NSF MRSEC DMR-1420382. Becker and Hickl GmbH sponsored the research with the loaning of equipment for FLIM. T.S. and D.N. are cofounders and shareholders of LuminOva, Inc., and co-hold patents (US20150346100A1 and US20170039415A1) for metabolic imaging methods. D.S. is on the scientific advisory board for Cooper Surgical and has stock options with LuminOva, Inc.
Keywords: embryo assessment; flavin adenine dinucleotide; fluorescence; metabolism; mitochondria; nicotinamide adenine dinucleotide; noninvasive; oocyte; spindle.
© The Author(s) 2019. Published by Oxford University Press on behalf of the European Society of Human Reproduction and Embryology. All rights reserved. For permissions, please e-mail: journals.permissions@oup.com.
Figures

Similar articles
-
Fluorescence lifetime imaging microscopy (FLIM) detects differences in metabolic signatures between euploid and aneuploid human blastocysts.Hum Reprod. 2022 Mar 1;37(3):400-410. doi: 10.1093/humrep/deac016. Hum Reprod. 2022. PMID: 35106567
-
Metabolic state of human blastocysts measured by fluorescence lifetime imaging microscopy.Hum Reprod. 2022 Mar 1;37(3):411-427. doi: 10.1093/humrep/deab283. Hum Reprod. 2022. PMID: 34999823
-
Metabolic imaging of human cumulus cells reveals associations with pregnancy and live birth.Hum Reprod. 2024 Jun 3;39(6):1176-1185. doi: 10.1093/humrep/deae087. Hum Reprod. 2024. PMID: 38719791 Free PMC article.
-
Noninvasive metabolic profiling of cumulus cells, oocytes, and embryos via fluorescence lifetime imaging microscopy: a mini-review.Hum Reprod. 2023 May 2;38(5):799-810. doi: 10.1093/humrep/dead063. Hum Reprod. 2023. PMID: 37015098 Free PMC article. Review.
-
Metabolic imaging via fluorescence lifetime imaging microscopy for egg and embryo assessment.Fertil Steril. 2019 Feb;111(2):212-218. doi: 10.1016/j.fertnstert.2018.12.014. Fertil Steril. 2019. PMID: 30691624 Review.
Cited by
-
The clinical use of time-lapse in human-assisted reproduction.Ther Adv Reprod Health. 2020 Dec 7;14:2633494120976921. doi: 10.1177/2633494120976921. eCollection 2020 Jan-Dec. Ther Adv Reprod Health. 2020. PMID: 33336190 Free PMC article. Review.
-
Blasts from the past: is morphology useful in PGT-A tested and untested frozen embryo transfers?Reprod Biomed Online. 2020 Dec;41(6):981-989. doi: 10.1016/j.rbmo.2020.07.014. Epub 2020 Jul 22. Reprod Biomed Online. 2020. PMID: 33011085 Free PMC article.
-
The effect of discrete wavelengths of visible light on the developing murine embryo.J Assist Reprod Genet. 2022 Aug;39(8):1825-1837. doi: 10.1007/s10815-022-02555-4. Epub 2022 Jun 23. J Assist Reprod Genet. 2022. PMID: 35737174 Free PMC article.
-
Non-invasive imaging of mouse embryo metabolism in response to induced hypoxia.J Assist Reprod Genet. 2020 Aug;37(8):1797-1805. doi: 10.1007/s10815-020-01872-w. Epub 2020 Aug 27. J Assist Reprod Genet. 2020. PMID: 32852649 Free PMC article.
-
Optical imaging detects metabolic signatures associated with oocyte quality†.Biol Reprod. 2022 Oct 11;107(4):1014-1025. doi: 10.1093/biolre/ioac145. Biol Reprod. 2022. PMID: 35863764 Free PMC article.
References
-
- Armstrong S, Bhide P, Jordan V, Pacey A, Marjoribanks J, Farquhar C. Time-lapse systems for embryo incubation and assessment in assisted reproduction. Cochrane Database Syst Rev [Internet] 2019; John Wiley & Sons, Ltd Available from: http://doi.wiley.com/10.1002/14651858.CD011320.pub4. - DOI - PMC - PubMed
-
- Baart EB, Martini E, van den BI, Macklon NS, Galjaard RJH, Fauser BCJM, Van OD. Preimplantation genetic screening reveals a high incidence of aneuploidy and mosaicism in embryos from young women undergoing IVF. Hum Reprod 2006;21:223–233. - PubMed
-
- Battaglia DE, Goodwin P, Klein NA, Soules MR. Influence of maternal age on meiotic spindle assembly in oocytes from naturally cycling women. Hum Reprod [Internet]1996;11:2217–2222. - PubMed
-
- Becker W. Fluorescence lifetime imaging – techniques and applications. J Microsc [Internet]2012;247:119–136. - PubMed
Publication types
MeSH terms
Grants and funding
LinkOut - more resources
Full Text Sources
Other Literature Sources
Medical
Research Materials
