. 2020 Feb;75(2):500-509.
doi: 10.1161/HYPERTENSIONAHA.119.13754. Epub 2019 Dec 9.

Noncanonical Mechanisms for Direct Bone Marrow Generating Ang II (Angiotensin II) Predominate in CD68 Positive Myeloid Lineage Cells

Affiliations

Noncanonical Mechanisms for Direct Bone Marrow Generating Ang II (Angiotensin II) Predominate in CD68 Positive Myeloid Lineage Cells

Tomohisa Yamashita et al. Hypertension. 2020 Feb.

Abstract

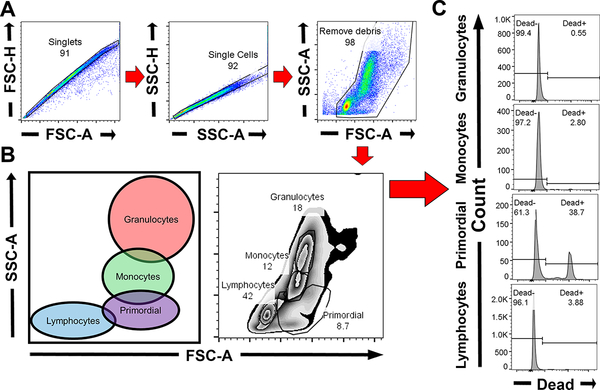
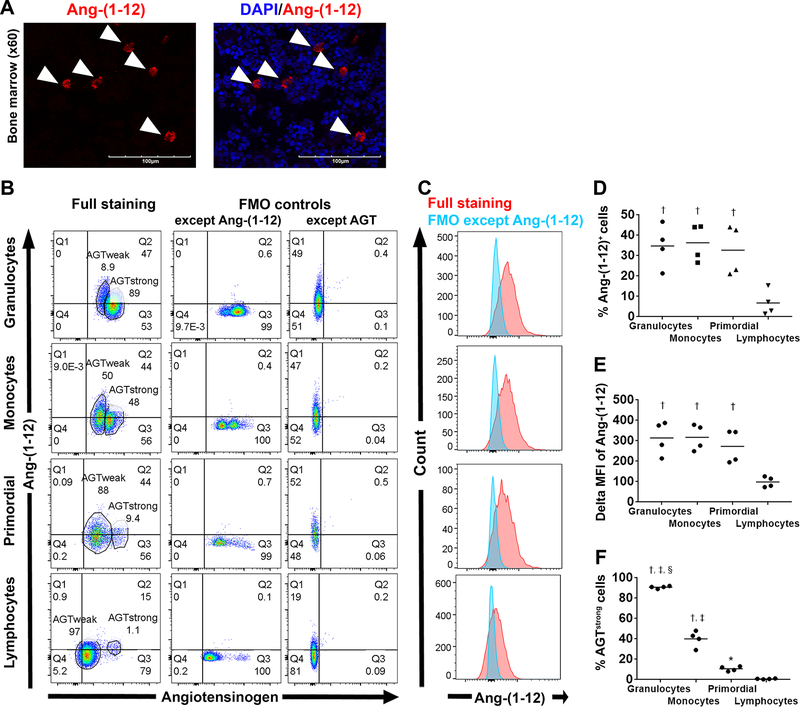
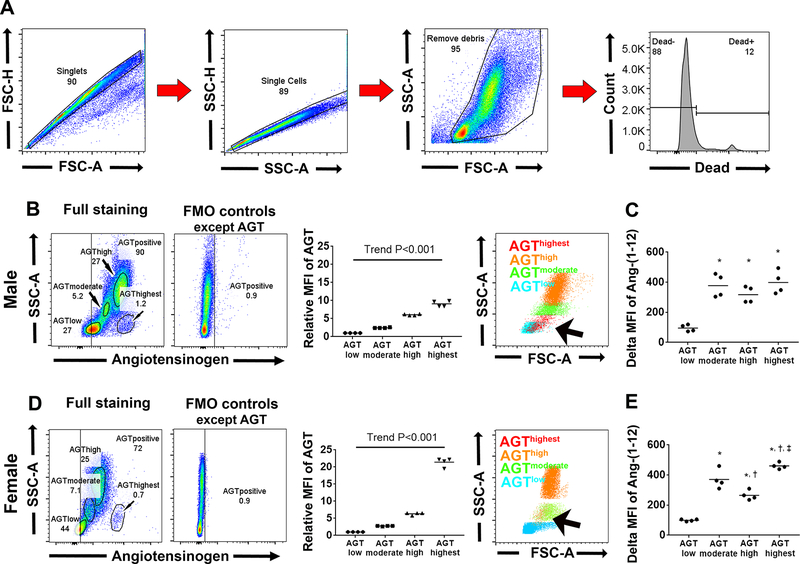
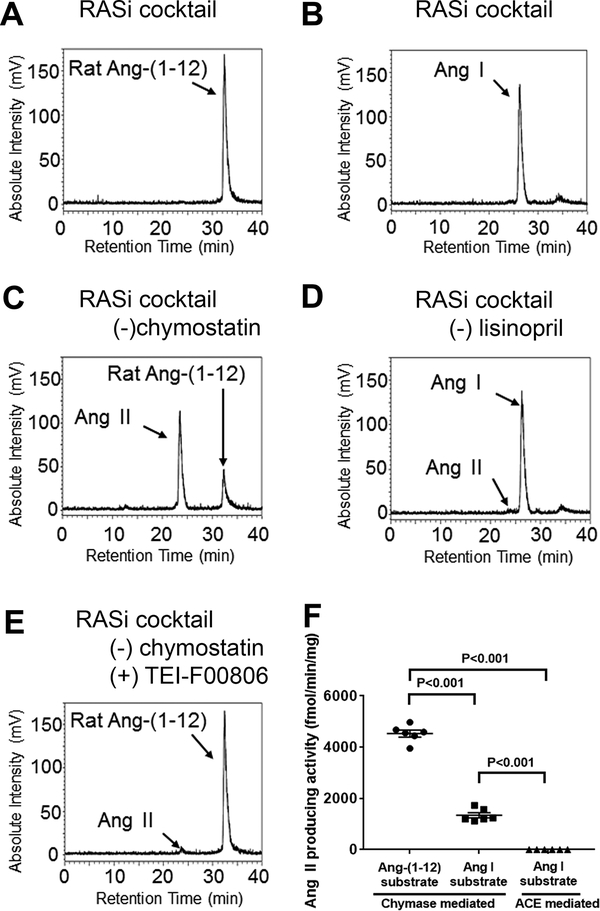
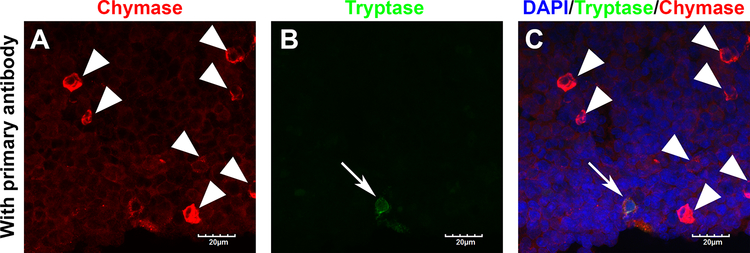
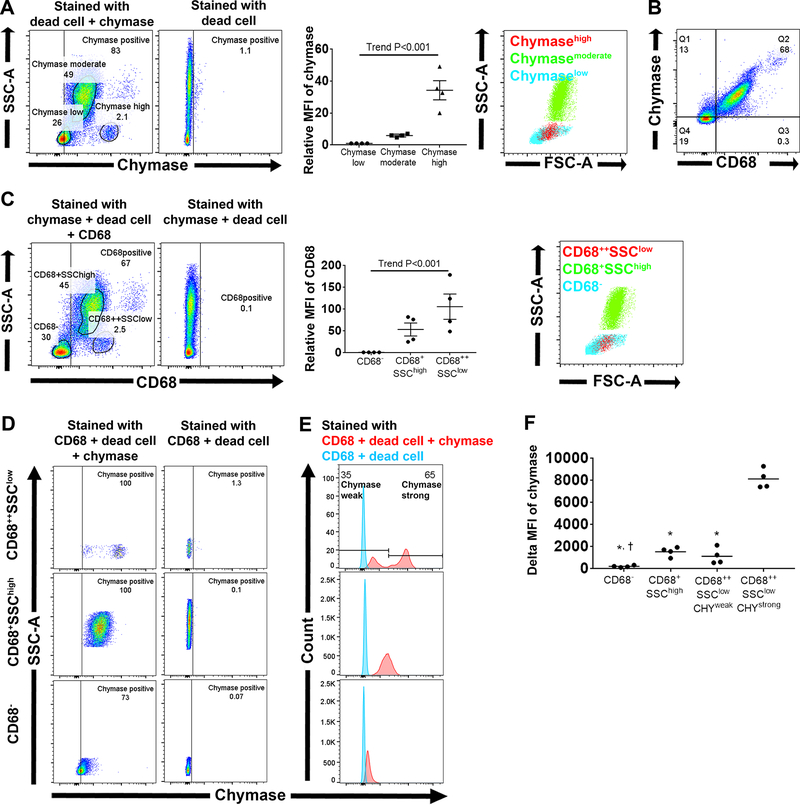
Bone marrow (BM) Ang II (angiotensin II) is a major participant in the regulation of hematopoiesis and immunity. The novel tissue substrate Ang-(1-12) [angiotensin-(1-12)] and its cleaving enzyme chymase are an essential source of Ang II production in cardiac tissue. We hypothesized this noncanonical chymase-mediated Ang II-producing mechanism exists in the BM tissue. Immunohistostaining and flow cytometry confirmed the presence of Ang-(1-12) immunoreaction in the BM of SD (Sprague Dawley) rats. Chymase-mediated Ang II-producing activity in BM was ≈1000-fold higher than ACE (angiotensin-converting enzyme)-mediated Ang II-producing activity (4531±137 and 4.2±0.3 fmol/min per mg, respectively; n=6; P<0.001) and 280-fold higher than chymase activity in the left ventricle of 16.3±1.7 fmol/min per mg (P<0.001). Adding a selective chymase inhibitor, TEI-F00806, eliminated almost all 125I-Ang II production. Flow cytometry demonstrated that delta median fluorescence intensity of chymase in cluster of differentiation 68 positive cells was significantly higher than that in cluster of differentiation 68 negative cells (1546±157 and 222±48 arbitrary units, respectively; P=0.0021). Cluster of differentiation 68 positive and side scatter low subsets, considered to be myeloid progenitors, express the highest chymase fluorescence intensity in rat BM. Chymase activity and cellular expression was similar in both male and female rats. In conclusion, myeloid lineage cells, especially myeloid progenitors, have an extraordinary Ang II-producing activity by chymase in the BM.

Keywords: angiotensin II; bone marrow; chymase; hypertension; inflammation; peptidyl-dipeptidase A.


Conflict of interest statement

Disclosures

No conflicts of interest, financial or otherwise, are declared by the authors.

Figures

Figure 1.
Figure 1.
The gating strategy and four regions in flow cytometry analysis. A, Doublets and debris were removed. B, BM cells were divided into four regions: granulocytes, monocytes, primordial and lymphocytes. C, After fluorescence compensation, dead staining positive cells were removed.
Figure 2.
Figure 2.
Ang-(1–12) expression in male SD rat bone marrow. A, Representative fluorescent photomicrographs (60× magnification) of BM tissue stained with a primary antibody against Ang-(1–12) (red, arrowhead). B-F, Flow cytometry analysis for intracellular staining of AGT and Ang-(1–12) in male SD rat BM (n = 4). Gating strategy is shown in Figure 1. B, Representative AGT/Ang-(1–12) plots in each region. Full staining includes dead cell staining, AGT and Ang-(1–12). C, Red illustrates Ang-(1–12) fluorescence intensity in cells with full staining while blue shows that with full staining except Ang-(1–12). Mean data are shown in D-F. * P<0.05 vs lymphocytes region, P<0.001 vs lymphocyte region, P<0.01 vs primordial region, § P<0.001 vs monocyte region.
Figure 3.
Figure 3.
Back gating analysis for intracellular staining of AGT and Ang-(1–12) on flow cytometry. A, The employed gating strategy. B-C, Experiments conducted on male SD rats. B, Representative AGT/SSC-A plot and quantitative analysis divide whole BM cells into four subsets: AGTlow, AGTmoderate, AGThigh and AGThighest. Right panel shows subsets were backgated onto FSC-A/SSC-A plot. Arrow indicates AGThighest subset. C, Delta MFI of Ang-(1–12) in each subset. D-E, Experiments were repeated in female SD rats. * P<0.001 vs AGTlow, P<0.05 vs AGTmoderate, P<0.001 vs AGThigh.
Figure 4.
Figure 4.
Representative chromatograms of 125I-angiotensin products from male BM tissue. A, 125I-Ang II metabolic products from 125I-Ang-(1–12) in the presence of all inhibitors. B, 125I-Ang II metabolic products from 125I-Ang I in the presence of all inhibitors. C, 125I-Ang II metabolic products from 125I-Ang-(1–12) in the presence of all inhibitors without chymostatin. D, 125I-Ang II metabolic products from 125I-Ang I in the presence of all inhibitors without lisinopril. E, 125I-Ang II metabolic products from 125I-Ang-(1–12) in the presence of all inhibitors without chymostatin but including TEI-F00806. F, The values of chymase- or ACE-mediated ANG II production activities in male rat BM.
Figure 5.
Figure 5.
Representative immunofluorescence photomicrographs (100×) of bone marrow tissue showing chymase (red), tryptase (green) and nuclei (DAPI, blue) A, Red channel. Arrowheads indicate chymase strongly positive cells. B, Green channel. Arrow indicates tryptase positive cell. C, Merged image. Scale bar indicates 20 μm.
Figure 6.
Figure 6.
Flow cytometry analysis for intracellular staining of chymase and CD68 (n = 4) in male SD rat bone marrow. Data are shown for whole BM cells except doublets and dead cell stained cells according to the gating strategy shown in Figure 3A. A, The representative chymase/SSC-A plot and quantitative analysis. Right panel shows subsets according to chymase fluorescence were backgated onto FSC-A/SSC-A plot. B, Representative CD68/chymase plot. C, CD68/SSC plot and quantitative analysis. Right panel shows subsets according to CD68/SSC-A plots were backgated onto FSC-A/SSC-A plot. D, Representative chymase/SSC-A plot. E, Red illustrates chymase fluorescence intensity in cells with full staining while blue shows those with full staining except chymase. F, Delta MFI of chymase in each subset. * P<0.001 vs CD68++SSClowCHYstrong subset, P<0.05 vs CD68+SSChigh subset.

References

    1. Aparicio-Vergara M, Shiri-Sverdlov R, Koonen DP, Hofker MH. Bone marrow transplantation as an established approach for understanding the role of macrophages in atherosclerosis and the metabolic syndrome. Curr Opin Lipidol. 2012;23:111–121. doi: 10.1097/MOL.0b013e3283508c4f - DOI - PubMed
    1. Fujimiya M, Nagaishi K, Yamashita T, Ataka K. Bone marrow stem cell abnormality and diabetic complications. Anat Rec (Hoboken). 2012;295:917–921. doi: 10.1002/ar.22445 - DOI - PubMed
    1. Soler MJ, José Tomas OP. Stem cells in kidney diseases. J Stem Cells. 2012;7:245–259. doi: jsc.2013.7.4.245. - PubMed
    1. Yamashita T, Fujimiya M, Nagaishi K, Ataka K, Tanaka M, Yoshida H, Tsuchihashi K, Shimamoto K, Miura T. Fusion of bone marrow-derived cells with renal tubules contributes to renal dysfunction in diabetic nephropathy. FASEB J. 2012;26:1559–1568. doi: 10.1096/fj.11-183194 - DOI - PubMed
    1. de Macedo Braga LM, Lacchini S, Schaan BD, Rodrigues B, Rosa K, De Angelis K, Borges LF, Irigoyen MC, Nardi NB. In situ delivery of bone marrow cells and mesenchymal stem cells improves cardiovascular function in hypertensive rats submitted to myocardial infarction. J Biomed Sci. 2008;15:365–374. doi: 10.1007/s11373-008-9237-z - DOI - PubMed

Publication types