. 2019 Dec 16;29(24):4231-4240.e5.
doi: 10.1016/j.cub.2019.10.049. Epub 2019 Dec 5.

Activity-Dependent Nucleation of Dynamic Microtubules at Presynaptic Boutons Controls Neurotransmission

Affiliations

Activity-Dependent Nucleation of Dynamic Microtubules at Presynaptic Boutons Controls Neurotransmission

Xiaoyi Qu et al. Curr Biol. .

Abstract

Control of microtubule (MT) nucleation and dynamics is critical for neuronal function. Whether MT nucleation is regulated at presynaptic boutons and influences overall presynaptic activity remains unknown. By visualizing MT plus-end dynamics at individual excitatory en passant boutons in axons of cultured hippocampal neurons and in hippocampal slices expressing EB3-EGFP and vGlut1-mCherry, we found that dynamic MTs preferentially grow from presynaptic boutons, show biased directionality in that they are almost always oriented toward the distal tip of the axon, and can be induced by neuronal activity. Silencing of γ-tubulin expression reduced presynaptic MT nucleation, and depletion of either HAUS1 or HAUS7-augmin subunits increased the percentage of retrograde comets initiated at boutons, indicating that γ-tubulin and augmin are required for activity-dependent de novo nucleation of uniformly distally oriented dynamic MTs. We analyzed the dynamics of a wide range of axonal organelles as well as synaptic vesicles (SVs) relative to vGlut1+ stable presynaptic boutons in a time window during which MT nucleation at boutons is promoted upon induction of neuronal activity, and we found that γ-tubulin-dependent presynaptic MT nucleation controls bidirectional (SV) interbouton transport and regulates evoked SV exocytosis. Hence, en passant boutons act as hotspots for activity-dependent de novo MT nucleation, which controls neurotransmission by providing dynamic tracks for bidirectional delivery of SVs between sites of neurotransmitter release.

Keywords: augmin; dynamic microtubules; microtubule nucleation; presynaptic boutons; synaptic vesicles; γ-tubulin.


Conflict of interest statement

DECLARATION OF INTERESTS

The authors declare no conflict of interests.

Figures
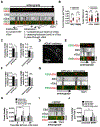
Figure 1.
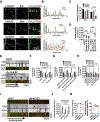
Figure 1.. Dynamic MT plus ends initiate at presynaptic boutons upon induction of neuronal activity.
(A) Representative maximum projection of spinning disk confocal fluorescence images and kymographs of untreated hippocampal neurons (21DIV) transfected with EB3-EGFP (EB3) and vGlut1-mCherry (vGlut) 24h prior to live imaging (Figure S1A,B). Shown by arrows are the classifications of axonal dynamic MTs in inter- and intrabouton MTs as described. (B) Comet density and lifetime of intrabouton and interbouton EB3 comets in neurons treated as in (A). (C) Probability of EB3 comets starting or ending at vGlut+ stable puncta from experimental observations or predicted random events. Experimental probability refers to the observed frequency of EB3 starting or ending at vGlut+ stable puncta. Predicted probability refers to the chance of any EB3 comet to randomly start or end at vGlut and it was calculated by taking the ratio of the observed number of vGlut+ stable puncta × the average diameter of a vGlut+ stable punctum (1μm) / axonal length (μm). (D) Representative maximum projection of spinning disk confocal fluorescence images of an acute hippocampal slice in the CA1 region from 21 day old mice electroporated with EB3-EGFP and vGlut1-mCherry at E15.5. vGlut1-mCherry channel under a 20x objective is shown and the white dotted box indicates the axonal region selected for live imaging using a 60x objective. (E) Representative maximum projection of spinning disk confocal fluorescence image and kymographs of an axon from boxed region in D (Video S1). Asterisks indicate comet tracks initiating from vGlut+ stable boutons. (F) Probability of EB3 comets starting or ending at vGlut+ stable puncta from experimental observations or predicted random events in axons from acute hippocampal slices. (G,I) Representative kymographs of hippocampal neurons (21DIV) transfected with EB3 and vGlut and pretreated with 50μM of the NMDA receptor antagonist D-AP5 6–12h prior to imaging, followed by a 1min washout (w/o) and incubation with 20μM of the GABAa receptor antagonist bicuculline up to 30min (G) (Figure S1C–F and Video S2), or directly treated with 50ng/mL BDNF for 1min (I) (Figure S1G,H and Video S3). (H, J) Subclassified comet density for intrabouton MTs measured in hippocampal neurons treated as in G or I for the indicated times. * p<0.05; ** p<0.01; *** p<0.001 by two-tailed Wilcoxon matched-pairs signed rank tests (B, C, F: N = 6–8 axons; H, J: N = 6–9 axons). NS, non significant.
Figure 2.
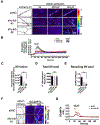
Figure 2.. Neuronal activity induces de novo nucleation of distally oriented dynamic MTs through γ-tubulin and augmin function at presynaptic boutons.
(A) Maximum projection of laser scanning confocal fluorescence images acquired with an Airyscan detector in hippocampal neurons (21DIV) fixed and stained for γ-tubulin, HAUS7, GAPDH and synapsin-1 (Syn) (Figure S2A,B). White arrows indicate signals co-localizing with Syn. (B) Normalized intensity of line scan of axons shown in (A) and indicated by arrows. (C) Manders’ coefficients of Syn+ puncta co-localizing with γ-tubulin, HAUS7 or GAPDH. M1 refers to the fraction of Syn+ puncta overlapping with γ-tubulin, HAUS7 or GAPDH; M2 refers to the fraction of γ-tubulin, HAUS7 or GAPDH overlapping with Syn+ puncta. (D, F) Quantification of EB3 comet density in axons and dendrites (D) and representative kymographs (E) of EB3 comets in axons of hippocampal neurons (20DIV) infected with noncoding control (shNC) or shRNA against γ-tubulin (shγ-tub #1 or shγ-tub #2) for 6d (Figure S2C–F). (F) Quantification of subclassified EB3 comet density relative to stable vGlut+ puncta in axons of hippocampal neurons as in (E) (Figure S2G). (G) Quantification of subclassified EB3 comet density relative to stable vGlut+ puncta in axons of hippocampal neurons (20DIV) infected with shNC or shγ-tub #2 for 6d and rescued by co-transfecting emerald control or human γ-tubulin-emerald that is resistant to lentiviral knockdown with EB3-tdTomato and vGlut1-mTAGBFP2 24h prior to live imaging (Figure S2H–J). (H) Quantification of subclassified EB3 comet density relative to stable vGlut+ puncta of hippocampal neurons (18DIV) infected with shNC or shγ-tub#1 or #2 for 4d and transfected with EB3-EGFP (EB3) and vGlut1-mCherry 24h prior to live imaging. Neurons were pretreated with D-AP5 6–12h prior to imaging, followed by a washout and incubation with bicuculline for 1–10min (+Bic). (I) Kymographs of hippocampal neurons (21DIV) infected with shNC or shRNAs against HAUS1 or HAUS7 for 7d (Figure S2K,L) and transfected with EB3-EGFP (EB3) and vGlut1-mCherry (vGlut) 24h prior to live imaging (Video S4). Red arrows show a retrogradely oriented EB3 comet initiating from a bouton. (J) Quantification of intra- and interbouton comet density in neurons treated as in (I). (K) Quantification of the percentage of retrograde comets and retrograde comets starting at boutons of neurons as in (H). * p<0.05; ** p<0.01; *** p<0.001 by Mann Whitney test (C: N = 10 axons), Kruskal-Wallis tests with Dunn’s multiple comparisons tests (D, F: N = 10=12 axons; G: N = 5 axons; J, K: N= 6–7 axons), and two-tailed Wilcoxon matched-pairs signed rank test (H: N= 10–12 axons). NS, non significant.
Figure 3.
Figure 3.. MT nucleation at boutons is required for bidirectional SV interbouton movement stimulated by neuronal activity.
(A-D) Representative kymographs (A) and quantification of the percentage of moving vGlut+ (B) or synaptophysin+ (SYP) (C) puncta and percentage of moving vGlut+ puncta starting and/or ending at boutons out of moving vGlut+ puncta population (D) in untreated hippocampal neurons (18DIV) or AP5 pretreated neurons before and after a washout with bicuculline. Neurons were transfected with EB3-EGFP and vGlut1-mCherry (B) or EB3-tdTomato and SYP-Venus (C), and vGlut1-mTAGBFP2 24h prior to live imaging (Figure S3A–F, I–K). (E, G, I) Representative kymographs of vGlut+ (E), SYP+ (G), or Arl8b+ (I) puncta in hippocampal neurons (18DIV) infected with noncoding control (shNC) or shRNA against γ-tubulin (shγ-tub #2) for 4d and treated as in A, B, or transfected with EB3-tdTomato and Arl8b-EGFP (I) (Figure S3G,H,L). (F, H, J) Quantification of the percentage of moving vGlut+ (F), SYP+ (H), or Arl8b+ (J) puncta and the percentage of moving tracks starting or ending at boutons out of moving vGlut+ (F), SYP+(H) and Arl8b+(J) puncta populations in hippocampal neurons treated as in E, G, or I. * p<0.05; ** p<0.01; *** p<0.001 by Mann-Whitney tests comparing untreated and AP5 washout with bicuculline, and Wilcoxon matched-pairs signed rank tests comparing before and after AP5 washout with bicuculline (N = 8–12 axons).
Figure 4.
Figure 4.. MT nucleation at boutons controls SV exocytosis.
(A). Representative images of hippocampal neurons (16DIV) infected with noncoding control (shNC) or two independent shRNAs against γ-tubulin (shγ-tub #1 or #2) for 4d and co-transfected with vGlut1-pHluorin and mCherry-C1 prior to recording vGlut1-pHluorin dequenching for the indicated times in response to neuronal activation induced by 300 action potentials (AP) at 10Hz starting from 30s (Figure S4). (B) Normalized fluorescence change (ΔF) over total vGlut1-pHluorin (ΔF upon NH4Cl dequenching) at the indicated times. (C) Integrated intensity of vGlut1-pHluorin signal during the 300AP stimulation paradigm. (D) Total pool of SVs indicated by vGlut1-pHluorin signal intensity at active presynapses after alkalinization with NH4Cl. (E) Recycling pool of SVs indicated by the ratio of ΔF at maximum stimulation over ΔF after alkalinization with NH4Cl. (F) Representative images of hippocampal neurons (16DIV) infected shNC or shγ-tub #2 lentiviruses for 4d and co-transfected with GCaMP7s and vGlut1-mCherry using the same stimulation protocol as in A. (G) Ratio of GCaMP fluorescence change (ΔF) over baseline intensity (F0) at the indicated times. * p<0.05; ** p<0.01; *** p<0.001 by Mann-Whitney tests (A-E: N = 4–6 imaging fields including 8–18 axons with 200–360 boutons; F,G: N = 3–4 imaging fields including 6–12 axons with 120–150 boutons). Red asterisk in G compares γ-tubulin #2 to control levels at 40s.

Comment in

References

    1. Dent EW (2017). Of microtubules and memory: implications for microtubule dynamics in dendrites and spines. Mol Biol Cell 28, 1–8. - PMC - PubMed
    1. Kapitein LC, and Hoogenraad CC (2015). Building the Neuronal Microtubule Cytoskeleton. Neuron 87, 492–506. - PubMed
    1. Nirschl JJ, Ghiretti AE, and Holzbaur ELF (2017). The impact of cytoskeletal organization on the local regulation of neuronal transport. Nat Rev Neurosci 18, 585–597. - PMC - PubMed
    1. Gu J, Firestein BL, and Zheng JQ (2008). Microtubules in dendritic spine development. J Neurosci 28, 12120–12124. - PMC - PubMed
    1. Hu X, Viesselmann C, Nam S, Merriam E, and Dent EW (2008). Activity-dependent dynamic microtubule invasion of dendritic spines. J Neurosci 28, 13094–13105. - PMC - PubMed

Publication types