. 2020 Feb 5;105(3):506-521.e7.
doi: 10.1016/j.neuron.2019.11.003. Epub 2019 Dec 5.

Usp9X Controls Ankyrin-Repeat Domain Protein Homeostasis during Dendritic Spine Development

Affiliations

Usp9X Controls Ankyrin-Repeat Domain Protein Homeostasis during Dendritic Spine Development

Sehyoun Yoon et al. Neuron. .

Abstract

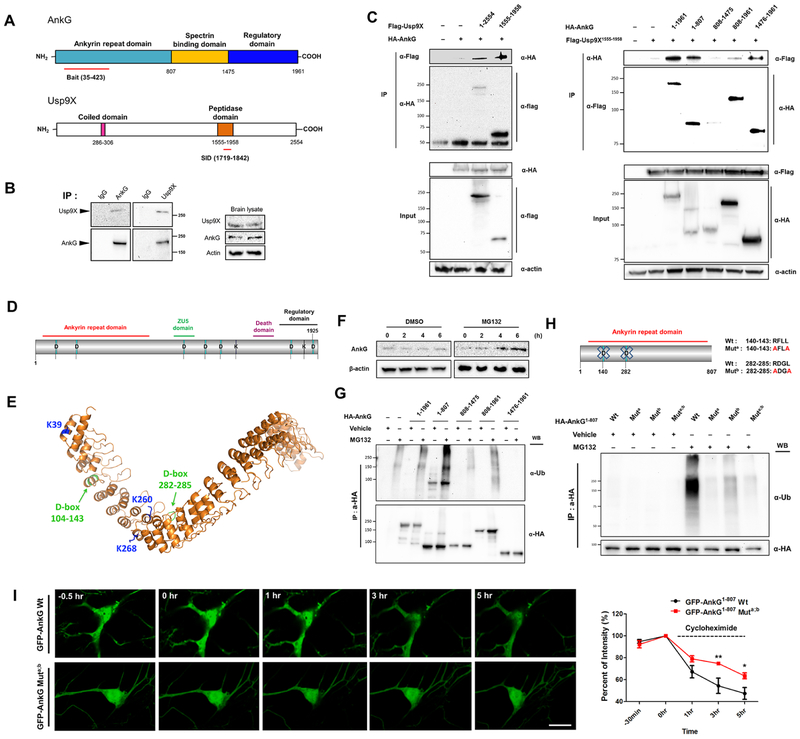
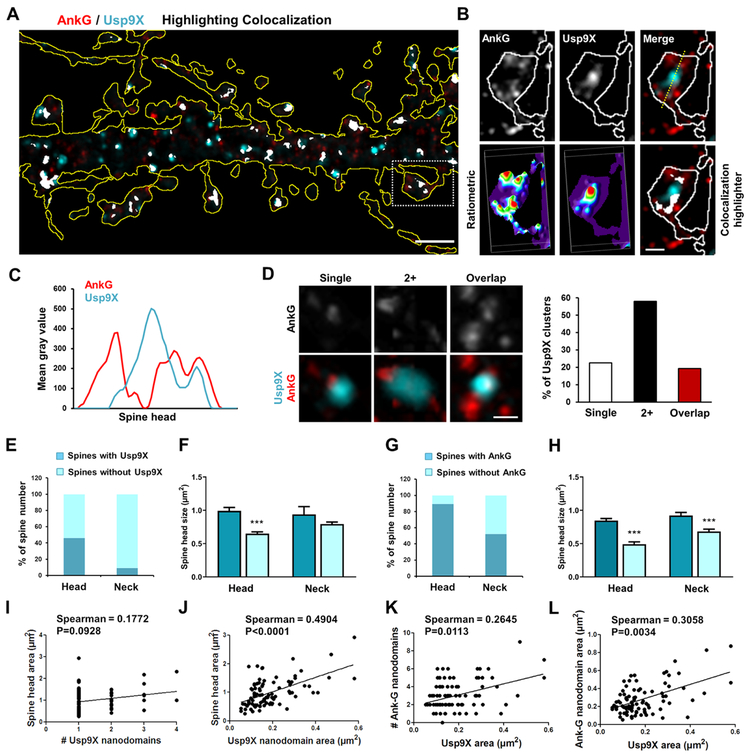
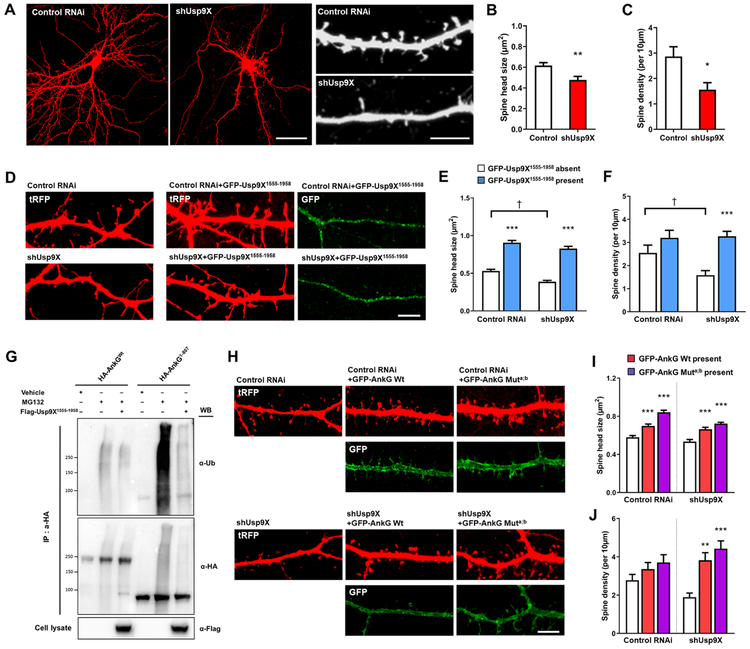
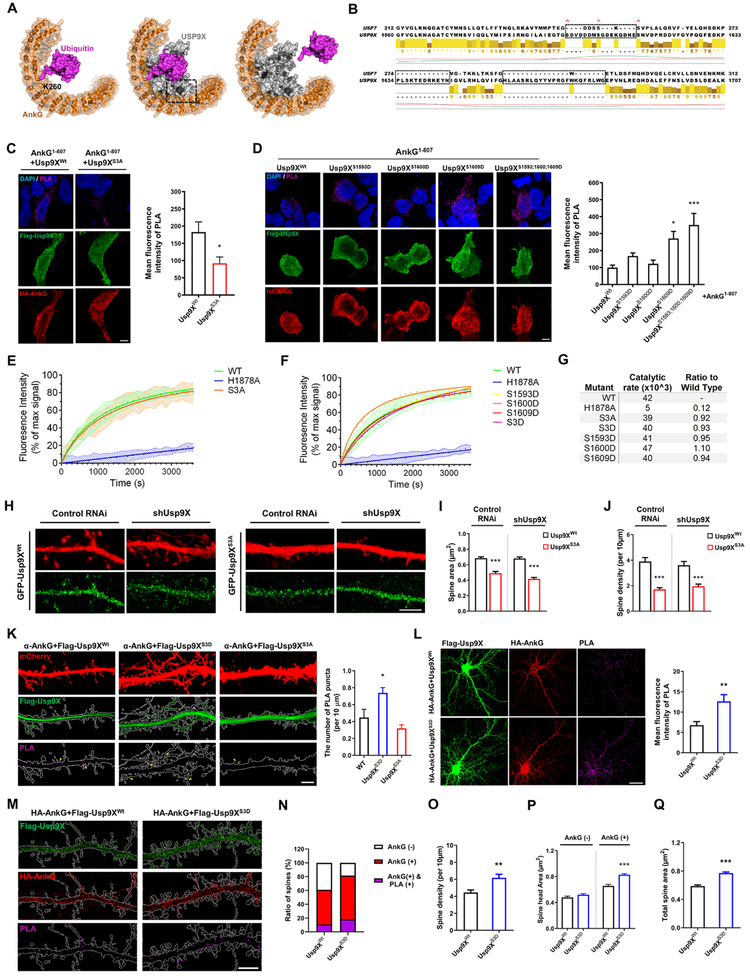
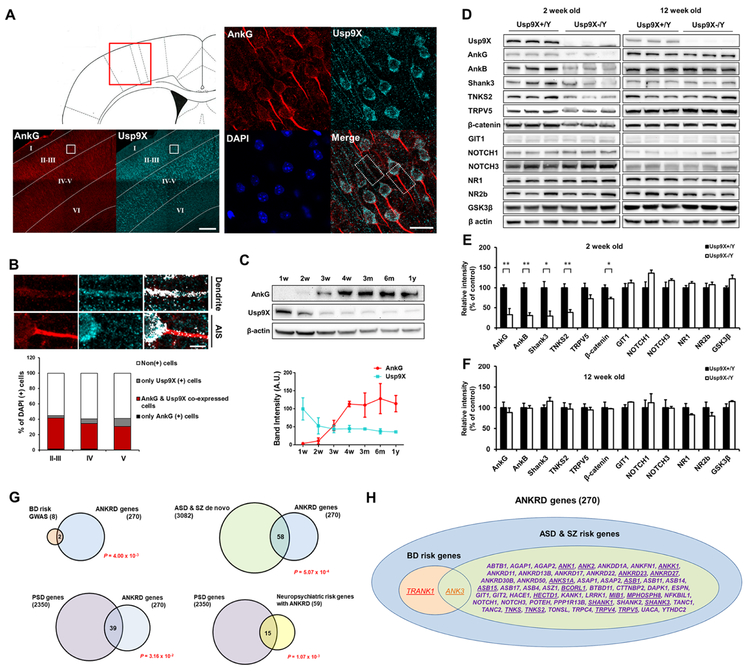
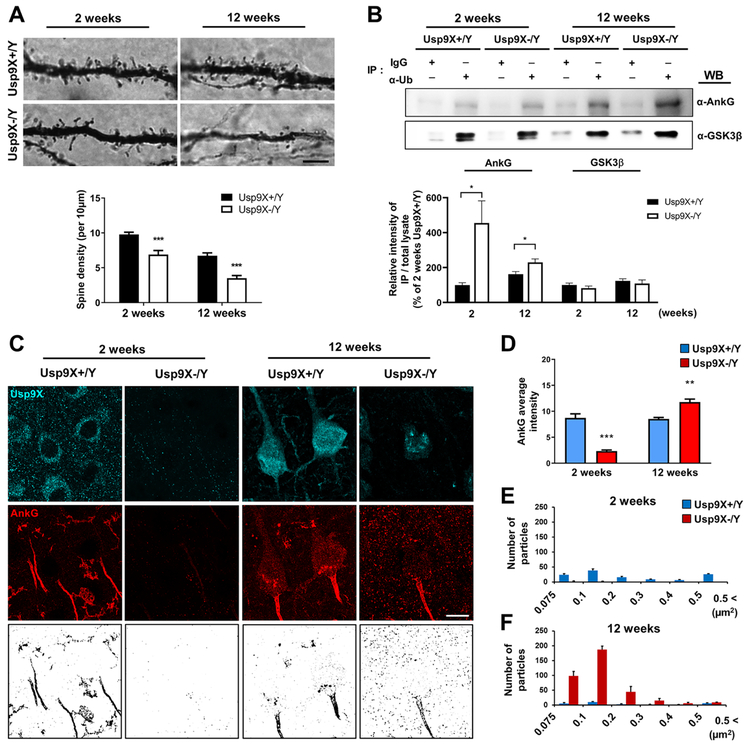
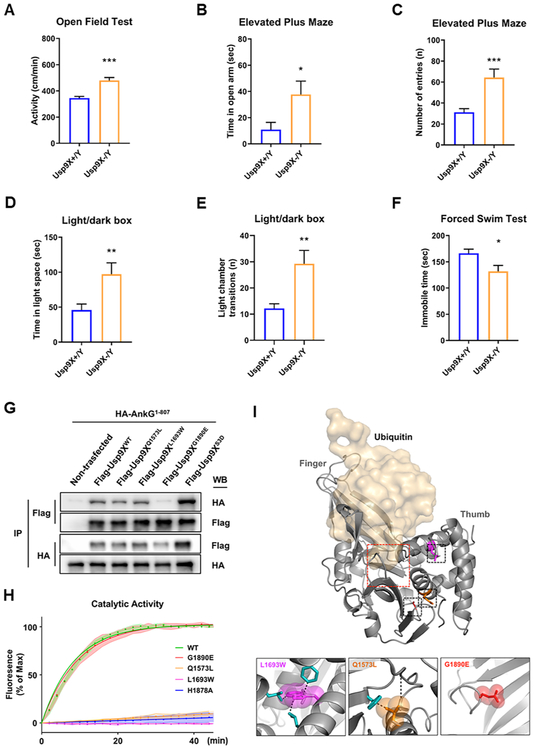
Variants in the ANK3 gene encoding ankyrin-G are associated with neurodevelopmental disorders, including intellectual disability, autism, schizophrenia, and bipolar disorder. However, no upstream regulators of ankyrin-G at synapses are known. Here, we show that ankyrin-G interacts with Usp9X, a neurodevelopmental-disorder-associated deubiquitinase (DUB). Usp9X phosphorylation enhances their interaction, decreases ankyrin-G polyubiquitination, and stabilizes ankyrin-G to maintain dendritic spine development. In forebrain-specific Usp9X knockout mice (Usp9X-/Y), ankyrin-G as well as multiple ankyrin-repeat domain (ANKRD)-containing proteins are transiently reduced at 2 but recovered at 12 weeks postnatally. However, reduced cortical spine density in knockouts persists into adulthood. Usp9X-/Y mice display increase of ankyrin-G ubiquitination and aggregation and hyperactivity. USP9X mutations in patients with intellectual disability and autism ablate its catalytic activity or ankyrin-G interaction. Our data reveal a DUB-dependent mechanism of ANKRD protein homeostasis, the impairment of which only transiently affects ANKRD protein levels but leads to persistent neuronal, behavioral, and clinical abnormalities.

Keywords: ANK; SHANK; ankyrin-G; deubiquitinase; intellectual disability; proximity ligation assay; structured illumination microscopy.


Conflict of interest statement

Declaration of Interests The authors declare no competing interests.

Figures

Figure 1.
Figure 1.
Ankyrin-G stability is regulated through ubiquitination and Usp9X-dependent deubiquitination. (A) Ankyrin-G ANKRD interacts with the peptidase domain of Usp9X in a yeast 2-hybrid screen; red lines: interaction domains. (B) Co-immunoprecipitation of ankyrin-G with Usp9X from mouse cortex. (C) Domain-mapping of the ankyrin-G-Usp9X interaction from HEK293T cells. (D) Schematic of ankyrin-G with D- and KEN-boxes. (E) Homology model of ankyrin-G based on ankyrin-B (PDB-4RLV). D-boxes and ubiquitinated lysines are shown. (F) Ankyrin-G levels after MG132 treatment (10 μM). Cell lysates were prepared from primary cultured cortical neurons. (G) Mapping of ubiquitinated domains of ankyrin-G from HEK293T cells. (H) D-box-dependent ubiquitination of HA-ankyrin-G1-807 from HEK293T cells. (I) Kinetics of D-box-dependent degradation of ankyrin-G. Time-lapse of GFP fluorescence after cycloheximide (20 μg/ml) treatment of GFP-ankyrin-G1-807 or GFP-ankyrin-G1-807-Muta;b-expressing neurons (n = 7 cells per each group). Scale bar, 10 μm. Right: Quantification of GFP fluorescence intensity over time (3h, **p < 0.01; 5h, *p < 0.05). Repeated measures of two-way ANOVA were followed by Bonferroni post-tests. Data are represented as mean ± SEM. See also Figure S1.
Figure 2.
Figure 2.
Super-resolution imaging of spatial organization of ankyrin-G and Usp9X relationship with spine architecture. (A) SIM image of ankyrin-G and Usp9X immunofluorescence in a dendritic region outlined by tRFP expression; scale bar, 2 μm. (B) High-resolution image of boxed spine in (A). Lower panels: ratiometric images and colocalization (white). Scale bar, 1 μm. (C) Line scan through spine head. (D) Representative spatial relationships between ankyrin-G and Usp9X within individual spine heads. Scale bar = 0.25 μm. Quantification shows the percentage of spines with each distribution. (E-H) The fraction of spines having Usp9X or ankyrin-G nanodomains in the head or neck. Spine head size related to the presence or absence of Usp9X or ankyrin-G nanodomains in the head or neck. Total 198 spines were analyzed from 6 neurons. ***p < 0.001; One-way ANOVA was followed by Bonferroni post-tests. Data are represented as mean ± SEM. (I-L) Correlation plots of spine head areas, number and size of ankyrin-G nanodomains/spine with number and area of Usp9X nanodomains/spine from (E-H). Two-tailed spearman tests were performed. See also Figure S2.
Figure 3.
Figure 3.
Usp9X regulates spine morphology by deubiquitination of ankyrin-G. (A) Confocal images of neurons expressing scramble (control RNAi) or Usp9X knockdown (shUsp9X) construct. Scale bar = 40 μm for the left panel and 5 μm for the right panel. (B, C) Bar graph showing shUsp9X causes a decrease in spine head size and density compared with control. Control from 9 cells and shUsp9X from 10 cells were analyzed; **p = 0.0025, *p = 0.0114. Two-tailed unpaired t-test was performed. (D) Confocal images of control RNAi or shUsp9X transfecting neurons co-expressing GFP-Usp9X1555-1958 construct. Scale bar, 5 μm. (E, F) Bar graph of spine head size and density showing co-expression of GFP-Usp9X1555-1958 with control or shUsp9X. 20 neurons were analyzed from each group. ***p < 0.001, p < 0.05; Two-way ANOVA was followed by Bonferroni post-tests. (G) The peptidase domain of Usp9X (Flag-Usp9X1555-1958) promotes ankyrin-G deubiquitination. Cell lysates were analyzed from HEK293T cells. (H) Confocal images of neurons expressing control RNAi or shUsp9X, co-expressing GFP-ankyrin-G or GFP-ankyrin-G-Muta;b. Scale bar, 5 μm. (I, J) Quantification of the effects on spine size or density. 20 neurons were analyzed per each group. **p < 0.01, ***p < 0.001; One-way ANOVA was followed by Bonferroni post-tests. Data are represented as mean ± SEM. See also Figure S3.
Figure 4.
Figure 4.
Spatial organization of ankyrin-G and phosphomimetic Usp9X interaction and relationship with spine architecture. (A) Schematic of Usp9X-mediated Ub-ankyrin-G DUB activity. Homology model of ankyrin-G ANKRD showing the predicted position of ubiquitinated K260. A potential orientation for Usp9X homology model is indicated based on the position of K260-ubiquitin and minimal steric clash. (B) Alignment of Usp7 and Usp9X peptidase domains reveals three regions of low homology. Red crosses indicate S1593, S1600, S1608 phosphorylation sites. (C) In situ PLA measurement of the interaction between HA-ankyrin-G1-807 and Flag-Usp9X1555-1958 Wt or Flag-Usp9X1555-1958-S1593A-S1600A-S1609A (S3A) in HEK293T cells (Usp9XWt control, n = 16; Usp9XS3A control, n = 9. *p = 0.042). Two-tailed unpaired t-test was performed. (D) In situ PLA measurement of the interaction between HA-ankyrin-G1-807 and phosphomimetic mutants of Flag-Usp9X1555-1958 in HEK293T cells. Bar graph of PLA signal (n = 20 from each condition). *p < 0.05; ***p < 0.001; One-way ANOVA was followed by Bonferroni post-tests. (E-F) The ability of His-Usp9X1547-1962 S3A or His-Usp9X1547-1962-S1593D-S1600D-S1609D (S3D) or each single phosphomimetic mutation to catalyze the cleavage of the fluorogenic substrate was compared to the wild type peptidase domain (WT) and an active site mutant (H1878A). (G) The rate constants of each mutant tested (E, F) were calculated as change in fluorescence intensity per unit time and as a ratio to the WT protein. (H-J) Replacement of RNAi-resistant GFP-Usp9X1555-1958 Wt but not GFP-Usp9X1555-1958 S3A restores spine morphogenesis, as depicted in bar graphs. Scale bar, 5 μm. 20-22 neurons were analyzed from each condition. ***p<0.001; One-way ANOVA was followed by Bonferroni post-tests. (K) Confocal images of primary cortical neurons for detection of interaction between endogenous ankyrin-G and transfecting Flag-Usp9X1555-1958 Wt or S3D or S3A with PLA. Scale bar, 5 μm. Bar graph of PLA signal (n = 16 cells from each condition). *P = 0.011; One-way ANOVA followed by Bonferroni post-tests was performed. (L) Confocal images of primary cortical neurons for detection of interaction between HA-ankyrin-G and Flag-Usp9X1555-1958 Wt or S3D with PLA. Scale bar, 20 μm. Bar graph of PLA signal (Wt: n = 15, S3D: n = 16; **p = 0.005). Two-tailed unpaired t-test was performed. (M) In situ PLA-SIM images of dendritic regions in neurons from (I). The dendritic shapes were outlined by using BFP cell-fill as a guide. Scale bar, 5 μm. (N-Q) Quantification of ratio of spines, spine density and head area expressing HA-ankyrin-G and PLA signal (n= 13 neurons from each condition). **p = 0.002, ***p < 0.001; Two-tailed unpaired t-test was performed. All data are represented as mean ± SEM. See also Figure S4 and S5.
Figure 5.
Figure 5.
Impaired Usp9X function destabilizes ANKRD proteins. (A) Staining in the primary somatosensory cortex of 12-week old mouse brain; magnified layer II-III is zoomed in to cell level. Scale bar, 200 μm (left); 20 μm (middle); 5 μm (right). (B) The fraction of ankyrin-G or Usp9X-positive cells and quantification (n = 3) in each layer of the cortex. The graph is shown with mean values. (C) Protein levels of ankyrin-G and Usp9X in mouse cortex throughout lifespan. Representative Western blots in mouse cortex at various time periods (n = 3 for each group). (D) Levels of ANKRD and other synaptic proteins in cortex of 2- and 12-week old Usp9X+/Y or Usp9X−/Y mice. (E, F) Relative abundance of proteins in (D) (Usp9X+/Y, n = 4 and Usp9X−/Y, n = 3 in 2 weeks old; Usp9X+/Y, n = 4 and Usp9X−/Y, n = 4 in 12 weeks old). *p < 0.05; **p < 0.01; Two-tailed unpaired t-test was performed. (G) Enrichment of BD risk factors identified through GWAS (top left), de novo ASD/SZ risk factors (top right) and PSD proteins (bottom) among ANKRD proteins (n = 270); statistical significance is in red. (H) Diagram of neuropsychiatric risk genes encoding ANKRD proteins; underlined genes contain Ub-lysine sites within ANKRD. All data are represented as mean ± SEM. See also Figure S6.
Figure 6.
Figure 6.
Impaired Usp9X function alters cortical spine development. (A) Golgi-Cox staining of layer III pyramidal apical dendrites in 2- and 12-week old Usp9X+/Y and Usp9X−/Y mice. Scale bar, 5 μm. 20 dendrites were analyzed from 3 brains per each group. ***p < 0.001; Two-tailed unpaired t-test was performed. (B) Representative Western blots of co-immunoprecipitation experiments of ankyrin-G or GSK3β with α-Ubiquitin (α-Ub). Intensity of Western blot of immunoprecipitated ankyrin-G or GSK3β by α-Ub (Fig. 6B) was normalized by the expression levels of both proteins (Fig. 5D) (Usp9X+/Y, n = 4 and Usp9X−/Y, n = 3 in 2 weeks old; Usp9X+/Y, n = 4 and Usp9X−/Y, n = 4 in 12 weeks old). *p < 0.05; Two-tailed unpaired t-test was performed. IgG, control IgG; IP, immunoprecipitation; WB, Western blotting. (C, D) Immunofluorescence staining in layer III of the primary somatosensory cortex reveals ankyrin-G aggregates (intensity highlighted in reverse images). Scale bar, 10 μm. (E, F) Distribution of ankyrin-G particle sizes in (B) (n = 4 brains per each group). **p < 0.01; ***p < 0.001; Two-way ANOVA followed by Bonferroni post-tests. All data are represented as mean ± SEM. See also Figure S6 and S7.
Figure 7.
Figure 7.
Impaired Usp9X function alters behaviors, and occurs in neurodevelopmental disorder patients. (A) Open field test for 10 min. Usp9X+/Y, n = 26; Usp9X−/Y, n = 16. Two-tailed unpaired student’s t-test, t(40) = 5.696, ***p < 0.001. (B-C) Elevated plus maze test for 10 min. Time in open arm (B) and the number of entries in each arm (C) are shown by graphs. Usp9X+/Y, n = 16; Usp9X−/Y, n = 15. Two-tailed unpaired student’s t-test, t(29) = 2.365 for time in open arm; t(29) = 3.855 for the number of entries, *p < 0.05; ***p < 0.001. (D-E) Light/dark box test for 10 min. Time in light space (D) and the number of light chamber transitions are shown by graphs. Usp9X+/Y, n = 16; Usp9X−/Y, n = 15. Two-tailed unpaired student’s t-test, t(29) = 2.855 for time in light space; t(29) = 3.281 for the number of transitions, **p < 0.01. (F) Immobility was assessed in adult mice in the forced swim test for 4 min. Usp9X+/Y, n = 11; Usp9X−/Y, n = 8. Two-tailed unpaired student’s t-test, t(17) = 2.597, *p < 0.05. All data are represented as mean ± SEM. (G) Co-immunoprecipitation of HA-ankyrin-G1-807 with Flag-Usp9X1555-1958 WT, Q1573N, L1693W, G1890E or S3D from HEK293T cells. (H) Cleavage of a fluorogenic substrate by the peptidase domain of wild type, active site mutant His-Usp9X1547-1962 H1878A, and disease-associated USP9X mutants. (I) Homology modeling of human Usp9X. The catalytic pocket (red square) and “thumb” and “finger” domains are indicated. Human mutations were color coded and shown in inset boxes below, with van der Waals radii. Residues likely disrupted by steric hindrance are in blue. Dashed lines indicate predicted steric clash or alterations in hydrogen bonding. See also Figure S8.

References

    1. Akhurst RJ, and Hata A (2012). Targeting the TGF beta signalling pathway in disease. Nat Rev Drug Discov 11, 790–811. - PMC - PubMed
    1. Al-Hakim AK, Zagorska A, Chapman L, Deak M, Peggie M, and Alessi DR (2008). Control of AMPK-related kinases by USP9X and atypical Lys(29)/Lys(33)-linked polyubiquitin chains. Biochem J 411, 249–260. - PubMed
    1. Al-Khodor S, Price CT, Kalia A, and Abu Kwaik Y (2010). Functional diversity of ankyrin repeats in microbial proteins. Trends Microbiol 18, 132–139. - PMC - PubMed
    1. Amerik AY, and Hochstrasser M (2004). Mechanism and function of deubiquitinating enzymes. Bba-Mol Cell Res 1695, 189–207. - PubMed
    1. Bayes A, Collins MO, Croning MDR, van de Lagemaat LN, Choudhary JS, and Grant SGN (2012). Comparative Study of Human and Mouse Postsynaptic Proteomes Finds High Compositional Conservation and Abundance Differences for Key Synaptic Proteins. Plos One 7. - PMC - PubMed

Publication types

Substances

LinkOut - more resources