Review
. 2020 Mar;45(3):202-216.
doi: 10.1016/j.tibs.2019.09.001. Epub 2019 Dec 5.

Computational Dissection of Membrane Transport at a Microscopic Level

Affiliations
Review

Computational Dissection of Membrane Transport at a Microscopic Level

Tao Jiang et al. Trends Biochem Sci. 2020 Mar.

Abstract

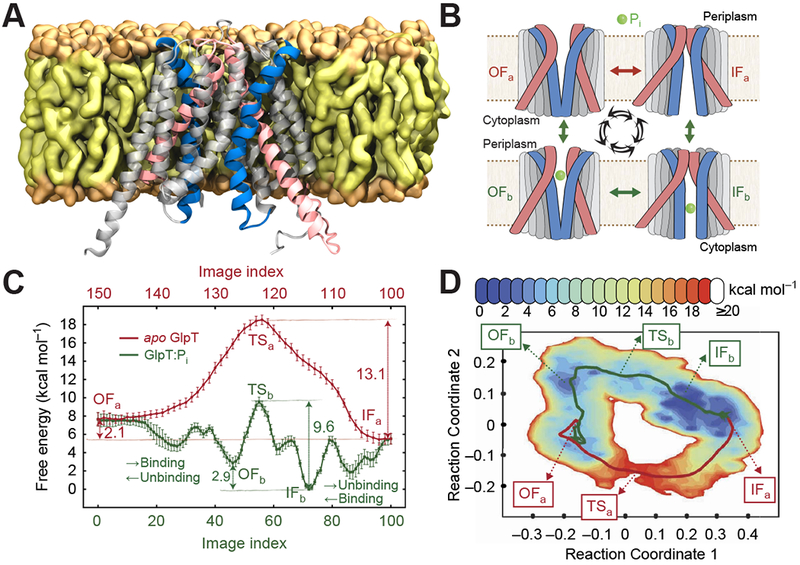
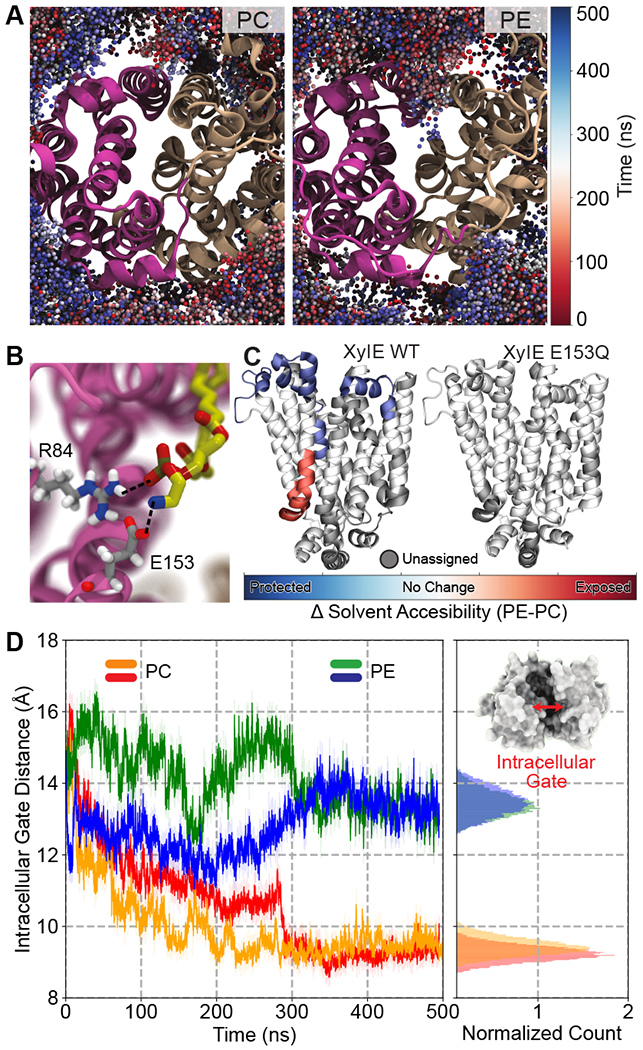
Membrane transporters are key gatekeeper proteins at cellular membranes that closely control the traffic of materials. Their function relies on structural rearrangements of varying degrees that facilitate substrate translocation across the membrane. Characterizing these functionally important molecular events at a microscopic level is key to our understanding of membrane transport, yet challenging to achieve experimentally. Recent advances in simulation technology and computing power have rendered molecular dynamics (MD) simulation a powerful biophysical tool to investigate a wide range of dynamical events spanning multiple spatial and temporal scales. Here, we review recent studies of diverse membrane transporters using computational methods, with an emphasis on highlighting the technical challenges, key lessons learned, and new opportunities to illuminate transporter structure and function.

Keywords: conformational change; drug target; free energy calculation; lipid–protein interaction; membrane transporter; molecular dynamics simulation.


Figures

Figure 1,
Figure 1,. Key figure. Major functional aspects of membrane transporters.
(A) Schematic representation of major conformational states visited by a membrane transporter during the alternating access mechanism (see Box 1) as it facilitates the substrate and/or ion transport. Protein is represented by a white cartoon while the membrane by a brown disc. Ions and substrate are represented by yellow circle and blue hexagon, respectively. (B) Local conformational changes. A typical monomer of fully-bound glutamate transporter (Glt) with scaffold domain shown in pink and transport domain in blue. HP1 and HP2 loops which control the accessibility of the substrate binding site and therefore involved in gating, are shown in green. In the fully bound state (with 3 bound Na+ and the substrate), the transporter remains closed throughout the 500 ns of MD simulations (starting snapshots of HP1 and HP2 are shown in grey). MD simulations of the partially bound state (with two bound Na+ ions) captures the opening of HP2 gate, thus highlighting the importance of substrate and third Na+ in locking the extracellular gate of the transporter. (C) Global structural transition. Crystal and cryo-EM structures of ABC-transporter Pgp in IF (left, PDB: 4M1M) and OF (right, PDB: 6C0V) states, respectively. Pgp is a heterodimer comprising of two pseudosymetric halves (shown in blue and pink surface representations, respectively) each containing a transmembrane domain (TMD) connected to a nucleotide-binding domain (NBD). Binding of ATP (shown in van der Waals) to the NBDs leads to their dimerization and transition of the transporter from the IF to the OF state. The arrows depict the binding of the substrate molecule to the lumen in the IF state and its release to the extracellular side in the OF state, respectively. (D) Lipid-protein interactions. Crystal structure of ABC transporter MsbA (left, PDB: 5TV4), an inner membrane lipid flippase, reveals a lipopolysaccharide (LPS) molecule bound deeply in the cavity, shedding light on the mechanism of MsbA-mediated LPS transport. The two monomers of the transporter are shown as blue and pink cartoon representations, respectively. The bound LPS is shown as sticks. Crystal structure of dopamine transporter (DAT) (right, PDB: 4M48), a neurotransmitter transporter, reveals a cholesterol molecule bound at the junction of TM5 (blue) and TM7 (pink). The protein is drawn in cartoon representation, whereas the cholesterol and the coordinating residues are shown as sticks. (E) Drug-transporter interactions. Interaction of serotonin transporter (SERT) with paroxetine (left, PDB: 5I6X) and ibogaine (right, PDB: 6DZZ) in its different functional states, respectively. The drugs wedge between scaffold (pink) and core helices (blue), potentially interfering with their structural transition during the transporter function. The bound drugs and the extracellular gating residues are highlighted as sticks. The blue curves indicate the exposure of the central binding pocket.
Figure 2.
Figure 2.. MD simulations applied to study the energetics of large scale structural transition in an explicit membrane/solvent environment.
(A) GlpT in an inward facing (IF) open conformation is represented as cartoon, embedded in an explicit lipid bilayer which is shown in surface representation. The helices involved in biasing the transition are shown as pink and blue cartoon. (B) Schematic representation of the states involved in the thermodynamic cycle studied (colored as in A). (C) Free energy profile along the thermodynamic cycle shown in (A), involving both apo (red) and bound (green) GlpT. The free energy along the transition pathway (discretized into 150 images/windows) was computed employing an umbrella sampling method. The free energy calculations identify all the intermediate states involved in the transport cycle and show that the apo transition is unfavorable while the transition of the phosphate-bound (Pi-bound) state is feasible. (D) Potential of mean force (PMF) projected along the two reaction coordinates, showing two distinct pathways in red and blue. The blue pathway is the lower free energy pathway explaining the energetics of allowed GlpT transition in the presence of the substrate Pi. The red pathway, on the other hand, is a higher free energy pathway that explains forbidden transition of GlpT in the absence of substrate. Adapted with permission from ref [42]. Copyright 2015 Moradi et al. Licensed under a Creative Commons Attribution 4.0 International License.
Figure 3.
Figure 3.. Lipid-protein interactions modulate the conformational dynamics of membrane transporters.
(A) Preferential interaction of PE lipids with IF XylE. Shown is the lipid headgroup sampling in PC (left) and PE (right). Spheres represent phosphorus atoms of PE/PC lipids and are color coded: red at t = 0 and blue at t = 500 ns. A significantly deeper penetration of PE lipids is discernable. (B) Zoomed in snapshot depicting specific interactions between a PE lipid headgroup and a salt bridge within the lumen of the protein, viewed from the intracellular side. No such interaction was observed for PC lipids, as they don’t visit this space. (C) Differential solvent accessibility in PE vs. PC lipid environment, for XylE wildtype and the E153Q mutant. Solvent accessibility, as measured by HDX-MS experiments, is mapped onto the structure depicted by the following color code: red (solvent exposed), blue (protected), white (no change) and grey (unassigned). (D) Time trace showing the intracellular gate distance over simulation time. PC simulation sets are colored orange and red, while the PE simulation sets are colored green and blue. Inset shows a representative snapshot of the protein viewed from the intracellular side highlighting the intracellular gate. Adapted with permission from ref [47]. Copyright 2018 Martens et al. Licensed under a Creative Commons Attribution 4.0 International License.
Figure I.
Figure I.
A schematic illustration of the conformational changes in alternating-access models. The transport can occur through rocker-switch (left), rocking-bundle (middle), or elevator-type (right) mechanisms, during which the transporter alternates between the OF (top) and IF (bottom) states. Each transporter is schematically represented as two domains (pink and blue) with stationary domains in shaded colors. Conformational transitions are shown as the changes in the relative angles between the domains and the water accessibility of the transporters.

References

    1. Mitchell P (1957) A general theory of membrane transport from studies of bacteria. Nature 180, 134–136 - PubMed
    1. Jardetzky O (1966) Simple allosteric model for membrane pumps. Nature 211, 969–970 - PubMed
    1. Drew D and Boudker O (2016) Shared molecular mechanisms of membrane transporters 35, 543–572 - PubMed
    1. Henderson RK et al. (2019) Coupling efficiency of secondary active transporters 58, 62–71 - PubMed
    1. Locher KP (2016) Mechanistic diversity in ATP-binding cassette (ABC) transporters 23, 487–493 - PubMed

Publication types

MeSH terms

Substances

LinkOut - more resources