. 2020 Jan 7;31(1):131-147.e11.
doi: 10.1016/j.cmet.2019.11.003. Epub 2019 Dec 5.

Disruption of Acetyl-Lysine Turnover in Muscle Mitochondria Promotes Insulin Resistance and Redox Stress without Overt Respiratory Dysfunction

Affiliations

Disruption of Acetyl-Lysine Turnover in Muscle Mitochondria Promotes Insulin Resistance and Redox Stress without Overt Respiratory Dysfunction

Ashley S Williams et al. Cell Metab. .

Abstract

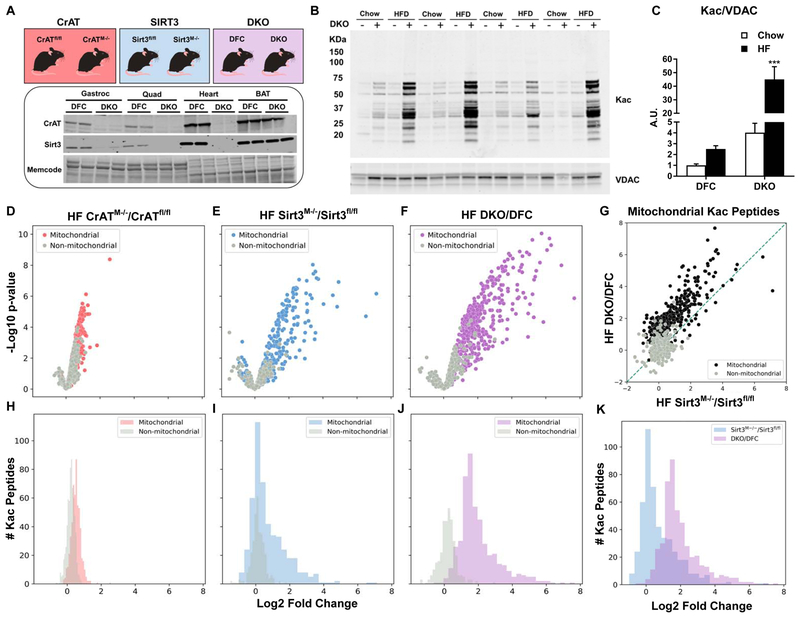
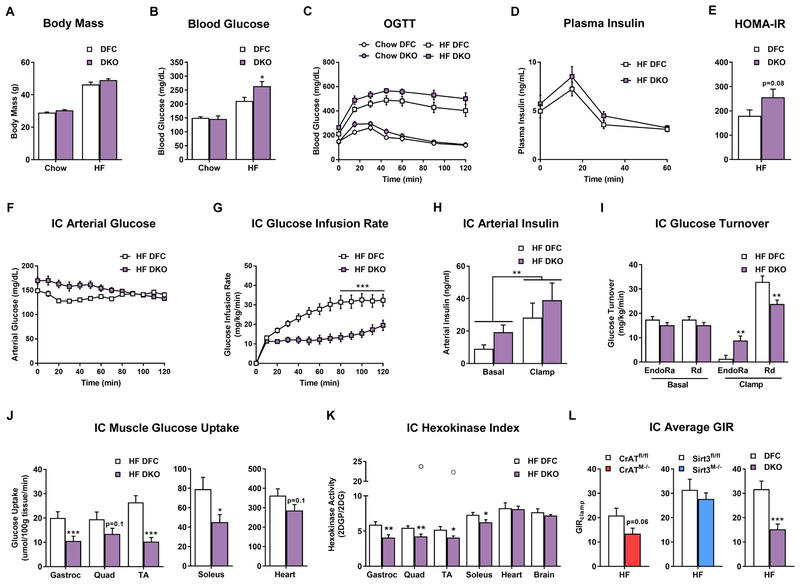
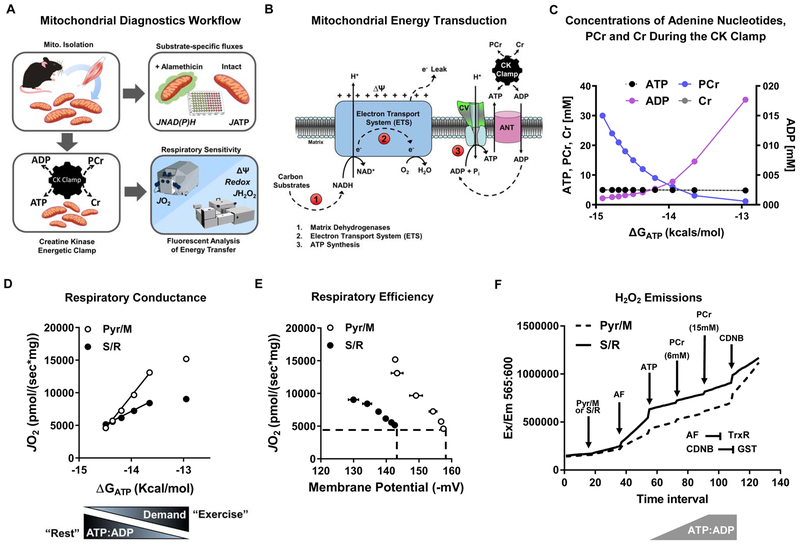
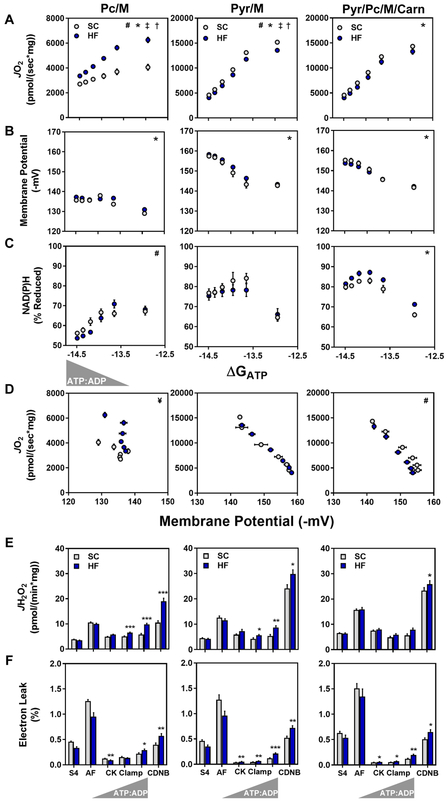
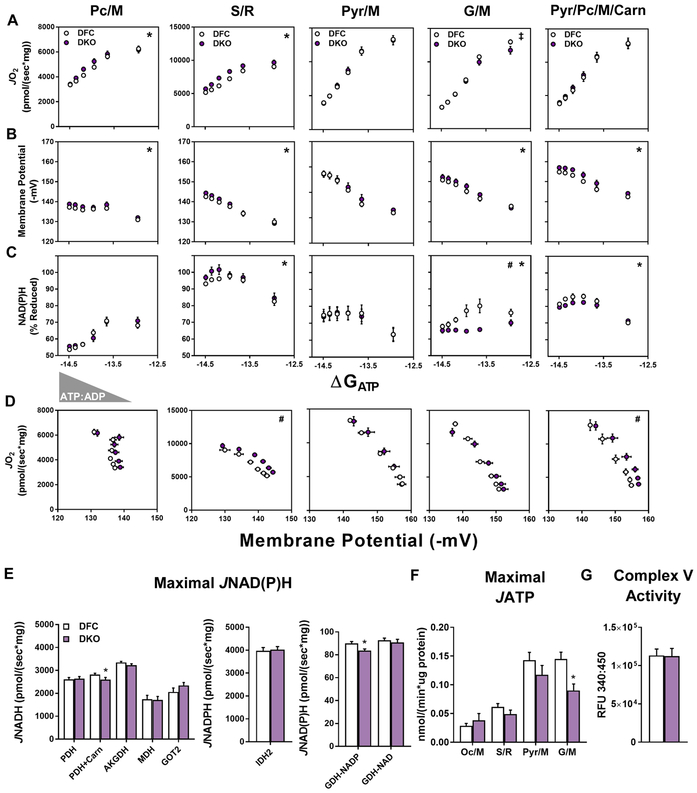
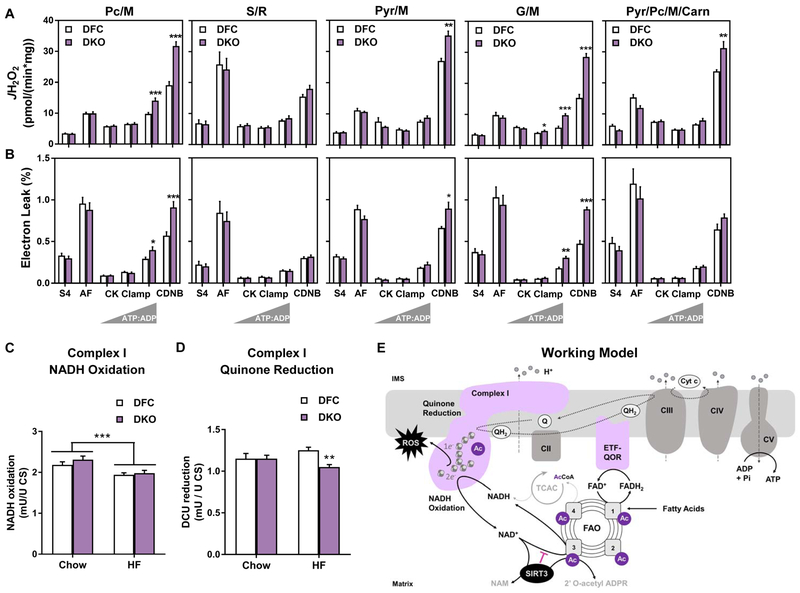
This study sought to examine the functional significance of mitochondrial protein acetylation using a double knockout (DKO) mouse model harboring muscle-specific deficits in acetyl-CoA buffering and lysine deacetylation, due to genetic ablation of carnitine acetyltransferase and Sirtuin 3, respectively. DKO mice are highly susceptible to extreme hyperacetylation of the mitochondrial proteome and develop a more severe form of diet-induced insulin resistance than either single KO mouse line. However, the functional phenotype of hyperacetylated DKO mitochondria is largely normal. Of the >120 measures of respiratory function assayed, the most consistently observed traits of a markedly heightened acetyl-lysine landscape are enhanced oxygen flux in the context of fatty acid fuel and elevated rates of electron leak. In sum, the findings challenge the notion that lysine acetylation causes broad-ranging damage to mitochondrial quality and performance and raise the possibility that acetyl-lysine turnover, rather than acetyl-lysine stoichiometry, modulates redox balance and carbon flux.

Keywords: NAD biology; bioenergetics; diabetes; fat oxidation; fatty acid oxidation; insulin action; lysine acetylation; mitochondria; muscle; nutrition; obesity; proteomics; reactive oxygen species; redox; respiration; sirtuins.


Conflict of interest statement

Declaration of Interests

There are no competing interests.

Figures

Figure 1.
Figure 1.. Combined deficiency of CrAT and Sirt3 leads to dramatic increases in the mitochondrial acetylproteome.
(A) Mouse models of CrAT and/or Sirt3 deficiency. Tissue-specific knockout of protein abundance in skeletal muscle and heart, with no effect on brown adipose tissue (BAT). Memcode staining was used to visualize and quantify protein loading. (B) Acetyl-lysine (Kac) western blot performed using lysates prepared from skeletal muscle mitochondria. (C) Quantification of Kac abundance normalized to VDAC expression. (DF) Volcano plot depicting relative occupancy (Log2 fold change on x-axis) vs. statistical significance (−log p value on y-axis) of acetyl-peptides identified in quadriceps tissue from: (D) CrATfl/fl and CrATM−/− mice, (E) Sirt3fl/fl and Sirt3M−/− mice, and (F) Double Knockout (DKO) CrAT/Sirt3M−/− and double floxed controls (DFC) CrATfl/fl/Sirt3fl/fl. Colored and grey dots indicate peptides matched to mitochondrial or non-mitochondrial proteins, respectively. (G) Correlation of relative occupancy of specific acetyl-peptides in DKO/DFC compared to Sirt3M−/−/Sirt3fl/fl. (HJ) Histograms comparing the distribution of relative occupancy of mitochondrial and non-mitochondrial acetyl-peptides identified in muscle tissues from (H) CrATfl/fl versus CrATM−/− mice (I) Sirt3fl/fl versus Sirt3M−/− mice, and (J) DKO versus DFC mice. (K) Histogram comparing the distribution of relative changes in mitochondrial acetyl-peptide abundance measured in DKO/DFC versus Sirt3M−/−/Sirt3fl/fl. Data represent mean ±SEM. (A) N=2 per group. (BC) N=4 per group. (C) data were analyzed by two-way ANOVA. *** represents a significant difference between DKO chow and DKO HF after Tukey post-hoc testing. (DK) N=3–5 per group. The control (fl/fl) groups had N=5 for plex#1 and N=4 for plex#2. N=3 was used for the CrATM−/−, Sirt3M−/− and DKO groups. A scheme representing the acetylproteomics workflow is depicted in Supplemental Figure 1D and 1E. ***P≤0.001. N represents biological replicates.
Figure 2.
Figure 2.. Combined deficiency of CrAT and Sirt3 exacerbates diet-induced perturbations in glucose homeostasis and muscle insulin action.
(A) Body mass prior to oral glucose tolerance test. (B) 5 h fasting blood glucose. (C) Oral glucose tolerance. (D) Plasma insulin during the oral glucose tolerance test. (E) HOMA-IR calculated with values from the 15 min time point. (F) Arterial glucose levels during the insulin clamp (IC). (G) IC glucose infusion rate. (H) Plasma arterial insulin levels during the IC. (I) IC glucose turnover. (J) Muscle glucose uptake during the IC. (K) IC muscle hexokinase index. (L) Average glucose infusion rate (GIR) during the IC steady state for each genotype compared to littermate controls. Data represent mean ±SEM. (AE) N=7–9 per group. (B) Data were analyzed by two-way ANOVA and * represents a significant difference between HF DFC and HF DKO after Tukey post-hoc testing. (FK) N=10 per group. (H) Data were analyzed by two-way ANOVA. ** represents a main effect of insulin on arterial insulin levels. (L) N=7–13 per group, data shown in (CG and IL) were analyzed by Student’s t-test. *P≤0.05, **P≤0.01, ***P≤0.001. Outliers are represented as open grey circles. N represents biological replicates.
Figure 3.
Figure 3.. Hyperacetylation of mitochondrial proteins is accompanied by increased oxidation of long-chain fatty acid fuel in permeabilized myofibers.
Mitochondrial oxygen consumption (JO2) was assayed in permeabilized fiber bundles from red gastrocnemius muscle from mice fed standard chow (A, C, and E) or a high fat diet (B, D, and F). Glutamate/Malate promotes electron flux through complex I, whereas succinate engages complex II. (G) Scheme depicting 13C-glucose labeling strategy and 13C metabolic flux analysis (MFA) in soleus muscles from DKO and DFC mice fed standard chow. Muscles were incubated with 10 mM [U-13C]glucose + 200 uM palmitate ±100 nM insulin. The citrate labeling pattern provides information on the relative contribution of pyruvate to the acetyl-CoA pool via PDH flux as compared to alternative routes of entry into the tricarboxylic acid cycle (TCAC). When [U-13C]pyruvate enters into the TCAC solely via PDH, the first condensation reaction produces M+2 citrate. By contrast, entry of [U-13C]pyruvate via malic enzyme (ME) or pyruvate carboxylase (PC) results in M+3 malate/oxaloacetate (OAA), which then forms M+3 or M+5 citrate upon condensation with unlabeled or M+2 acetyl-CoA, respectively. After the first spin of the TCAC, malate will be labeled M+2 from PDH flux or M+4 from combined PDH+ME/PC flux (see left text box*). Subsequent turns of the TCAC can produce more highly enriched citrate isotopomers (e.g. M+4, M+6). (H) Average percent 13C enrichment in TCAC metabolites after incubation with [U-13C]glucose without insulin. (I) Average percent 13C enrichment in TCAC metabolites after incubation with [U-13C]glucose plus 100 nM insulin. (J) Citrate mass isotopomer data (MID) from soleus muscles incubated with insulin. (K) The citrate M+5 to aspartate M+3 ratio provides insight into the enrichment of the acetyl-CoA pool because M+5 citrate is produced when M+3 OAA condenses with M+2 acetyl-CoA (see G). Aspartate M+3 was similar between genotypes and was used as a proxy for OAA M+3. Ratios were estimated by normalizing MID to the sum of the labeled isotopomers. Data represent mean ±SEM. (AF) N=10–13 per group. (HK) N=8 per group, and were analyzed by Student’s t-test. *P≤0.05, **P≤0.01, ***P≤0.001. N represents biological replicates.
Figure 4.
Figure 4.. Comprehensive mitochondrial diagnostics using the CK energetic clamp.
(A) Mitochondria isolated from skeletal muscle were used intact for measuring rates of ATP synthesis (JATP); or permeabilized with alamethecin for assaying rates of NADH and NADPH (JNAD(P)H) generation by mitochondrial dehydrogenases in a 96-well format. Complex V activity was assessed in mitochondrial lysates. Rates of oxygen consumption (JO2) and respiratory sensitivity were evaluated using the Oroboros-O2K system paired with the creatine kinase (CK) energetic clamp technique and a buffer containing 20 U/mL CK, 5 mM creatine, and 1.5 – 30 mM phosphocreatine (PCr). Parallel measurements of membrane potential (ΔΨ), redox potential (NAD(P)H/NAD(P)+), and JH2O2 emissions were obtained via spectrofluorometric assays using a QuantaMaster Spectrofluorometer. (B) Mitochondrial energy transduction consists of three main regulatory nodes: 1) matrix dehydrogenases (DH), 2) electron transport system (ETS), and 3) ATP synthesis and transport. (C) Concentrations of Cr, PCr, ATP and ADP during the CK clamp, which is used to titrate the extra-mitochondrial ATP:ADP and permit assessment of respiratory control over a range of ATP free energy states, expressed as kcals/mol. (D) Respiratory conductance (slope of JO2 vs. ΔGATP) of skeletal muscle mitochondria measured in the presence of pyruvate/malate (Pyr/M) compared to succinate/rotenone (S/R). A steeper slope indicates greater sensitivity and improved kinetics. Pyr/M activates the pyruvate DH complex and promotes electron flux through complex I of the ETS. The combination of succinate and rotenone (S/R) promotes electron flux through complex II while inhibiting complex I, which decreases respiratory conductance due to diminished ΔΨ. (E) Respiratory efficiency plot (JO2 vs. ΔΨ). The leftward shift of the S/R plot shows that mitochondria are maintaining a less polarized ΔΨ for any given rate of oxygen consumption (JO2), indicative of diminished respiratory efficiency or a lower P:O ratio. (F) Representative trace of H2O2 emissions (JH2O2) from skeletal muscle mitochondria fueled by PyrM or S/R measured under state 4 conditions, followed by sequential additions of auranofin (AF; thioredoxin (TRX) reductase inhibitor), ATP and phosphocreatine (PCr) to execute the CK clamp, and then CDNB to deplete glutathione (GSH). Disruption of the TRX and GSH matrix scavenging systems permits an estimation of absolute H2O2 production rates.
Figure 5.
Figure 5.. Chronic high fat feeding alters respiratory kinetics and thermodynamics.
Mitochondria were isolated from skeletal muscle of mice fed standard chow (SC) or a 20-week high fat (HF) diet. (AC) Relationship between (A) JO2, (B) ΔΨ and (C) NAD(P)H/NAD(P)+ redox state versus Gibb’s Energy of ATP hydrolysis (ΔGATP) measured in mitochondria fueled by palmitoylcarnitine+malate (Pc/M), pyruvate+malate (Pyr/M), or Pyr/M+Pc+free carnitine (Carn). (D) Mitochondrial respiratory efficiency represented as JO2 plotted against ΔΨ. (E) Mitochondrial H2O2 emissions (JH2O2). (F) Mitochondrial electron leak, expressed as a percentage of oxygen flux (JH2O2/JO2 x 100 = % Electron Leak). Right triangles represent increasing concentrations of ATP relative to ADP (ATP:ADP) during the CK clamp, resulting in reciprocal changes in energy demand and thus JO2. Data represent mean ± SEM. (AF) N=6–10 per group. (AC) Measurements made at submaximal JO2 were analyzed by a two-way ANOVA (* main effect of diet, # diet:ΔGATP interaction, P< 0.05). Maximal JO2 (ΔGATP =−12.95) was analyzed by t-test (‡ P<0.05). (D) Mitochondrial respiratory efficiency was analyzed by ANCOVA using submaximal data to determine whether slopes and intercepts differed as a result of diet (# diet:ΔΨ interaction, P< 0.05, and ¥ indicates these data could not be fit via linear regression). Data in (E and F) were analyzed by Student’s t-test *P≤0.05, **P≤0.01, ***P≤0.001. N represents biological replicates.
Figure 6.
Figure 6.. The DKO model reveals a paradoxical disconnect between mitochondrial Kac and respiratory dysfunction.
Mitochondria were isolated from skeletal muscles of DFC and DKO mice fed a high fat (HF) diet. (AC) Relationship between (A) JO2, (B) ΔΨ and (C) NAD(P)H/NAD(P)+ redox state versus Gibb’s Energy of ATP hydrolysis (ΔGATP) measured in mitochondria fueled by palmitoylcarnitine+malate (Pc/M), succinate/rotenone (S/R), pyruvate+malate (Pyr/M), glutamate+malate (G/M), or Pyr/M+Pc+free carnitine (Carn). (D) Mitochondrial respiratory efficiency represented as JO2 plotted against ΔΨ. (E) Rates of maximal mitochondrial dehydrogenase enzyme flux shown as NADH or NADPH production (JNADH or JNADPH) measured in alamethecin permeabilized mitochondria. (F) Maximal ATP efflux (JATP) in intact mitochondria fueled by octanoylcarnitine+malate (Oc/M), S/R, Pyr/M, or G/M. (G) Complex V activity in mitochondrial lysates. Right triangles represent increasing concentrations of ATP relative to ADP (ATP:ADP) during the CK clamp, resulting in reciprocal changes in energy demand and thus JO2. Data represent mean ± SEM. (AF) N=5–10 per group. (AC) Measurements made at submaximal JO2 were analyzed by a two-way ANOVA (* main effect of genotype, # genotype:ΔGATP interaction, P< 0.05). Maximal JO2 (ΔGATP =−12.95) was analyzed by T-test (‡ P<0.05). (D) Mitochondrial respiratory efficiency was analyzed by ANCOVA using submaximal data to determine whether slopes and intercepts differed as a result of diet (# diet:ΔΨ interaction, P< 0.05). Data in (EG) were analyzed by Student’s t-test *P≤0.05, **P≤0.01, ***P≤0.001. N represents biological replicates.
Figure 7.
Figure 7.. Disruption of acetyl-lysine turnover in DKO mitochondria exacerbates diet-induced mitochondrial H2O2 emissions and electron leak under physiologically relevant energetic conditions.
Mitochondria were isolated from skeletal muscles of DFC and DKO mice fed a high fat (HF) diet. (A) H2O2 emissions (JH2O2) and (B) electron leak, expressed as a percentage of oxygen flux (JH2O2/JO2 x 100 = % Electron Leak) were measured in mitochondria fueled by palmitoylcarnitine+malate (Pc/M), succinate/rotenone (S/R), pyruvate+malate (Pyr/M), glutamate/malate (G/M), or Pyr/M+Pc+free carnitine (Carn). Right triangles represent increasing concentrations of ATP relative to ADP (ATP:ADP) during the CK clamp, resulting in reciprocal changes in energy demand and thus JO2. Data represent mean ±SEM. Muscle lysates were used to assay (C) Complex I NADH oxidation and (D) Complex I quinone reduction. (E) Working model. Sirt3 consumes NAD regenerated by Complex I, which raises the local NADH/NAD+ redox charge and thereby inhibits the penultimate step in fatty acid oxidation (FAO). In DKO mice fed a high fat (HF) diet, Complex I is hyperacetylated at K42 of the NDUSF3 subunit, possibly perturbing electron transfer and/or Q reductase activity. The combination of disinhibited FAO and altered redox control promotes electron leak and production of reactive oxygen species (ROS). (A and B) N=5–10 per group, analyzed by Student’s t-test. *P≤0.05, **P≤0.01, ***P≤0.001. (C) N= 8 per group, (D) N=13 per group, data shown in (C and D) were analyzed by Two-way ANOVA with Tukey post-hoc testing, in (C) *** represents a main effect of diet. (D) ** represents a difference between DFC and DKO after Two-way ANOVA with Tukey post-hoc testing. N represents biological replicates.

References

    1. Anderson EJ, Lustig ME, Boyle KE, Woodlief TL, Kane DA, Lin CT, Price JW 3rd, Kang L, Rabinovitch PS, Szeto HH, et al. (2009). Mitochondrial H2O2 emission and cellular redox state link excess fat intake to insulin resistance in both rodents and humans. J. Clin. Invest 119, 573–581. - PMC - PubMed
    1. Ayala JE, Bracy DP, Julien BM, Rottman JN, Fueger PT, and Wasserman DH (2007). Chronic treatment with sildenafil improves energy balance and insulin action in high fat-fed conscious mice. Diabetes 56, 1025–1033. - PubMed
    1. Ayala JE, Bracy DP, McGuinness OP, and Wasserman DH (2006). Considerations in the design of hyperinsulinemic-euglycemic clamps in the conscious mouse. Diabetes 55, 390–397. - PubMed
    1. Barrientos A (2002). In vivo and in organello assessment of OXPHOS activities. Methods 26, 307–316. - PubMed
    1. Beenakkers AM, and Klingenberg M (1964). Carnitine-Coenzyme a Transacetylase in Mitochondria from Various Organs. Biochim. Biophys. Acta 84, 205–207. - PubMed

Publication types

MeSH terms