Clinical Trial
. 2020 Jan 7;31(1):92-104.e5.
doi: 10.1016/j.cmet.2019.11.004. Epub 2019 Dec 5.

Ten-Hour Time-Restricted Eating Reduces Weight, Blood Pressure, and Atherogenic Lipids in Patients with Metabolic Syndrome

Affiliations
Clinical Trial

Ten-Hour Time-Restricted Eating Reduces Weight, Blood Pressure, and Atherogenic Lipids in Patients with Metabolic Syndrome

Michael J Wilkinson et al. Cell Metab. .

Abstract

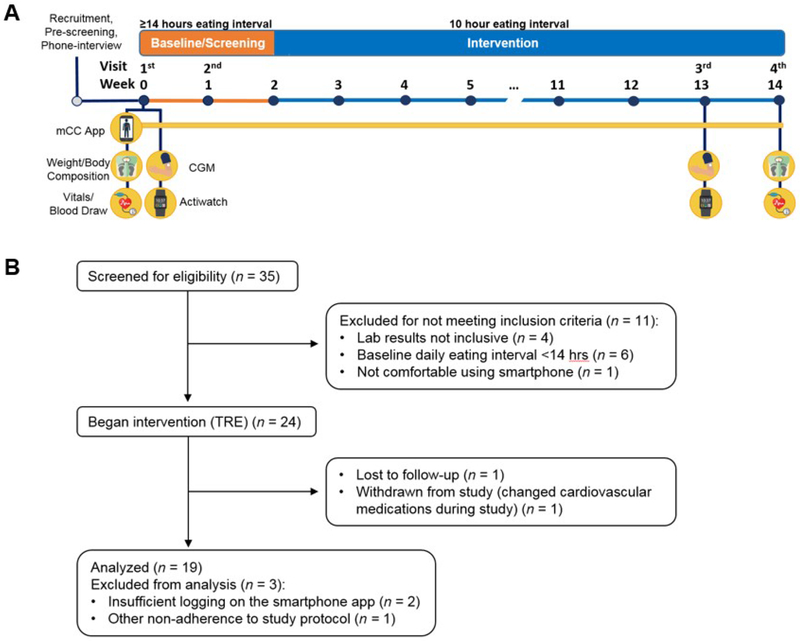
In animal models, time-restricted feeding (TRF) can prevent and reverse aspects of metabolic diseases. Time-restricted eating (TRE) in human pilot studies reduces the risks of metabolic diseases in otherwise healthy individuals. However, patients with diagnosed metabolic syndrome often undergo pharmacotherapy, and it has never been tested whether TRE can act synergistically with pharmacotherapy in animal models or humans. In a single-arm, paired-sample trial, 19 participants with metabolic syndrome and a baseline mean daily eating window of ≥14 h, the majority of whom were on a statin and/or antihypertensive therapy, underwent 10 h of TRE (all dietary intake within a consistent self-selected 10 h window) for 12 weeks. We found this TRE intervention improves cardiometabolic health for patients with metabolic syndrome receiving standard medical care including high rates of statin and anti-hypertensive use. TRE is a potentially powerful lifestyle intervention that can be added to standard medical practice to treat metabolic syndrome. VIDEO ABSTRACT.

Keywords: TRE; TRF; circadian rhythm; dyslipidemia; hypertension; impaired glucose tolerance; metabolic syndrome; obesity; time-restricted eating.


Conflict of interest statement

Declaration of Interests

All authors have no disclosures related to this manuscript. Pam R. Taub is a consultant for Sanofi/Regeneron, Novo-Nordisk, Boehringer-Ingleheim, Janssen, Pfizer, and Amgen. She is a stockholder of Cardero Therapeutics. S. Panda is the author of “The Circadian Code” for which he collects a nominal author royalty.

Figures

Figure 1.
Figure 1.. Study Design and CONSORT flow diagram.
(A) Study design. Prior to baseline, participants were screened with a phone interview. At the first visit (day 1), questionnaires, vitals, and blood were collected. Participants also had the CGM applied, were given an actiwatch, and were trained how to use the myCircadianClock (mCC) app. Week 0-1: Participants wore the CGM and actiwatch, and logged all food and beverages on the mCC app. mCC data were used to screen participants for a ≥ 14 h eating interval. At visit 2 (~day 7) the CGM was removed and the actiwatch was returned. At the end of week 2, if participants qualified for the study, they were instructed to select a 10 h eating window and start their 12-week time-restricted eating intervention. The mCC app was used throughout intervention to log food and beverage intake and sleep. 7-10 days before the end of intervention, participants came for the 3rd visit and had another CGM applied and were provided an actiwatch. At visit 4, the CGM was removed, the actiwatch was returned, and all assays taken at baseline were repeated. CGM, continuous glucose monitor. mCC, myCircadianClock smartphone app. (B) CONSORT flow diagram describing the process of patient enrollment, intervention, and data analysis. TRE, time-restricted eating.
Figure 2.
Figure 2.. Variance in time of first and last calorie and sleep and wake times decreases in TRE intervention.
For all panels, baseline data is in orange, and intervention in blue. Y-axis: each orange/blue combination represents an individual participant. For the left and middle panels, X-axis: clock hour for eating event (4=4AM, 24=midnight). Left Panel: All food and beverage events from two weeks of baseline and the last two weeks of TRE intervention for each participant. Data from each two-week interval was randomly sampled to have the same number of entries at baseline and end of intervention. Middle Panel: Mean and standard deviation for first calorie (●), last calorie (■), wake (▲), and sleep onset (▼) at baseline and intervention. First and last calorie data was only used for days that logging adherence was met. Right Panel: Mean time (in h) between wake and first calorie (left) and last calorie and sleep onset (right) at baseline and intervention. Data were analyzed for each day that the watch was worn and logging adherence was achieved, and then averaged. Note: missing data for participant 9 (eating times at baseline) and participant 3 (sleep times at intervention).
Figure 3.
Figure 3.. TRE intervention improves restfulness and body composition and significantly reduces weight, blood pressure, and atherogenic lipids.
(A) Mean daily caloric intake, sleep parameters, and activity counts at baseline (orange) and end of 12-weeks of time-restricted eating (TRE) intervention (blue). (B) Weight and body composition end-points, (C) blood pressure, lipid, and glucose end-points. Box plot with whiskers displaying 5-95% interval and outliers. *p<0.05, **p<0.01, ***p<0.001. PSQI, Pittsburgh Sleep Quality Index. BMI, body mass index, HDL-C, high-density lipoprotein cholesterol, LDL-C, low-density lipoprotein cholesterol, LDL-p, low-density lipoprotein particle number, CGM, continuous glucose monitor, HbA1c, hemoglobin A1c.
Figure 4.
Figure 4.. Changes in glucose levels between baseline and end of intervention.
(A) Summary of 8 days of CGM data baseline (orange) and at the end of 12-weeks of TRE intervention (blue) for a participant with type 2 diabetes mellitus. Solid lines represent the median glucose, the shaded area is 25-75% interval, and the lightly shaded area is 10-90% interval. Vertical dotted lines represent the 95% eating interval at baseline and intervention. The eating window goal during intervention was 8 am to 6 pm. This participant had baseline fasting glucose of 167 mg/dL and post-TRE fasting glucose of 116 mg/dL. Baseline fasting and continuous mean glucose data were higher than other participants, and thus this is not representative of all participants, but rather shows the large change observed in an individual with type 2 diabetes mellitus. (B) Distribution of glucose assessed by CGM for 16 of the 19 participants. Three participants are not included because they did not have at least 4 days of CGM data at either time point. Summary of 8 days of CGM data at baseline (orange) and end of TRE intervention (blue) for each participant.

Comment in

References

    1. Ackermann RT, Liss DT, Finch EA, Schmidt KK, Hays LM, Marrero DG, and Saha C (2015). A Randomized Comparative Effectiveness Trial for Preventing Type 2 Diabetes. Am J Public Health 105, 2328–2334. - PMC - PubMed
    1. Alberti KG, Eckel RH, Grundy SM, Zimmet PZ, Cleeman JI, Donato KA, Fruchart JC, James WP, Loria CM, and Smith SC Jr. (2009). Harmonizing the metabolic syndrome: a joint interim statement of the International Diabetes Federation Task Force on Epidemiology and Prevention; National Heart, Lung, and Blood Institute; American Heart Association; World Heart Federation; International Atherosclerosis Society; and International Association for the Study of Obesity. Circulation 120, 1640–1645. - PubMed
    1. Antoni R, Robertson TM, Robertson MD, and Johnston JD (2018). A pilot feasibility study exploring the effects of a moderate time-restricted feeding intervention on energy intake, adiposity and metabolic physiology in free-living human subjects. Journal of Nutritional Science 7.
    1. Asher G, and Sassone-Corsi P (2015). Time for food: the intimate interplay between nutrition, metabolism, and the circadian clock. Cell 161, 84–92. - PubMed
    1. Bailey T, Bode BW, Christiansen MP, Klaff LJ, and Alva S (2015). The Performance and Usability of a Factory-Calibrated Flash Glucose Monitoring System. Diabetes Technol Ther 17, 787–794. - PMC - PubMed

Publication types

MeSH terms