. 2020 Feb 4;31(2):284-300.e7.
doi: 10.1016/j.cmet.2019.11.002. Epub 2019 Dec 5.

Regulation of Tumor Initiation by the Mitochondrial Pyruvate Carrier

Affiliations

Regulation of Tumor Initiation by the Mitochondrial Pyruvate Carrier

Claire L Bensard et al. Cell Metab. .

Abstract

Although metabolic adaptations have been demonstrated to be essential for tumor cell proliferation, the metabolic underpinnings of tumor initiation are poorly understood. We found that the earliest stages of colorectal cancer (CRC) initiation are marked by a glycolytic metabolic signature, including downregulation of the mitochondrial pyruvate carrier (MPC), which couples glycolysis and glucose oxidation through mitochondrial pyruvate import. Genetic studies in Drosophila suggest that this downregulation is required because hyperplasia caused by loss of the Apc or Notch tumor suppressors in intestinal stem cells can be completely blocked by MPC overexpression. Moreover, in two distinct CRC mouse models, loss of Mpc1 prior to a tumorigenic stimulus doubled the frequency of adenoma formation and produced higher grade tumors. MPC loss was associated with a glycolytic metabolic phenotype and increased expression of stem cell markers. These data suggest that changes in cellular pyruvate metabolism are necessary and sufficient to promote cancer initiation.

Keywords: cancer metabolism; carbohydrate metabolism; colon cancer; mitochondria; pyruvate metabolism; stem cell metabolism; tumor initiation.


Conflict of interest statement

Declaration of Interests The University of Utah has filed a patent related to the mitochondrial pyruvate carrier, of which J.R. and C.S.T. are listed as co-inventors. All other authors declare no competing interests.

Figures
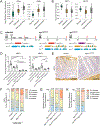
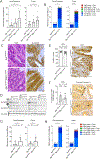
Figure 1:
Figure 1:. Decreased MPC expression is a feature of and predisposes for tumor initiation.
(A-B) Normalized log2 expression levels of LDHA, LDHB (A), Mpc1 and Mpc2 (B) mRNA relative abundance in human colon normal tissue (green), adenomas (orange), and adenocarcinomas (grey) from dataset GSE20916 (n=24–45 per group), ****FDR≤0.0001;***FDR≤0.001, FDR-corrected Wilcoxon rank-sums test, error bars SD. See also Figure S1A–D, Berg 2019. (C) 8 to 12 week-old transgenic mice were injected intraperitoneally three consecutive days with tamoxifen (TAM;20mg/day), then 30 days later, injected with azoxymethane (AOM; 10mg/mL/kg body weight). One week post-AOM, mice began three cycles of five days on 2% dextran sodium sulfate (DSS) in the drinking water, sixteen days on fresh drinking water. Tumor burden was assessed at 49 and 100 days post-AOM (red arrows). Schematics of the Mpc1flox and Lrig1-CreERT2 alleles are shown. 8 to 12 week-old transgenic mice were injected intraperitoneally three consecutive days with tamoxifen (TAM; 20mg/day), then examined at 30, 60, or 90 days post-TAM (red arrows). Schematics of the Mpc1flox, Apcflox, and Lrig1-CreERT2 alleles are shown. 8 to 12 week-old transgenic mice were injected intraperitoneally three consecutive days with tamoxifen (TAM; 20mg/day), then examined at 60, 90, or 140 days post-TAM (red arrows). Schematics of the Mpc1flox, Apcflox, and Villin-CreERT2 alleles are shown. 8 to 12 week-old transgenic mice were injected intraperitoneally three consecutive days with tamoxifen (TAM; 20μg/day), then examined at 60, 90, or 140 days post-TAM (red arrows). (D) Normalized RNA counts for Mpc1 (left) and Mpc2 (right) of isolated adjacent normal colon crypts and adenomas from the two main tumor models, both control and ApcLrig1KO/+ crypts and adenomas, then Mpc1Lrig1lKO and ApcLrig1KO/+Mpc1Lrig1KO crypts and adenomas (normal crypts n=10–17, adenomas n=16–32), ****p≤0.0001, one-way ANOVA with multiple comparisons, error bars SD. (E) Anti-MPC1 staining of colon sections at 60 days post-TAM (40X, scale bars = 100μm). (F) At 100 days post-AOM, tumor burden (bins of lesion number per mouse) were assessed in Mpc1Lrig1KO and control mice (n=28–45 mice). (G) At 90 days post-TAM tumor burden (bins of lesion number per mouse) were assessed in ApcLrig1KO/+Mpc1Lrig1KO and ApcLrig1KO/+ mice (n=11–12). (H) At 140 days post-TAM, tumor penetrance (having one or more lesions per mouse) and burden (bins of lesion number per mouse) were assessed in ApcVillKO/+Mpc1VillKO and ApcVillKO/+mice (n=18–28).
Figure 2:
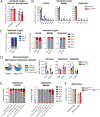
Figure 2:. Loss of Mpc1 accelerates tumor initiation and dysplastic progression in the environmental tumor model.
(A) Macroscopic tumor burden was assessed in Mpc1Lrig1KO, Mpc1Lrig1KO/+, and control mice at 100 days post-AOM (n=28–45 mice), ****p≤0.0001, ***p≤0.001, one-way ANOVA with multiple comparisons. Representative gross colon tumor burden and distribution are shown (ruler tick = 1mm). (B) At 100 days post-AOM, microscopic tumor grade and size assessed by pathologic grading in colons of Mpc1Lrig1KO, Mpc1Lrig1KO/+, and control mice (n=10–12), n.s.=not significant, *p≤0.05, one-way ANOVA with multiple comparisons on number of microscopic tumors per mouse. (C) Hematoxylin/Eosin and anti-β-catenin staining of control and Mpc1Lrig1KO adenomas at 100 days post-AOM, (100X, scale bars = 25μm). Black arrows indicate nuclear β-catenin. Green dashed circles indicate crypt necrosis. (D) Immunoblot of paired normal crypts (“C”) and tumor (“T”) samples from two control mice and two Mpc1Lrig1KO mice for MPC1, MPC2, and actin. Densitometry for MPC1 and MPC2, normalized to actin is shown with relative values adjusted to 100 for each control mouse normal crypt sample. (E) 100 days post-AOM, Ki67-positive nuclei as a percentage of total adenoma nuclei of Mpc1Lrig1KO and control adenomas were quantified on blinded high magnification images (n =5–7 mice, adenomas=10–20), **p≤0.01, unpaired two-tailed t-test. Representative images to the right (100X, scale bars=25μm). (F) 100 days post-AOM, cleaved caspase 3-positive nuclei of ApcLrig1KO/+Mpc1Lrig1KO and ApcLrig1KO/+ adenomas (black arrows) were quantified on blinded high magnification images (n =5–7 mice, adenomas=13–15, 100X, scale bars=25 μm), n.s.=not significant, unpaired two-tailed t-test. Green dashed circle indicates crypt necrosis and these positive nuclei were omitted. (G) At 49 days post-AOM, regions of superficial inflammation, epithelial injury with active inflammation (AI), aberrant foci, and low-grade dysplasia assessed by pathologic grading in colons of Mpc1Lrig1KO/+, Mpc1Lrig1KO/+, and control mice (n=8–10 mice), n.s.=not significant, unpaired t-test on number of microscopic lesions per mouse.
Figure 3:
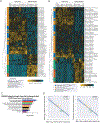
Figure 3:. Mpc1 deletion in the small intestine and colon increases dysplastic initiation in the Apc loss model of carcinogenesis.
(A) Macroscopic tumor burden was assessed in Apc Lrig1KO/+Mpc1Lrig1KO, Apc Lrig1KO/+Mpc1Lrig1KO/+, and Apc Lrig1KO/+ mice at 90 days post-TAM (n=11–12 mice), **p≤0.01, *p≤0.05, one-way ANOVA with multiple comparisons (B) Microscopic tumor grade and size assessed by pathologic grading in the small intestine (left) and the colon (right) for ApcLrig1KO/+ Mpc1Lrig1KO and ApcLrig1KO/+ mice (n=5–7), n.s.=not significant, *p≤0.05, unpaired t-test on number of microscopic tumors per mouse. (C) Hematoxylin/Eosin, and anti-β-catenin staining of ApcLrig1KO/+ and ApcLrig1KO/+ Mpc1Lrig1KO adenomas (100X, scale bars=25 μm). Black arrows indicate nuclear β-catenin. (D) Immunoblot of paired normal crypts (“C”) and tumor (“T”) samples from two ApcLrig1KO/+ mice and two ApcLrig1KO/+Mpc1Lrig1KO mice for MPC1, MPC2, and actin. Densitometry for MPC1 and MPC2, normalized to actin is shown with relative values adjusted to 100 for each ApcLrig1KO/+ mouse normal crypt sample. (E) 90 days post-tamoxifen, Ki67-positive nuclei as a percentage of total adenoma nuclei of ApcLrig1KO/+Mpc1Lrig1KO and ApcLrig1KO/+ adenomas were quantified on blinded high magnification images (n =3–5 mice, adenomas=10–23), n.s.=not significant, unpaired two-tailed t-test. Representative images to the right (100X, scale bars=25 μm). (F) 90 days post-tamoxifen, cleaved caspase 3-positive nuclei of ApcLrig1KO/+Mpc1Lrig1KO and ApcLrig1KO/+ adenomas (black arrows) were quantified on blinded high magnification images (n =3–5 mice, adenomas = 15–16), n.s.= not significant, unpaired two-tailed t-test. Representative images to the right (100X, scale bars = 25 μm). Green dashed circle indicates crypt necrosis and these positive nuclei were omitted. (G) At 140 days post-TAM, macroscopic tumor burden per mouse in ApcVillKO/+ and ApcVillKO/+Mpc1VillKO was assessed (n=18–27,28: one small intestine was damaged during dissection and removed from analysis). *p≤0.05, unpaired t-test. (H) Microscopic tumor grade and size assessed by pathologic grading in the small intestine (left) and colon (right) of ApcVillKO/+ and ApcVillKO/+Mpc1VillKO mice (n=7–8), *p≤0.05, unpaired t-test on number of microscopic tumors per mouse.
Figure 4.
Figure 4.. MPC overexpression arrests Apc mutant tissue hyperplasia.
Intestinal MARCM clones were generated using (A, G, L) an FRT82B wild-type chromosome (control), (B) a mutant chromosome for dMpc1, (C) a chromosome expressing Tub>dMpc1 RNAi, (D, H, M) a chromosome mutant for Apc1 and Apc2, (E) a chromosome mutant for Apc1 and Apc2 with Tub>dMpc1 RNAi (I, N), a Tub>dMpc1-dMpc2 overexpressing chromosome, and (J, O) an Apc1 and Apc2 mutant chromosome with Tub>dMpc1-dMpc2 overexpression. Clones were analyzed either 5 days (A-K) or 20 days (L-P) after induction. Quantitation of GFP+ clone size for each genotype is shown (F, K, P). Clones are marked by GFP (green) and nuclei are stained with DAPI (blue). The reduced effect of dMpc1 mutation alone or dMpc1 RNAi on clone size in panel F is less than that reported earlier because these clones were examined at five days after clone induction rather than 30 days (Schell et al., 2017). n≥30 intestines. ****p≤0.0001, ***p≤0.001, n.s.= not significant. Scale bars represent 50 μm (A), 20 μm (G), 40 μm (L).
Figure 5.
Figure 5.. Increased mitochondrial pyruvate metabolism arrests Apc mutant tissue hyperplasia and blocks Notch enteroendocrine tumor expansion.
Intestinal MARCM clones were generated using (A) an FRT82B wild-type chromosome (control), (B) an Apc1 and Apc2 mutant chromosome, (C) a Tub>LDH RNAi chromosome (LDH RNAi), (D) an Apc1 and Apc2 mutant chromosome with Tub>LDH RNAi, and (F-H) a chromosome that expresses Tub>Notch RNAi either alone (F) or together with Tub>dMpc1-dMpc2 overexpression (G) or Tub>LDH RNAi (H). Quantitation of GFP+ clone size for each genotype is shown (E, I). Clones are marked by GFP (green) and nuclei are stained with DAPI (blue). n≥30 intestines. ****p≤0.000, n.s.= not significant. Scale bars represent 30 μm (A, F).
Figure 6.
Figure 6.. Mpc1 loss influences fuel choice in intestinal crypts and adenomas.
Intestinal crypts or micro-dissected adenomas were freshly isolated and traced in parallel for each of three heavy labeled medias containing glucose, palmitate, and glutamine for 90 minutes. (A) Glucose (M+6) and pyruvate (M+3) labeling as measured by LC-MS from incubation with uniformly labeled 13C-glucose is not different in crypts isolated from control and Mpc1VillKO mice (n=8–9) n.s.= not significant, unpaired t-test (B) 13C-Glucose labeling into TCA cycle products citrate, malate and aspartate is significantly reduced in Mpc1VillKO crypts (n=8–9) ***p≤0.001, **p≤0.01, *p≤0.05, n.s. = not significant, n.d.= not determined, unpaired t-test. (C) 13C-Palmitate M+16 labeling is not different between control and Mpc1VillKO crypts (left). 13CPalmitate labeling into TCA cycle products citrate, malate and aspartate is higher in Mpc1VillKO crypts (n=8–9) (right). (D) Normalized contribution of each nutrient (palmitate, glucose and glutamine) to citrate (highlighted in pie chart) and malate production in control and Mpc1VillKO crypts. For each metabolite, a normalized labeling fraction was calculated and then corrected for the abundance of the isotopic precursor present in the isolated crypts (n=8,9) ***p≤0.001, *p≤0.05, n.s. = not significant, unpaired t-test. (E) Labeling of TCA intermediates citrate and malate as determined by GC-MS from heavy glucose, palmitate or glutamine containing media in freshly isolated adenomas from ApcLrig1KO/+ or ApcLrig1KO/+Mpc1Lrig1KO mice 90 days post-TAM. The glutamine labeling fraction into citrate and malate increases in Mpc1Lrig1KO mice (n=3). It is noteworthy that while the Cre driver is different between the normal crypts and adenomas, it is unlikely to affect the results as they are both efficient at causing complete recombination throughout the intestinal epithelium within a week of tamoxifen treatment. (F) Glucose (M+6) and pyruvate (M+3) labeling with uniformly labeled 13C-glucose is not different in adenomas isolated from control and Mpc1Lrig1KO mice (n=3 mice, pooled tumors >3 per mouse), n.s.= not significant, unpaired t-test.
Figure 7.
Figure 7.. Mpc1 deletion elicits enhanced stemness in adenomas and Mpc1 anti-correlates with stemness in mouse and human adenomas.
(A-B) Adenoma tissue (orange and blue; n=16–32) and normal uninvolved colon epithelium (green and red; n=3–10) were isolated from AOM-DSS day 100 mice (A) and ApcLrigKO/+ and ApcLrigKO/+Mpc1LrigKO/+ mice at 90 days post-TAM (B). RNA was extracted and evaluated on the 22-gene custom gene set including stemness and differentiation markers (top) and abundance displayed according to the heat map shown. Samples were clustered via calculating the Euclidean distance between centroids. See Berg 2019 for raw data and analysis code. (C) Linear least squares regression of Mpc1 gene expression was performed using the adenoma and normal colon samples from GSE201916 and the resulting derived gene list showing Mpc1 anti-correlation (r<−0.6; p-value < 0.01) was analyzed by PANTHER (v13.1). Negative log10(p-values) are reported for each pathway with the number of pathway genes identified in parentheses. The dotted line marks the significance of pathway overrepresentation (−log10(0.05) = 1.3). See Berg 2019 for associated tables. (D) GSE20916-derived joint plots of relative gene expression for Mpc1 versus Wnt pathway genes Axin2 (left, p=1.25E-12) and Sox9 (right, p=3.12E-10). The r-value and the fitted regression line with the slope’s 95% confidence interval for each correlation are shown.

References

    1. Bader DA, Hartig SM, Putluri V, Foley C, Hamilton MP, Smith EA, Saha PK, Panigrahi A, Walker C, Zong L, et al. (2019). Mitochondrial pyruvate import is a metabolic vulnerability in androgen receptor-driven prostate cancer. Nat Metab 1, 70–85. - PMC - PubMed
    1. Barker N, Ridgway RA, van Es JH, van de Wetering M, Begthel H, van den Born M, Danenberg E, Clarke AR, Sansom OJ, and Clevers H (2009). Crypt stem cells as the cells-of-origin of intestinal cancer. Nature 457, 608–611. - PubMed
    1. Berg JA. (2019). j-berg/bensard_figures_2019: Manuscript Resubmission (update) (Version v0.0.2). Zenodo. 10.5281/zenodo.3379036 - DOI
    1. Berg JA, Belyeu JR, Morgan JT, Bott AJ, Ouyang Y, Quinlan AR, Gertz J, Rutter J (2019). XPRESSyourself: Enhancing and Automating the Ribosome Profiling and RNA-Seq Analysis Toolkit. bioRxiv 704320; doi: 10.1101/704320 - DOI
    1. Beyaz S, Mana MD, Roper J, Kedrin D, Saadatpour A, Hong S-J, Bauer-Rowe KE, Xifaras ME, Akkad A, Arias E, et al. (2016). High-fat diet enhances stemness and tumorigenicity of intestinal progenitors. Nature 531, 53–58. - PMC - PubMed

Publication types

Substances