. 2019 Nov 29:2:116.
doi: 10.1038/s41746-019-0192-z. eCollection 2019.

Machine learning can accurately predict pre-admission baseline hemoglobin and creatinine in intensive care patients

Affiliations

Machine learning can accurately predict pre-admission baseline hemoglobin and creatinine in intensive care patients

Antonin Dauvin et al. NPJ Digit Med. .

Abstract

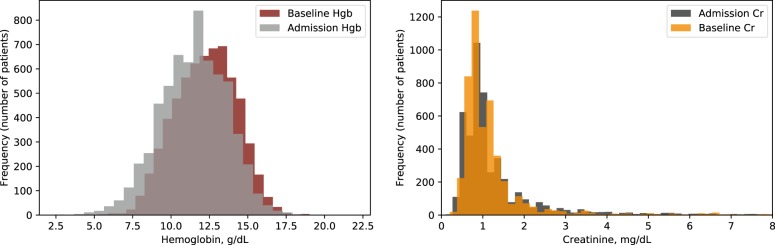
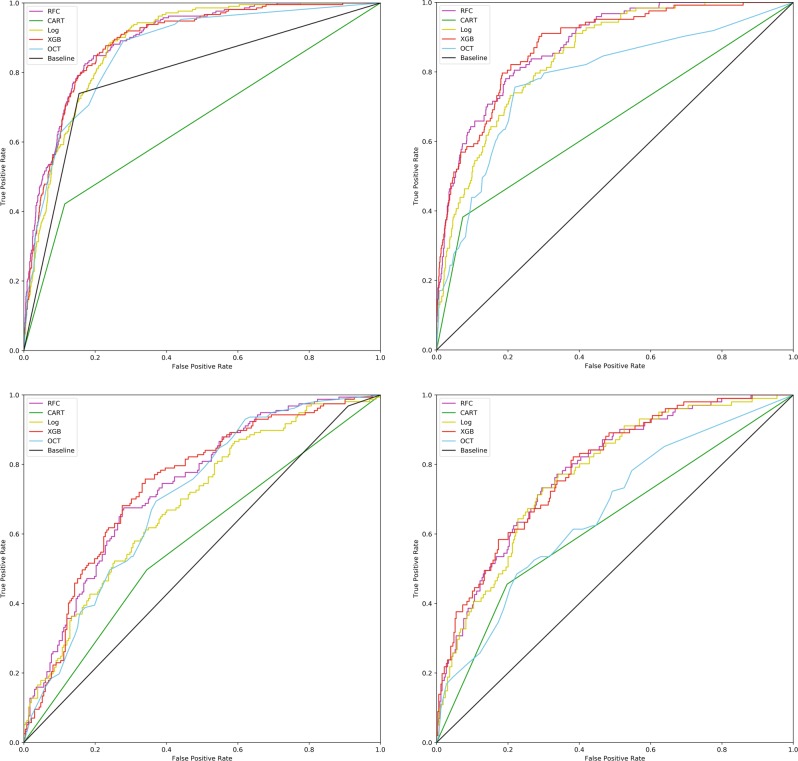
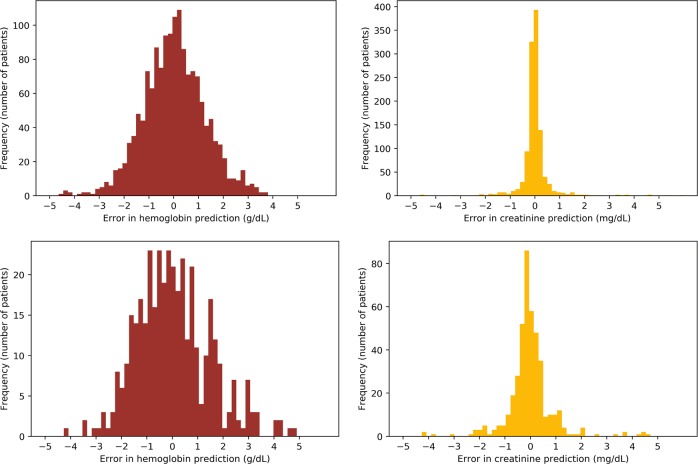
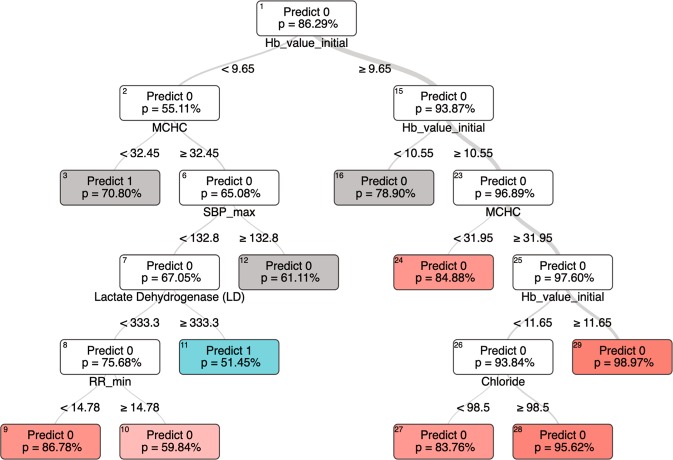
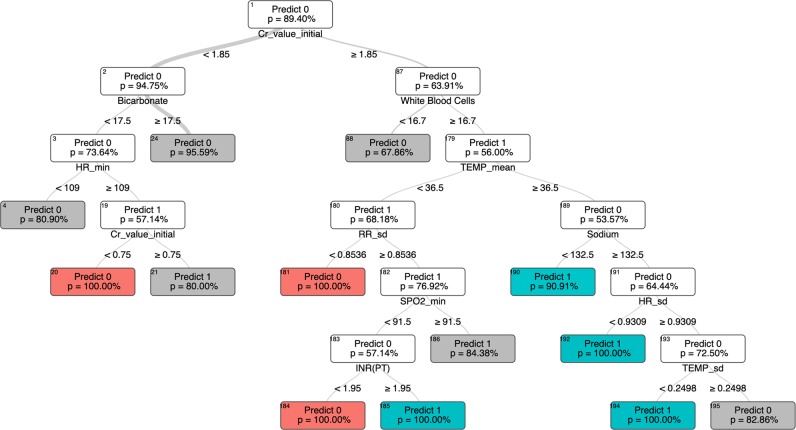
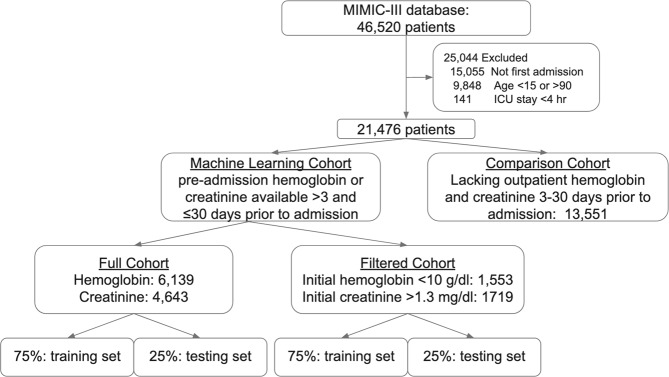
Patients admitted to the intensive care unit frequently have anemia and impaired renal function, but often lack historical blood results to contextualize the acuteness of these findings. Using data available within two hours of ICU admission, we developed machine learning models that accurately (AUC 0.86-0.89) classify an individual patient's baseline hemoglobin and creatinine levels. Compared to assuming the baseline to be the same as the admission lab value, machine learning performed significantly better at classifying acute kidney injury regardless of initial creatinine value, and significantly better at predicting baseline hemoglobin value in patients with admission hemoglobin of <10 g/dl.

Keywords: Acute kidney injury; Anaemia; Chronic kidney disease; Computational models; Data integration.


Conflict of interest statement

Competing interestsThe authors declare no competing interests.

Figures

Fig. 1
Fig. 1
Distributions of the baseline (outpatient) and initial (admission) values for hemoglobin and creatinine. Left: Hemoglobin, Right: Creatinine.
Fig. 2
Fig. 2
Receiver operating characteristic curves for the binary classification task by model. The left panels show performance on classifying baseline hemoglobin as <10 g/dl or not, and the right panels show performance on classifying AKI as present or absent. Upper panels show results for the full cohort, and bottom panels show results for the just the cohorts with admission hemoglobin <10 g/dl (left) and admission creatinine >1.3 mg/dl (right). The “baseline” model, shown for comparison, simply assumes the baseline value is similar to the admission value. RFC random forest classifier, CART classification and regression trees, Log logistic regression, XGB gradient boosted trees, OCT optimal classification trees.
Fig. 3
Fig. 3
Histograms of the differences between predicted and observed baseline hemoglobin and creatinine values for the Gradient Boosted Tree model. Left panels show hemoglobin results and right panels show creatinine results. The upper panels show results for the full cohort, and bottom panels show results for the just the cohorts with abnormal admission labs – hemoglobin <10 g/dl (left) and admission creatinine >1.3 mg/dl (right).
Fig. 4
Fig. 4
Representative optimal classification tree for the hemoglobin classification task. In this tree, “Predict 0” indicates the model’s prediction that the baseline hemoglobin is <10 g/dl, and “Predict 1” indicates a prediction that the baseline hemoglobin is 10 g/dl or greater. Relevant features generate branch points, and each terminal node (or “leaf”) represents the final model prediction. The tree shown is a segment of a larger, more complex tree diagram. Terminal nodes are colored red or green, and nodes that have additional branchings in the full model are gray. The relative thickness of the lines connecting the nodes is proportional to the fraction of patients falling on either side of the split. The “p value” is the model’s certainty that the categorization is correct, eg “There is a 95% chance that the baseline hemoglobin is <10 g/dl.” Hb hemoglobin (g/dl), MCHC mean corpuscular hemoglobin concentration (g/dl), SBP systolic blood pressure (mmHg), chloride (mEq/L), RR respiratory rate (breaths per minute), max maximum, min minimum.
Fig. 5
Fig. 5
Representative optimal classification tree for the AKI classification task. “Predict 0” indicates the model’s prediction that AKI is present, and “Predict 1” indicates a prediction of no AKI. Please see full explanation of the tree diagram in Fig. 4. Cr creatinine (mg/dl), bicarbonate (mmol/L), white blood cells (thousand/μL), HR Heart Rate (beats per minute), TEMP temperature (degrees celsius), RR respiratory rate (breaths per minute), sodium (mEq/dl), SPO2 oxygen saturation (%), INR(PT) international normalized ratio of prothrombin time, mean average, min minimum, sd standard deviation.
Fig. 6
Fig. 6
Cohort selection process from the MIMIC-III database.

References

    1. Deyo D, Khaliq A, Mitchell D, Hughes DR. Electronic sharing of diagnostic information and patient outcomes. Am. J. Manag Care. 2018;24:32–37. - PubMed
    1. Rudin RS, Motala A, Goldzweig CL, Shekelle PG. Usage and effect of health information exchange: a systematic review. Ann. Intern. Med. 2014;161:803–811. doi: 10.7326/M14-0877. - DOI - PubMed
    1. World Health Organization. Haemoglobin concentrations for the diagnosis of anaemia and assessment of severity (2011).
    1. Tyler PD, et al. Assessment of intensive care unit laboratory values that differ from reference ranges and association with patient mortality and length of stay. JAMA Netw. Open. 2018;1:e184521–e184521. doi: 10.1001/jamanetworkopen.2018.4521. - DOI - PMC - PubMed
    1. Hébert PC, et al. A multicenter, randomized, controlled clinical trial of transfusion requirements in critical care. Transfusion Requirements in Critical Care Investigators, Canadian Critical Care Trials Group. N. Engl. J. Med. 1999;340:409–417. doi: 10.1056/NEJM199902113400601. - DOI - PubMed