. 2020 Jan 6;219(1):e201902164.
doi: 10.1083/jcb.201902164.

NCAM regulates temporal specification of neural progenitor cells via profilin2 during corticogenesis

Affiliations

NCAM regulates temporal specification of neural progenitor cells via profilin2 during corticogenesis

Rui Huang et al. J Cell Biol. .

Abstract

The development of cerebral cortex requires spatially and temporally orchestrated proliferation, migration, and differentiation of neural progenitor cells (NPCs). The molecular mechanisms underlying cortical development are, however, not fully understood. The neural cell adhesion molecule (NCAM) has been suggested to play a role in corticogenesis. Here we show that NCAM is dynamically expressed in the developing cortex. NCAM expression in NPCs is highest in the neurogenic period and declines during the gliogenic period. In mice bearing an NPC-specific NCAM deletion, proliferation of NPCs is reduced, and production of cortical neurons is delayed, while formation of cortical glia is advanced. Mechanistically, NCAM enhances actin polymerization in NPCs by interacting with actin-associated protein profilin2. NCAM-dependent regulation of NPCs is blocked by mutations in the profilin2 binding site. Thus, NCAM plays an essential role in NPC proliferation and fate decision during cortical development by regulating profilin2-dependent actin polymerization.


Figures

Figure 1.
Figure 1.
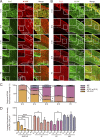
NCAM is dynamically expressed in NPCs during cortical development. (A and B) Coronal sections of mouse cortices from indicated embryonic stages were coimmunostained for NCAM and Sox2 (A) or Tuj1 (B). Scale bars, 50 µm. (C) Percentages of NCAM+ immunoreactivity in each layer. (D) Average immunofluorescence density of NCAM in each layer. n = 9 brain slices from three mice. Values represent mean ± SEM. *, P < 0.05; **, P < 0.01; ***, P < 0.001 (two sided). One-way ANOVA with Bonferroni corrections (IZ, CP, and MZ in C and MZ in D), Dunnett’s T3 correction (VZ/SVZ in C), and Kruskal-Wallis test with Dunn-Bonferroni correction (VZ/SVZ, IZ, and CP in D). PP, preplate.
Figure S1.
Figure S1.
Expression of NCAM and profilin2 in the developing cerebral cortex. (A–G) Western blot analysis of NCAM and profilin2 expression in E12, E14, E16, E18, and P0 mouse cortices. γ-Tubulin served as a control. The protein levels in E14, E16, E18, and P0 mouse cortices were quantified relative to the protein levels in E12 mouse cortices set to 1.0. n = 3 or 4 biological replicates (total NCAM and profilin2, respectively). (H) Coronal sections of control and NCAM-cKO mouse cortices were coimmunostained for NCAM and Sox2 at E12 and E14. Scale bars, 20 µm. Values represent mean ± SEM. *, P < 0.05; **, P < 0.01; ***, P < 0.001 (two sided). One-way ANOVA with least significant difference correction (C and F), with Dunnett’s T3 correction (B, D, and E), or Kruskal-Wallis test with Dunn-Bonferroni post hoc comparison (G).
Figure 2.
Figure 2.
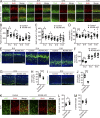
NCAM deficiency transiently suppresses NPC proliferation in vivo. (A) Coronal sections of control and NCAM-cKO cortices were coimmunostained for BrdU and Pax6 30 min after BrdU injection. (B–D) Numbers of Pax6+ (B) and BrdU+ (C) cells and percentages of Pax6+BrdU+ cells in total Pax6+ cell population (D). (E–J) Coronal sections of control and NCAM-cKO cortices were immunostained for Tbr2 (E), Ki67 (G), or PH3 (I) with DAPI counterstaining. Numbers of Tbr2+ (F), Ki67+ (H), and PH3+ (J) cells in the VZ/SVZ. (K) Coronal sections of E14 control and NCAM-cKO cortices were coimmunostained for BrdU and Ki67. (L and M) Percentages of BrdU+Ki67 cells in the total BrdU+ cell population (L) and percentages of BrdU+Ki67+ cells in the total Ki67+ cell population (M). Scale bars, 50 µm. n = 15 brain slices from three mice. Values represent mean ± SEM. *, P < 0.05; **, P < 0.01; ***, P < 0.001 (two sided). Student’s t test or Mann-Whitney test (E12 in B, E12 in C, and E14 in F).
Figure S2.
Figure S2.
NCAM deficiency does not lead to increased NPC apoptosis during embryonic development. (A) Coronal sections of E12, E14, and E16 control and NCAM-cKO cortices were immunostained for activated, cleaved caspase3 and counterstained with DAPI. (B) Numbers of caspase3+ cells in the entire hemitelencephalon cortex. Mean ± SEM values. n = 15 brain slices from three mice. Mann-Whitney test did not reveal a statistically significant differences between groups. Scale bars, 50 µm.
Figure 3.
Figure 3.
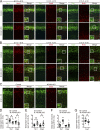
NCAM deficiency reduces numbers of cortical neurons at early but not later developmental stages. (AC) Coronal sections of control and NCAM-cKO cortices were immunostained for Tbr1 (A), Ctip2 (B), and Cux1 (C) with DAPI counterstaining. Scale bars, 50 µm. (D–F) Numbers of Tbr1+ (D), Ctip2+ (E), and Cux1+ (F) cells per 2.5 × 104 µm2. n = 15 brain slices from three mice. Values represent mean ± SEM. *, P < 0.05; **, P < 0.01; ***, P < 0.001 (two sided). Student’s t test or Mann-Whitney test (E14 in D).
Figure S3.
Figure S3.
NCAM deficiency does not affect the distribution of neonatal cortical neurons in the coronal plane. (A) The cortical neuron distribution was analyzed by the maximum migration distance of deep-layer (red arrow) or upper-layer (blue arrow) neurons from VZ to cortical surface/total cortical length (purple arrow). (B–D) Percentages of the maximum migration distance of Tbr1+ (B), Ctip2+ (C), and Cux1+ (D) neurons in total cortical length. Mean ± SEM values. n = 15 brain slices from three mice. Student’s t test or Mann-Whitney test (E12 and E14 in B and E18 in D).
Figure 4.
Figure 4.
NCAM deficiency delays the generation of cortical neurons in vivo. (A and B) Cortical sections of E18 control and NCAM-cKO mice were coimmunostained for BrdU and Tbr1 (A) or Ctip2 (B). BrdU was injected at E11.5, E14.5, or E15.5. (C) Cortical sections of P2 control and NCAM-cKO mice were coimmunostained for BrdU and Cux1. BrdU was injected at E16.5. Scale bars, 50 µm. (D–G) Percentages of BrdU+Tbr1+, BrdU+Ctip2+, or BrdU+Cux1+ cells in total populations of Tbr1+, Ctip2+, or Cux1+ cells after BrdU administration at E11.5 (D), E14.5 (E), E14.5 (F), or E16.5 (G). n = 15 brain slices from three mice. Values represent mean ± SEM. *, P < 0.05; **, P < 0.01 (two sided). Student’s t test or Mann-Whitney test (BrdU+Ctip2+ cells in E and F).
Figure 5.
Figure 5.
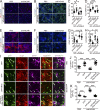
NCAM deficiency results in precocious gliogenesis. (A) Coronal sections of the VZ were immunostained for GFAP with DAPI counterstaining. (B) Densities of GFAP+ cells in the dorsolateral VZ. (C) Total intensity of GFAP labeling per E16 VZ/SVZ. (D) Coronal sections of the dorsolateral VZ of P2 control and NCAM-cKO mice were coimmunostained for BrdU and GFAP. BrdU was injected at E16.5. (E) Numbers of BrdU+GFAP+ cells per 2.0 × 104 µm2 in the dorsolateral VZ. (F) Coronal cortical sections of E18 and P0 control and NCAM-cKO mice were immunostained for Olig2 with DAPI counterstaining. (G) Numbers of Olig2+ cells per 2.5 × 104 µm2. (H) Percentages of BrdU+Olig2+ cells in the total Olig2+ cell population. (I) Coronal sections of the dorsal VZ of P2 control and NCAM-cKO mice were coimmunostained for BrdU and Olig2. BrdU was injected at E16.5. (J) Cortical sections of E16 control and NCAM-cKO mice were immunostained for A2B5 with DAPI counterstaining. (K) Densities of A2B5+ cells. (L) Cortical sections of E14 control and NCAM-cKO mice were immunostained for BLBP+ with DAPI counterstaining. (M) Densities of BLBP+ cells. Scale bars, 50 µm. n = 15 brain slices from three mice. Values represent mean ± SEM. *, P < 0.05; **, P < 0.01; ***, P < 0.001 (two sided). Student’s t test or Mann-Whitney test (C and H).
Figure 6.
Figure 6.
Profilin2 is a novel binding partner of NCAM. (A) Coimmunoprecipitation analysis of the interaction between NCAM and profilin2 using P0 mouse brain homogenates. (B) ELISA analysis of the binding of NCAM140ICD or NCAM180ICD to immobilized profilin2. (C–E) ELISA of the binding of biotinylated NCAM140ICD-derived peptides (C), wild-type NCAM140 (aa745–753) peptide and its mutant variants with 749LC750 mutated to 749AS750 or 748NL749 mutated to 748QA749 (D), and wild-type NCAM140ICD or mutNCAM140ICD (749LC750 to 749AS750 mutation; E) to immobilized profilin2. n = 3 biological replicates. (F) Schematic diagram of amino acid mutations in mutNCAM140ICD. (G and H) Coronal sections of the VZ (G) and the cortex (H) of control mice were coimmunostained for profilin2, NCAM, and Sox2 (G) or Tuj1 (H). Scale bars, 50 µm. (I) Average profilin2 immunofluorescence density in each layer. (J) Percentages of profilin2 immunoreactivity in each layer. n = 9 brain slices from three mice. (K and L) Western blot analysis of levels of NCAM and profilin2 in cultured NPCs derived from E14 control and NCAM-cKO VZ/SVZ (K). The relative levels of profilin2 protein in NCAM-cKO NPCs, with the profilin2 levels in control NPCs set to 100% (L). n = 4 biological replicates. (M) Quantitative PCR analysis of the levels of profilin2 mRNA in cultured NPCs derived from E14 control and NCAM-cKO brains. Profilin2 mRNA levels in control NPCs were set to 100%. n = 5 biological replicates. Values represent mean ± SEM. *, P < 0.05; **, P < 0.01; ***, P < 0.001 (two sided). Two-way ANOVA (B–E), one-way ANOVA with Bonferroni correction (IZ, CP, and MZ in J), Dunnett’s T3 correction (VZ/SVZ in J), Kruskal-Wallis test with Dunn-Bonferroni correction (I), and paired t test (L and M).
Figure 7.
Figure 7.
NCAM enhances NPC proliferation and differentiation through profilin2. (A) Cultured NPCs transfected with siProfilin2 or NC were incubated with NCAM antibodies and BrdU. Cells were immunostained for BrdU with DAPI counterstaining. (B, E, and F) Cultured NPCs transfected with siProfilin2 or NC were incubated with NCAM antibodies or PBS and cultured in differentiation condition for 5 d. Cells were immunostained for Tuj1 (B), GFAP (E), or O4 (F) and counterstained with DAPI. (C, D, G, and H) Percentages of BrdU+DAPI+ (C), Tuj1+DAPI+ (D), GFAP+DAPI+ (G), and O4+DAPI+ (H) cells in the total population of DAPI+ cells. (I–K) Cultured NPCs cotransfected with profilin2 shRNA (shProfilin2) and shProfilin2-resistant plasmids (Res Profilin2), shProfilin2, or control vector expressing GFP alone (GFP) were incubated with NCAM antibodies or PBS and allowed to differentiate for 3 d. Cells were immunostained for Tuj1 or GFAP. Percentages of Tuj1+GFP+ (J) or GFAP+GFP+ (K) cells in the total population of GFP+ cells. n = 15 microscopic fields from three biological replicates. Scale bars, 50 µm (A, F, and I) or 20 µm (B and E). Values represent mean ± SEM. *, P < 0.05; **, P < 0.01; ***, P < 0.001 (two sided); ns, not statistically significant. Kruskal-Wallis test with Dunn-Bonferroni post hoc correction (C) and one-way ANOVA with Bonferroni corrections (D, G, J, and K) or Dunnett’s T3 correction (H).
Figure S4.
Figure S4.
Profilin2 expression is downregulated specifically by profilin2 RNAi. (A) Western blot analysis of profilin2 levels in Neuro-2a cells transfected with either siProfilin2 or NC. (B) Levels of profilin2 in siProfilin2-transfected cells relative to those in NC-transfected cells, which were set to 1.0. (C and D) Quantitative PCR analysis of the levels of profilin2 (C) or profilin1 (D) mRNA in cultured NPCs transfected with either siProfilin2 (399 or 527) or NC. The mRNA levels of profilin2/1 in NC-transfected NPCs were set to 1.0. (E and F) Western blot analysis of profilin2 levels in Neuro-2a cells transfected with scrambled shRNA (GFP) or profilin2 shRNA (shProfilin2) only or cotransfected with shProfilin2 and shRNA-resistant profilin2 (Res Profilin2). The levels of profilin2 protein were quantified relative to those in GFP-transfected cells set to 1.0. (G) NCAM levels in brain homogenates loaded in different quantities (26, 53, 78, and 104 µg). Values represent mean ± SEM. n = 4 biological replicates. *, P < 0.05; **, P < 0.01 (two sided); ns, not statistically significant. Paired t test (B), one-way ANOVA with Dunnett’s T3 correction (C and D), or least significant difference correction (F).
Figure 8.
Figure 8.
NCAM enhances NPC proliferation and differentiation through profilin2-regulated actin dynamics. (A) Western blot analysis of F- and G-actin levels in cultured control and NCAM-cKO NPCs. γ-Tubulin served as a control and was enriched in the F-actin fraction containing polymerized tubulin. (B) Relative levels of G- and F-actin in NCAM-cKO NPCs. The levels of G- and F-actin in control NPCs were set to 100%. n = 4 biological replicates. (C) Cultured MEFs were cotransfected with NCAM siRNA (siNCAM) or NC and with lentiviruses coexpressing GFP and wild-type NCAM140 (NCAM) or mutant NCAM140 (mutNCAM). MEFs cotransfected with NC and lentiviruses expressing GFP only served as a control. Western blot analysis of levels of NCAM, actin, and tubulin. Lysis with the F-actin stabilization buffer solubilizes and releases NCAM to the G-actin fraction. Relative levels of NCAM protein in the G-actin fraction and the relative ratio of G- and F-actin were quantified. n = 3 biological replicates. (D) Cultured NCAM-cKO NPCs were transduced with lentiviruses coexpressing GFP and NCAM or mutNCAM. NPCs transduced with lentiviruses expressing GFP only served as a control. NPCs were stained by fluorescent phalloidin to visualize F-actin and by DNase I to visualize G-actin. (E and F) F-actin/G-actin ratios in cells are shown in D and G, respectively. n = 54 cells (E) and 21 cells (F) from three biological replicates. (G) Cultured NCAM-cKO NPCs were transduced with plasmids coencoding either GFP or profilin2 and GFP, and then they were stained with fluorescent phalloidin and DNase I. (H) Coronal VZ sections of E12 control and NCAM-cKO mice were immunostained for actin with DAPI counterstaining. White dotted lines show examples of cell boundaries. (I) The CSI for dividing cells in the VZ. n = 40 mitotic cells from three mice. (J and K) Cultured NCAM-cKO NPCs were transduced with lentiviruses coexpressing GFP and NCAM or mutNCAM, incubated with BrdU, and immunostained for BrdU with DAPI counterstaining (J). Cultured NPCs differentiated for 5–7 d were immunostained for Tuj1 and GFAP with DAPI counterstaining (K). (L–N) Percentages of BrdU+GFP+ (L), Tuj1+GFP+ (M), and GFAP+GFP+ (N) cells in total GFP+ cell population. n = 32 microscopic fields from three biological replicates (L). n = 5 biological replicates (M and N). Scale bars, 20 µm (D, G, J, and K) or 5 µm (H). Values represent mean ± SEM. *, P < 0.05; **, P < 0.01; ***, P < 0.001 (two sided); ns, not statistically significant. Paired t test (B), Mann-Whitney test (I), one-way ANOVA with Dunnett’s T3 correction (C) or Bonferroni correction (M and N), and Kruskal-Wallis test with Dunn-Bonferroni post hoc comparisons (E, F, and L).
Figure 9.
Figure 9.
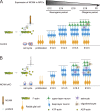
The role of NCAM in regulating the temporal generation of neurons and glia in the developing cortex. (A) NCAM expression is high in NPCs at the neurogenic period and declines at the gliogenic period. The intracellular domain of NCAM interacts with profilin2 and promotes actin polymerization in NPCs. NCAM-dependent actin regulation is required for rounding of NPCs during mitosis as well as control of NPC proliferation and temporal differentiation into cortical neurons and glia. (B) Ablation of NCAM expression in NPCs results in reduced expression of profilin2 and loss of its NCAM-dependent regulation, leading to decreased actin polymerization and reduced rounding of mitotic NPCs. This slows down cell cycle progression, reduces NPC proliferation at an early stage of neural development, delays production of cortical neurons, and leads to precocious formation of cortical glia.
Figure S5.
Figure S5.
Schematic diagram showing areas chosen for quantification of cells in imaging analysis. (A) Red rectangle indicates the 100 × 250-µm area of interest in the dorsal pallium (DP) perpendicular to the VZ. Blue rectangle indicates the 100 × 250-µm areas of interest in the DP. Purple square indicates the 150 × 150-µm area of interest in the DP adjacent to VZ. CH, cortical hem; MP, medial pallium; LP, lateral pallium; LV, lateral ventricle (see Materials and methods for details). (B) Average immunofluorescence density of profilin2 in each cortical layer. n = 9 brain slices from three mice. Values represent mean ± SEM. *, P < 0.05 (two sided). Kruskal-Wallis test with Dunn-Bonferroni post hoc test (CP) and one-way ANOVA with Bonferroni correction (IZ and MZ).

Similar articles

Cited by

References

    1. Amoureux M.C., Cunningham B.A., Edelman G.M., and Crossin K.L.. 2000. N-CAM binding inhibits the proliferation of hippocampal progenitor cells and promotes their differentiation to a neuronal phenotype. J. Neurosci. 20:3631–3640. 10.1523/JNEUROSCI.20-10-03631.2000 - DOI - PMC - PubMed
    1. Angata K., Huckaby V., Ranscht B., Terskikh A., Marth J.D., and Fukuda M.. 2007. Polysialic acid-directed migration and differentiation of neural precursors are essential for mouse brain development. Mol. Cell. Biol. 27:6659–6668. 10.1128/MCB.00205-07 - DOI - PMC - PubMed
    1. Baracskay K.L., Kidd G.J., Miller R.H., and Trapp B.D.. 2007. NG2-positive cells generate A2B5-positive oligodendrocyte precursor cells. Glia. 55:1001–1010. 10.1002/glia.20519 - DOI - PubMed
    1. Bonfanti L. 2006. PSA-NCAM in mammalian structural plasticity and neurogenesis. Prog. Neurobiol. 80:129–164. 10.1016/j.pneurobio.2006.08.003 - DOI - PubMed
    1. Boutin C., Schmitz B., Cremer H., and Diestel S.. 2009. NCAM expression induces neurogenesis in vivo. Eur. J. Neurosci. 30:1209–1218. 10.1111/j.1460-9568.2009.06928.x - DOI - PubMed

Publication types

MeSH terms