. 2020 Mar 2;217(3):jem.20182293.
doi: 10.1084/jem.20182293.

Single-cell analysis of RORα tracer mouse lung reveals ILC progenitors and effector ILC2 subsets

Affiliations

Single-cell analysis of RORα tracer mouse lung reveals ILC progenitors and effector ILC2 subsets

Maryam Ghaedi et al. J Exp Med. .

Abstract

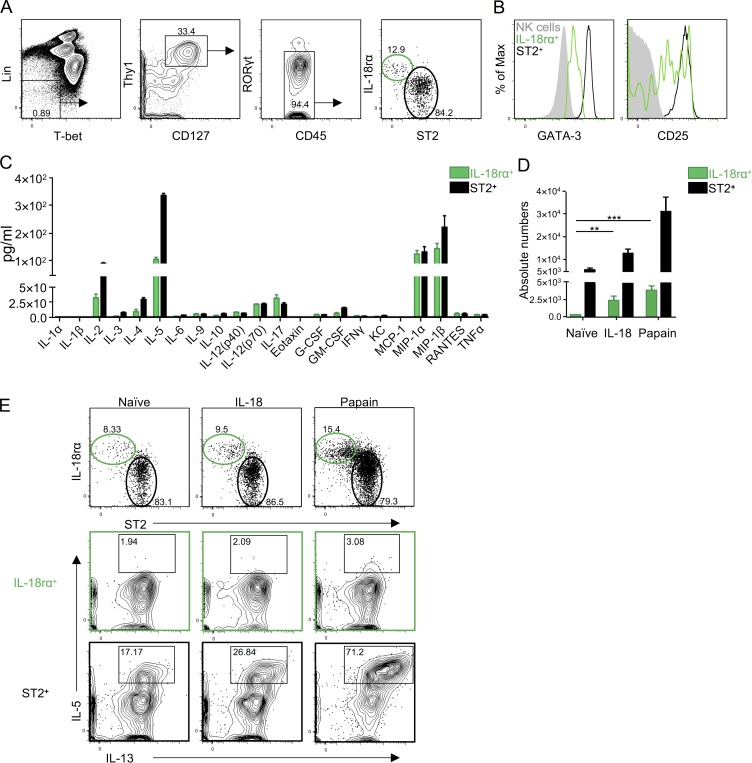
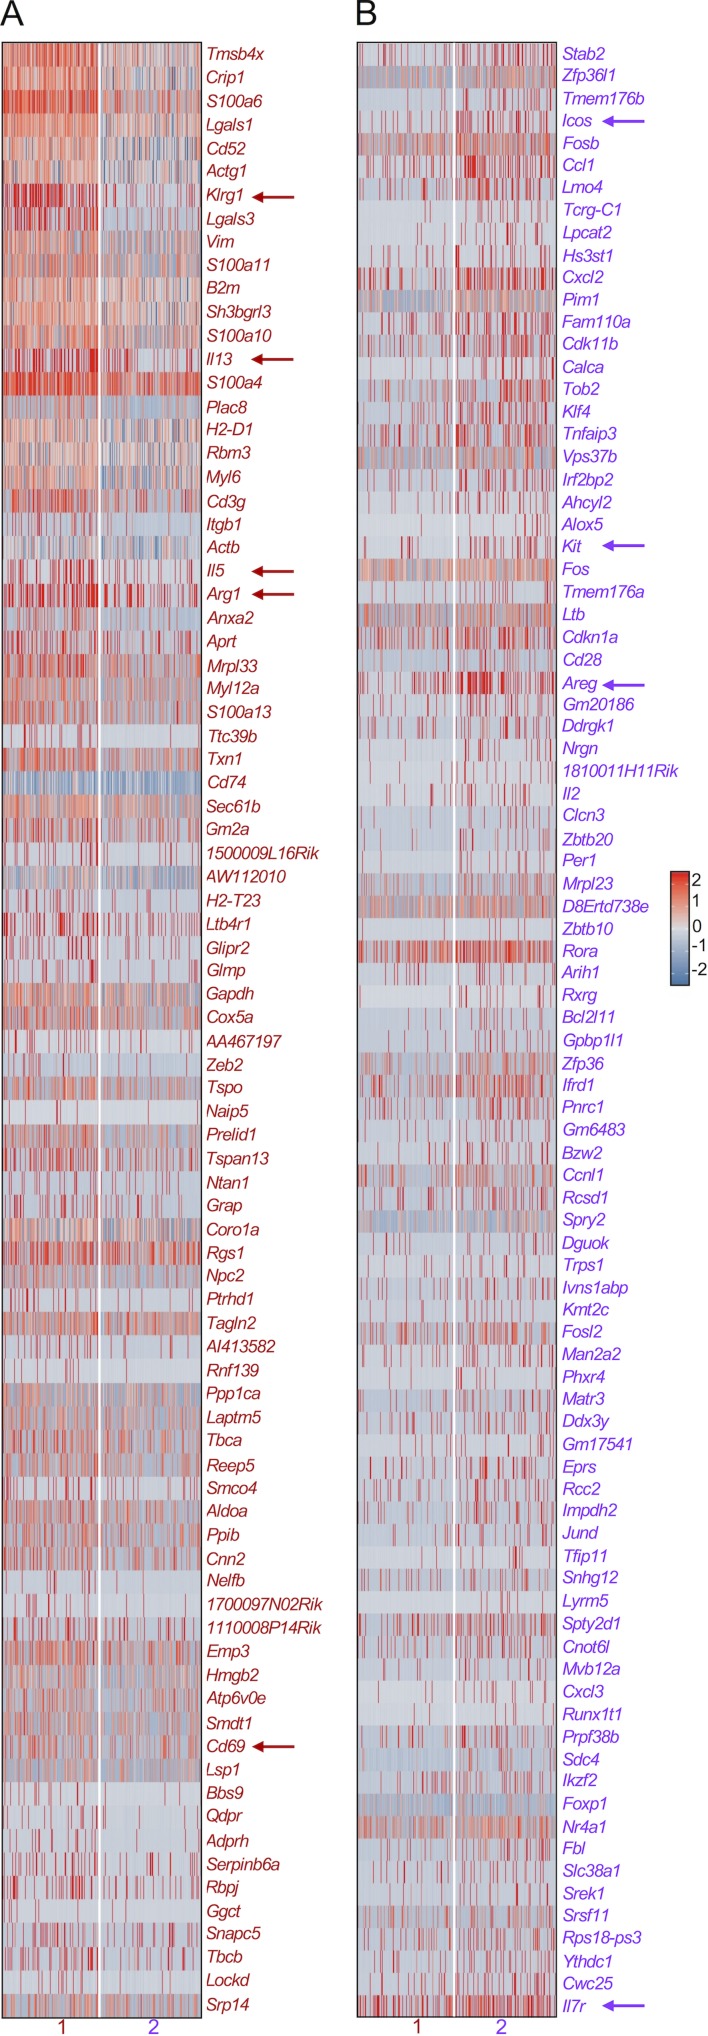
Lung group 2 innate lymphoid cells (ILC2s) drive allergic inflammation and promote tissue repair. ILC2 development is dependent on the transcription factor retinoic acid receptor-related orphan receptor (RORα), which is also expressed in common ILC progenitors. To elucidate the developmental pathways of lung ILC2s, we generated RORα lineage tracer mice and performed single-cell RNA sequencing, flow cytometry, and functional analyses. In adult mouse lungs, we found an IL-18Rα+ST2- population different from conventional IL-18Rα-ST2+ ILC2s. The former was GATA-3intTcf7EGFP+Kit+, produced few cytokines, and differentiated into multiple ILC lineages in vivo and in vitro. In neonatal mouse lungs, three ILC populations were identified, namely an ILC progenitor population similar to that in adult lungs and two distinct effector ILC2 subsets that differentially produced type 2 cytokines and amphiregulin. Lung ILC progenitors might actively contribute to ILC-poiesis in neonatal and inflamed adult lungs. In addition, neonatal lung ILC2s include distinct proinflammatory and tissue-repairing subsets.


Figures

Figure 1.
Figure 1.
ILCs in RORα-YFP mice express YFP. (A) Lung ILC2s from naive and IL-33–treated adult as well as neonatal (12-d-old) mice were sequentially gated by LinGATA-3+ST2+Thy1+, and their expression of YFP in RORα-YFP (black line) and B6 control (filled gray) mice is shown. (B) LinYFP+ cells from adult and neonatal lungs as well as adult small intestine were gated and analyzed for the expression of GATA-3 and RORγt as well as GATA-3 and Thy1. Lung LinYFP+Thy1+ cells were further analyzed for the expression of ST2 and CD25. Data are representative of three or more independent experiments with three or more mice per group in each experiment.
Figure S1.
Figure S1.
YFP expression in lymphoid populations of lung, BM, and intestine of RORα-YFP mice. (A) Lung ILC2s from naive and IL-33–treated adult as well as neonatal (12-d-old) mice were sequentially gated by LinCD127+Thy1+ST2+CD25+, and their expression of YFP in RORα-YFP (black line) and B6 control (filled gray) mice is shown. (B–E) YFP expression by adult lung CD19+ B cells and TCRαβ/γδ+ T cells (B), TCRαβ/γδNKp46+ (YFP+TCRαβ/γδNKp46+ are analyzed for Eomes and T-bet expression; C), BM LinThy1+CD127+PD-1+α4β7+CD25 ILCPs and LinCD127+Thy1+ST2+ ILC2Ps (D), and intestinal LinRORγGATA-3+ ILC2s and LinRORγt+GATA-3int ILC3s (E) in RORα-YFP (black line) and B6 control (filled gray) mice is shown.
Figure 2.
Figure 2.
ScRNA-seq analysis of adult RORα-YFP mouse lungs identifies two distinct ILC2 subsets. (A) Gating strategy for the purification of Linlo cells from adult RORα-YFP mouse lungs for scRNA-seq analysis. (B) t-SNE plot shows distinct clusters within the 4,664 sequenced cells. (C) Heatmap of the differentially expressed genes by the clusters from B. Top 10 differentially expressed transcripts of the lymphoid lineages are shown. (D) The ILC2 cluster from B was subjected to further unsupervised clustering that divided the 371 ILC2s into subset 1 (233 cells) and subset 2 (138 cells). Heatmap shows the top 20 genes that are differentially expressed by the subsets 1 and 2. The arrows point to the genes that are mentioned in the text. (E) Heatmap shows the expression of our selection of ILC(2)-associated genes by subsets 1 and 2. This gene list includes the transcription factors, cell surface receptors, and effector cytokines important for ILC(2) lineage development and function based on the literature. Hence, it includes genes that are equally expressed as well as genes that are differentially expressed by the two subsets. The differentially expressed genes are shown by black (higher expression on subset 1) and green (higher expression on subset 2) boxes. The rest of the genes are similarly expressed by the two subsets.
Figure S2.
Figure S2.
Gene expression profiles of adult lung ILC2 cluster and subsets 1 and 2. (A) t-SNE plots showing expression of the indicated individual genes. (B and C) Heatmap shows all the genes that are differentially expressed (P ≤ 0.05) by the adult ILC2 subsets. Genes that have higher expression in subset 1 than subset 2 (B), as well as genes that have higher expression in subset 2 than subset 1 (C), are shown. The arrows point to the genes that are mentioned in the text.
Figure 3.
Figure 3.
Flow cytometric and functional analyses confirm two distinct adult lung ILC subsets. (A) TbetLinYFP+Thy1+CD127+RORγt cells were sequentially gated and divided into IL-18Rα+ST2 (green) and IL-18RαST2+ (black) subsets in adult RORα-YFP mouse lungs. (B) The expression of GATA-3, CD25, KLRG1, IL-25R, and GITR by lung IL-18Rα+ cells (green) and ST2+ ILC2s (black) in A are shown. Lung NK cells (NKp46+Eomes+T-bet+; filled gray) and mesenteric lymph node (MLN) ILC2s (filled red) were used as controls. (C) LinYFP+Thy1+CD127+IL-18Rα+ST2 (green) and IL-18RαST2+ (black) were analyzed for the expression of RORγt and T-bet. (D) LinYFP+Thy1+CD127+ cells were sorted into IL-18Rα+ cells (green) and ST2+ ILC2s (black) and stimulated for 72 h with PMA and ionomycin. The amounts of cytokines and chemokines in the culture supernatants were determined. (E) Absolute numbers of IL-18Rα+ cells (green) and ST2+ ILC2s (black) gated as in A in naive, IL-18, and papain-treated lungs are shown. (F) LinYFP+Thy1+CD127+IL-18Rα+ cells (green) and ST2+ ILC2s (black) were analyzed for intracellular IL-5 and IL-13 in naive, IL-18, and papain-treated lungs. (G) LinThy1+CD127+IL-18Rα+ cells (green) and ST2+ ILC2s (black) were analyzed for Tcf7EGFP and Kit expression in naive and papain-treated Tcf7EGFP adult mouse lungs. (H) TbetLinThy1+CD127+RORγt cells were analyzed for TCF-1 and ST2 expression in naive and papain-treated lungs. Data in A–E are representative of three or more independent experiments with three or more mice per group in each experiment, and data in F and G are representative of two independent experiments with two or more mice per group in each experiment (mean ± SEM). *, P ≤ 0.05 by two-tailed Student’s t test.
Figure 4.
Figure 4.
Adult lung IL-18Rα+ ILCs have similar differentiation properties as BM ILCPs. BM ALPs (LinFlt3+CD127+Ly6DCD25Thy1), ILCPs (LinThy1+CD127+PD-1+α4β7+CD25), or lung IL-18Rα+ ILCs (LinYFP+Thy1+CD127+IL-18Rα+ST2) were purified by from papain-treated RORα-YFP mice (CD45.2+) and injected (2,000 cells per mouse) intravenously into lethally irradiated Pep3b mice (CD45.1+). The tissues of the recipient mice were analyzed 6 wk after transplantation. (A) Donor-derived lung ILC2s were sequentially gated by CD45.1CD45.2+LinT-betThy1+ST2+CD127+GATA-3+ (pink gates). The Lin cocktail in this analysis included anti-CD3e, TCRαβ, TCRγδ, CD19, NKp46, CD11b, CD11c, Gr-1, and Ter119. Donor-derived Lin+T-bet+ cells were also gated and analyzed for Thy1 and CD127 expression. (B) Donor-derived liver cells were gated by CD45.1CD45.2+LinNKp46+ and further divided into T-bet+Eomes ILC1s and T-bet+Eomes+ NK cells. The Lin cocktail in this analysis included anti-CD3e, TCRαβ, TCRγδ, CD19, Gr-1, and Ter119. (C) Absolute numbers of donor-derived lung ILC2s, liver ILC1s, and NK cells. (D) BM ILCPs or lung IL-18Rα+ ILCs were purified as in A, and 1,000 cells each were cultured on OP9-DL1 with IL-7 and SCF for 1 wk. The progenies were analyzed for Thy1 and NKp46 expression. Thy1+NKp46 cells were further analyzed for ICOS expression. Frequencies of the indicated subsets are shown in pie charts. (E) BM ILCPs or lung LinRorc(γt)-EGFPThy1+CD127+IL-18Rα+ST2 cells were purified from papain-treated Rorc(γt)-EGFP+/− mice and cultured on OP9-DL1 with IL-7 and SCF for 1 wk. The progenies were analyzed for Thy1 and NKp46 expression and Thy1+NKp46+ cells were further analyzed for Rorc(γt)-EGFP expression. Data in A–C are representative of four independent experiments with three or more mice per group in each experiment, and data in D and E are representative of ≥10 replicates per experimental group in two independent experiments (mean ± SEM). *, P ≤ 0.05 by two-tailed Student’s t test.
Figure 5.
Figure 5.
IL-18Rα+ ILCs with similar properties are found in Rag1−/− mouse lungs. (A) LinTbetThy1+CD127+RORγt cells in adult Rag1−/− mouse lungs were sequentially gated and divided into IL-18Rα+ST2 (green) and IL-18RαST2+ (black) subsets. (B) Expression of GATA-3 and CD25 by lung IL-18Rα+ ILCs (green) and ST2+ ILC2s (black) in A as well as lung NK cells (NKp46+Eomes+Tbet+; filled gray) is shown. (C) LinThy1+CD127+ cells from Rag1−/− mouse lungs were sorted into IL-18Rα+ ILCs (green) and ST2+ ILC2s (black) and stimulated for 72 h with PMA and ionomycin. The amounts of cytokines and chemokines in the culture supernatants were determined. (D) Absolute numbers of IL-18Rα+ ILCs (green) and ST2+ ILC2s (black) gated as in A in naive, IL-18, and papain-treated lungs are shown in bar graphs. (E) LinThy1+CD127+IL-18Rα+ ILCs (green) and ST2+ ILC2s (black) were analyzed for intracellular IL-5 and IL-13 expression in naive, IL-18, and papain-treated lungs. Data are representative of five or more independent experiments with four or more mice per group in each experiment (mean ± SEM). **, P ≤ 0.01; ***, P ≤ 0.001 by two-tailed Student’s t test.
Figure 6.
Figure 6.
IL-18Rα+ ILCs in adult Rag1−/− mouse lungs have ILCP properties. BM ILCPs or lung LinThy1+CD127+IL-18Rα+ST2 cells were purified from papain-treated Rag1−/− mice (CD45.2) and injected (4,000 cells per mouse) intravenously into lethally irradiated Pep3b mice. The tissues of the recipient mice were analyzed 6 wk after transplantation. (A) Lung LinT-betThy1+CD127+Rorγt cells were sequentially gated, and IL-18Rα+ and ST2+ subsets were analyzed for donor-derived CD45.1CD45.2+ cells. (B) Liver T-bet+Eomes and T-bet+Eomes+ cells were gated for donor-derived ILC1s and NK cells. (C) Absolute numbers of donor-derived lung ILC2s, liver ILC1s, and NK cells. (D) BM ILCPs or lung IL-18Rα+ ILCs were purified as in A, and 1,000 cells each were cultured as in Fig. 4 D. The progenies were analyzed for Thy1 and NKp46 expression. Thy1+NKp46 cells were further analyzed for ICOS expression. Frequencies of the indicated subsets are shown in pie charts. (E) Lung IL-18Rα+ ILCs were cultured without or with IL-18 cultured as in Fig. 4 D. The Thy1+NKp46 cells were further analyzed for ST2 expression. The absolute numbers of the indicated subsets in each condition are shown in bar graphs. Data in A–C are representative of four or more independent experiments with four or more mice per group in each experiment, data in D are representative of ≥15 replicates per experimental group in two independent experiments, and data in E are representative of five or more replicates per experimental group in one experiment (mean ± SEM). *, P ≤ 0.05; **, P ≤ 0.01 by two-tailed Student’s t test. ns, not significant.
Figure 7.
Figure 7.
scRNA-seq analysis identifies two distinct ILC2 subsets in neonatal mouse lungs. (A) Gating strategy for purification of Linlo cells from 12-d-old neonatal RORα-YFP mouse lungs for scRNA-seq analysis. (B) t-SNE plot shows distinct clusters within the 21,256 sequenced cells. (C) Heatmap of the differentially expressed genes by the clusters from B. Top 10 differentially expressed transcripts of the lymphoid lineages are shown. (D) The ILC2 clusters from B were combined and subjected to further unsupervised clustering, which divided the 600 ILC2s into subset 1 (293 cells) and subset 2 (307 cells). Heatmap shows top 20 genes that are differentially expressed by the subsets 1 and 2. The arrows point to the genes that are mentioned in the text. (E) Heatmap shows the expression our selection of ILC(2)-associated genes by the subsets 1 and 2. The differentially expressed genes are shown by red (higher expression on subset 1) and purple (higher expression on subset 2) boxes. The rest of the genes are similarly expressed by the two subsets.
Figure S3.
Figure S3.
Gene expression analysis of neonatal ILC2s. (A) t-SNE plots showing expression of the indicated individual genes. (B) Heatmap shows the top genes that are differentially expressed (P ≤ 0.05) by adult (combined ILC2 subsets from Fig. 2 D) and neonatal ILC2s (combined ILC2 subsets from Fig. 7 D). The arrows point to the activation-associated genes Arg1, Il13, Il5, and Klrg1.
Figure S4.
Figure S4.
Differential gene expression analysis of the neonatal lung ILC2 subsets. (A and B) Heatmap shows all the genes that are differentially expressed (P ≤ 0.05) by neonatal ILC2 subsets. Genes that have higher expression in subset 1 than subset 2 (A), as well as genes that have higher expression in subset 2 than subset 1 (B), are shown. The arrows point to the genes that are mentioned in the text.
Figure 8.
Figure 8.
Trajectory analysis of scRNA-seq neonatal lung ILC2s identifies effector ILC2 subsets and ILC progenitor-like cells in the neonatal lung. (A) A single-cell trajectory was constructed from the neonatal ILC2 dataset in Fig. 4 D using the Monocle package, and neonatal ILC2s were ordered in pseudotime along a tree-like differentiation trajectory. Five distinct segments or states of the trajectory were identified. (B) Heatmap of the expression of ILC2-associated genes in the indicated states in A. (C) Changes in the expression of the indicated ILC2-associated genes along cell fate progression in pseudotime, from state 1 to states 4 and 5 in A. (D) The cells from states 1, 4, and 5 were combined and subjected to further unsupervised clustering using Seurat package, which divided them into three distinct subsets, namely ILCP (95 cells), proinflammatory (175 cells), and tissue-repairing (247 cells) ILC2 subsets. Heatmap shows top 20 genes that are differentially expressed by the subsets. The arrows point to the genes that are mentioned in the text.
Figure S5.
Figure S5.
Differential gene expression analysis of the neonatal lung ILC2 states defined by trajectory analysis. (A) Heatmap of the expression of ILC2-associated genes in the indicated states. (B) Heatmap shows the genes that are differentially expressed (P ≤ 0.01) among the indicated states. (C) Changes in the expression of the indicated genes along cell fate progression in pseudotime, from state 1 to states 4 and 5. (D) Heatmap shows the expression our selection of ILC(2)-associated genes by neonatal ILCPs and proinflammatory and tissue-repairing ILC2s in Fig. 8 D. The differentially expressed genes are shown in green (higher expression on ILCPs), red (higher expression on proinflammatory ILC2s), and purple (higher expression on tissue-repairing ILC2s) boxes. The rest of the genes are similarly expressed by the two subsets.
Figure 9.
Figure 9.
ILCPs are found in neonatal mouse lungs. (A) LinThy1+CD127+ cells from neonatal (12-d-old) lung, adult, and neonatal (12-d-old) BM from Tcf7EGFP mice were sequentially gated and divided into Tcf7EGFP+ST2 (green) and Tcf7EGFP−ST2+ (black) subsets and analyzed for the expression of IL-18Rα and Kit. (B) BM ILCPs defined by LinThy1+CD127+Tcf7EGFP+ST2 (IL-18Rα+Kit+) and lung ILCPs defined by LinThy1+CD127+Tcf7EGFP+ST2IL-18Rα+Kit+ were cultured on OP9 with IL-7 and SCF for 1 wk. The progenies were analyzed for ICOS and NK1.1 expression, and the frequencies of the indicated subsets are shown in pie charts. Data in A are representative of two independent experiments with two or more mice per group in each experiment, and data in B are representative of three replicates per experimental group in one experiment.
Figure 10.
Figure 10.
Flow cytometric and functional analysis shows distinct effector ILC2 subsets in neonatal mouse lungs. (A) LinST2+Thy1+CD127+ ILC2s from 12-d-old B6 mouse lungs were analyzed for KLRG1 and ICOS expression. The expression of ST2 and CD127 by the KLRG1+ICOS (red) and KLRG1ICOS+ (purple) subsets were overlapped in dot plot. (B) Neonatal ILC2s were divided into four subsets based on KLRG1 and ICOS expression, purified, and cultured for the indicated number of hours with IL-33 and IL-7 (1 ng/ml each for cytokine and 10 ng/ml for amphiregulin analysis). The amounts of IL-5, IL-13, and amphiregulin in the culture supernatants were determined by ELISA. (C) ILC2s from neonatal, naive, and papain-treated WT and Il33−/− mouse lungs were analyzed for KLRG1 and ICOS expression. The frequencies of KLRG1+, ICOS+, and KLRG1ICOS subsets are shown in bar graphs. Data are representative of three to five independent experiments with ≥12 mice per group (mean ± SEM). *, P ≤ 0.05; **, P ≤ 0.01; ***, P ≤ 0.001; ****, P ≤ 0.0001 by two-tailed Student’s t test.

References

    1. Artis D., and Spits H.. 2015. The biology of innate lymphoid cells. Nature. 517:293–301. 10.1038/nature14189 - DOI - PubMed
    1. Bando J.K., Nussbaum J.C., Liang H.-E., and Locksley R.M.. 2013. Type 2 innate lymphoid cells constitutively express arginase-I in the naive and inflamed lung. J. Leukoc. Biol. 94:877–884. 10.1189/jlb.0213084 - DOI - PMC - PubMed
    1. Björklund Å.K., Forkel M., Picelli S., Konya V., Theorell J., Friberg D., Sandberg R., and Mjösberg J.. 2016. The heterogeneity of human CD127(+) innate lymphoid cells revealed by single-cell RNA sequencing. Nat. Immunol. 17:451–460. 10.1038/ni.3368 - DOI - PubMed
    1. Butler A., Hoffman P., Smibert P., Papalexi E., and Satija R.. 2018. Integrating single-cell transcriptomic data across different conditions, technologies, and species. Nat. Biotechnol. 36:411–420. 10.1038/nbt.4096 - DOI - PMC - PubMed
    1. Carneiro F.R.G., Ramalho-Oliveira R., Mognol G.P., and Viola J.P.B.. 2011. Interferon regulatory factor 2 binding protein 2 is a new NFAT1 partner and represses its transcriptional activity. Mol. Cell. Biol. 31:2889–2901. 10.1128/MCB.00974-10 - DOI - PMC - PubMed

Publication types