. 2019 Dec 5;11(12):1945.
doi: 10.3390/cancers11121945.

GLUL Ablation Can Confer Drug Resistance to Cancer Cells via a Malate-Aspartate Shuttle-Mediated Mechanism

Affiliations

GLUL Ablation Can Confer Drug Resistance to Cancer Cells via a Malate-Aspartate Shuttle-Mediated Mechanism

Magesh Muthu et al. Cancers (Basel). .

Abstract

Glutamate-ammonia ligase (GLUL) is important for acid-base homeostasis, ammonia detoxification, cell signaling, and proliferation. Here, we reported that GLUL ablation conferred resistance to several anticancer drugs in specific cancer cell lines while leaving other cell lines non-resistant to the same drugs. To understand the biochemical mechanics supporting this drug resistance, we compared drug-resistant GLUL knockout (KO) A549 non-small-cell lung carcinoma (NSCLC) cells with non-resistant GLUL KO H1299 NSCLC cells and found that the resistant A549 cells, to a larger extent, depended on exogenous glucose for proliferation. As GLUL activity is linked to the tricarboxylic acid (TCA) cycle via reversed glutaminolysis, we probed carbon flux through both glycolysis and TCA pathways by means of 13C5 glutamine, 13C5 glutamate, and 13C6 glucose tracing. We observed increased labeling of malate and aspartate in A549 GLUL KO cells, whereas the non-resistant GLUL KO H1299 cells displayed decreased 13C-labeling. The malate and aspartate shuttle supported cellular NADH production and was associated with cellular metabolic fitness. Inhibition of the malate-aspartate shuttle with aminooxyacetic acid significantly impacted upon cell viability with an IC50 of 11.5 μM in resistant GLUL KO A549 cells compared to 28 μM in control A549 cells, linking resistance to the malate-aspartate shuttle. Additionally, rescuing GLUL expression in A549 KO cells increased drug sensitivity. We proposed a novel metabolic mechanism in cancer drug resistance where the increased capacity of the malate-aspartate shuttle increased metabolic fitness, thereby facilitating cancer cells to escape drug pressure.

Keywords: GLUL; LC-MS; NSCLC; drug resistance; glutamine; glycolysis; metabolism; metabolomics; targeted metabolomics.


Conflict of interest statement

The authors declare no conflict of interest.

Figures
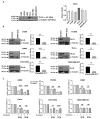
Figure 1
Figure 1
Reduced GLUL expression induced drug resistance. (A) GLUL (glutamate-ammonia ligase) protein expression was analyzed in different cancer cell lines. (B) Cell lines were either transfected with scrambled (siControl) or with siRNA GLUL as noted, and levels of GLUL protein expression were analyzed by western blotting. The western blot membranes were subsequently probed with an anti-tubulin antibody to assess equal loading. The presence of GLUL and tubulin protein is indicated on the right side of each blot. The approximate location of various molecular weight markers is indicated on the left side of each blot. kDa, kilo Dalton. (C) GLUL knockdown cell lines were treated with 20 and 30 nM of docetaxel for 72 h, and the cell viability was quantified by MTS assay. The standard error (SE) bars in cell viability graphs represent means of three independent experiments. The data are shown as mean ± SEM; p-values were determined using a two-tailed unpaired t-test; **** p ≤ 0.0001; ** p ≤ 0.002; ns—not significant.
Figure 2
Figure 2
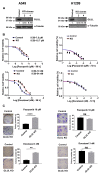
CRISPR/Cas9-mediated GLUL KO (knockout) conferred drug resistance in A549 but not in H1299 (A) A549 and H1299 cells were transfected with either negative controls (Lentiviral-empty vector) or Lentiviral CRISPR/Cas9-GLUL guide RNAs. Subsequently, cell lysates were analyzed by western blot (WB, see Methods) for GLUL expression, and individual clones devoid of GLUL expression were selected. The western blot membranes were subsequently probed with an anti-tubulin antibody to assess equal loading. The presence of GLUL and tubulin proteins are indicated on the right side of each blot. The signals for the GLUL and α-tubulin proteins were quantified by densitometry, and the numbers below GLUL blots indicate levels of GLUL protein in each lane following normalization of the signals with tubulin levels. For comparison, the signal intensity of GLUL in the control lane was assigned an arbitrary value of 1. The approximate location of various molecular weight markers is indicated on the left side of each blot. kDa, kilo Dalton. (B) A549 and H1299 control (DMSO-treated) or GLUL KO cells were treated with the indicated chemotherapeutic drugs, and the cell viability was analyzed by MTS assay after 72–96 h. IC50 for each drug was determined as indicated. (C) A549 and H1299 control and GLUL KO cells were treated with the indicated drugs and subjected to clonogenic assay. Histograms represent a total number of colonies counted, and the representative images of crystal violet stained cells are shown. The standard error (SE) bars in cell viability assay and clonogenic assay represent the means of three independent experiments. The data are shown as mean ± SEM; p-values were determined using a two-tailed unpaired t-test; **** p ≤ 0.0001; ** p ≤ 0.004, * p ≤ 0.01, ns—not significant.
Figure 3
Figure 3
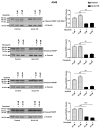
GLUL KO drug-resistant cells displayed reduced apoptosis. A549 control (DMSO-treated) or GLUL KO (cl3) cells were treated with various chemotherapeutic drugs for 12–18 h, as indicated. Subsequently, the expression of poly(ADP-ribose) polymerase (PARP)/cleaved PARP and α-tubulin were analyzed by western blot. Quantification of protein levels is presented on the ride side of each western blot, and the approximate location of various molecular weight markers is indicated on the left side of each blot. kDa, kilo Dalton. The data are shown as mean ± SEM; p-values were determined using a two-tailed unpaired t-test; ** p ≤ 0.001.
Figure 4
Figure 4
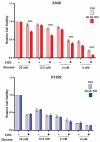
A549 GLUL KO cells displayed sensitivity to glucose deprivation. A549 and H1299 (control and GLUL KO) cells were cultured in various concentrations of glucose as indicated and were treated with 5 mM of 2-DG for 72 h, and the cell viability was analyzed by MTS assay. Data for each pair of cell lines (control/GLUL KO) was normalized to the data for the highest concentration of glucose (25 mM), as shown above. The data are shown as ± standard deviation. The standard deviation (SD) bars in the cell viability graph represent the means of three independent experiments. The data are shown as mean ± SD; p-values were determined using a two-way ANOVA; **** p ≤ 0.001.
Figure 5
Figure 5
Increased flux through the malate-aspartate shuttle mediated drug resistance in A549 GLUL KO cells. Schematic illustration of a cell with mitochondria (intermembrane space + mitochondrial matrix). Superimposed are %-fractional labeling for various metabolic intermediates; glucose-6-phosphate/fructose-6-phosphate (G6P/F6P), fructose-1,6-bisphosphate (F1,6BP), dihydroxyacetone phosphate/glyceraldehyde-3-phosphate (DHAP/GA3P), citrate (CIT), α-ketoglutarate (α-KG), malate (MAL), aspartate (ASP), glutamate (GLU), oxaloacetate (OXALac), acetyl-coenzyme-A (AcCoA), pyruvate (PYR), coenzyme-A (CoA). Aspartate aminotransferase (AAT). Significance using unpaired students t-test * (<0.05), ** (<0.005), *** (<0.0005).
Figure 6
Figure 6
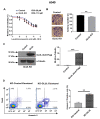
Targeting the malate-aspartate shuttle or GLUL expression re-sensitized drug-resistant A549 GLUL KO cells. (A) A549 GLUL KO/control cells (DMSO-treated) or treated with inhibitor aminooxyacetic acid at the concentrations were indicated. The cell viability was analyzed by MTS assay, and the IC50 values were determined as noted above (negative control (28 µM)—95% confidence interval (CI)-2.245e-005 to 3.591e-005 and GLUL KO (11.5 µM)—95% CI-8.416e-006 to 1.581e-005). The standard error (SE) bars in the cell viability curve represent means of three independent experiments. (B) Both control and GLUL KO cells were treated with the mentioned dose of aminooxyacetic acid for 12 days and subjected to colony formation assay. The column in the histogram represents the total number of colonies counted, and the colonies were photographed. (C) For GLUL overexpression, Flag-pcDNA3.1-GLUL cDNA clone and Flag-pcDNA3.1-empty vector were transfected in KO cells, and after 72 h, the cell lysates were analyzed by western blotting (WB) as in methods for GLUL expression levels, as shown above. The western blot membranes were subsequently probed with an anti-tubulin antibody to assess equal loading. The presence of Flag-tag-GLUL protein is indicated on the right side of the blot, and the quantification of protein levels are represented. The approximate location of various molecular weight is indicated on the left side of each blot. kDa, kilodalton. (D) Flow cytometric analysis of apoptosis assay; A549 GLUL KO cells expressing Flag-pcDNA3.1-empty vector were treated with DMSO (control), and Flag-pcDNA3.1-GLUL were treated with docetaxel (20 nM) treatment for 12 h, and the cells were stained with 7-Aminoactinomycin D (7-AAD) and annexin V. The % of annexin V positive cells were measured and represented. The standard error (SE) bars, in the apoptosis assay, represent the means of two independent experiments. The data are shown as mean ± SEM; p-values were determined using a two-tailed unpaired t-test; ** p ≤ 0.01, *** p ≤ 0.001.

Similar articles

Cited by

References

    1. Stronach E.A., Alfraidi A., Rama N., Datler C., Studd J.B., Agarwal R., Guney T.G., Gourley C., Hennessy B.T., Mills G.B., et al. HDAC4-regulated STAT1 activation mediates platinum resistance in ovarian cancer. Cancer Res. 2011;71:4412–4422. doi: 10.1158/0008-5472.CAN-10-4111. - DOI - PMC - PubMed
    1. Patel C., Stenke L., Varma S., Lindberg M.L., Bjorkholm M., Sjoberg J., Viktorsson K., Lewensohn R., Landgren O., Gottesman M.M., et al. Multidrug resistance in relapsed acute myeloid leukemia: EVIDENCE of biological heterogeneity. Cancer. 2013;119:3076–3083. doi: 10.1002/cncr.28098. - DOI - PMC - PubMed
    1. Haffner M.C., Mosbruger T., Esopi D.M., Fedor H., Heaphy C.M., Walker D.A., Adejola N., Gurel M., Hicks J., Meeker A.K., et al. Tracking the clonal origin of lethal prostate cancer. J. Clin. Investig. 2013;123:4918–4922. doi: 10.1172/JCI70354. - DOI - PMC - PubMed
    1. Leary M., Heerboth S., Lapinska K., Sarkar S. Sensitization of Drug Resistant Cancer Cells: A Matter of Combination Therapy. Cancers. 2018;10:483. doi: 10.3390/cancers10120483. - DOI - PMC - PubMed
    1. Gottesman M.M. Mechanisms of cancer drug resistance. Annu. Rev. Med. 2002;53:615–627. doi: 10.1146/annurev.med.53.082901.103929. - DOI - PubMed

Grants and funding