Co-Evaporated CuO-Doped In2O3 1D-Nanostructure for Reversible CH4 Detection at Low Temperatures: Structural Phase Change and Properties
- PMID: 31817624
- PMCID: PMC6947606
- DOI: 10.3390/ma12244073
Co-Evaporated CuO-Doped In2O3 1D-Nanostructure for Reversible CH4 Detection at Low Temperatures: Structural Phase Change and Properties
Abstract
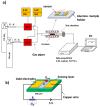
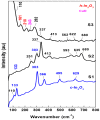
In order to improve the sensitivity and to reduce the working temperature of the CH4 gas sensor, a novel 1D nanostructure of CuO-doped In2O3 was synthesized by the co-evaporation of Cu and In granules. The samples were prepared with changing the weight ratio between Cu and In. Morphology, structure, and gas sensing properties of the prepared films were characterized. The planned operating temperatures for the fabricated sensors are 50-200 °C, where the ability to detect CH4 at low temperatures is rarely reported. For low Cu content, the fabricated sensors based on CuO-doped In2O3 showed very good sensing performance at low operating temperatures. The detection of CH4 at these low temperatures exhibits the potential of the present sensors compared to the reported in the literature. The fabricated sensors showed also good reversibility toward the CH4 gas. However, the sensor fabricated of CuO-mixed In2O3 with a ratio of 1:1 did not show any response toward CH4. In other words, the mixed-phase of p- and n-type of CuO and In2O3 materials with a ratio of 1:1 is not recommended for fabricating sensors for reducing gas, such as CH4. The gas sensing mechanism was described in terms of the incorporation of Cu in the In2O3 matrix and the formation of CuO and In2O3 phases.
Keywords: 1D-nanostructures; copper-doped tin oxide; methane gas sensor; thermal evaporation.
Conflict of interest statement
The authors declare no conflict of interest.
Figures


References
-
- Navazani S., Shokuhfar A., Hassanisadi M., Di Carlo A., Nia N.Y., Agresti A. A PdPt decorated SnO2-rGO nanohybrid for high-performance resistive sensing of methane. J. Taiwan Inst. Chem. Eng. 2019;95:438–451. doi: 10.1016/j.jtice.2018.08.019. - DOI
-
- Horastani Z.K., Sayedi S.M., Sheikhi M.H., Rahimi E. Effect of silver additive on electrical conductivity and methane sensitivity of SnO2. Mater. Sci. Semicond. Process. 2015;35:38–44. doi: 10.1016/j.mssp.2015.02.039. - DOI
-
- Xue D., Zhang S., Zhang Z. Hydrothermally prepared porous 3D SnO2 microstructures for methane sensing at lower operating temperatures. Mater. Lett. 2019;237:336–339. doi: 10.1016/j.matlet.2018.11.129. - DOI
-
- Bunpang K., Wisitsoraat A., Tuantranont A., Singkammo S., Phanichphant S., Liewhiran C. Highly selective and sensitive CH4 gas sensors based on flame-spray-made Cr-doped SnO2 particulate films. Sens. Actuators B Chem. 2019;291:177–191. doi: 10.1016/j.snb.2019.04.049. - DOI
Grants and funding
LinkOut - more resources
Full Text Sources

