Review
. 2019 Dec 6;12(24):4083.
doi: 10.3390/ma12244083.

Review of the Quench Sensitivity of Aluminium Alloys: Analysis of the Kinetics and Nature of Quench-Induced Precipitation

Affiliations
Review

Review of the Quench Sensitivity of Aluminium Alloys: Analysis of the Kinetics and Nature of Quench-Induced Precipitation

Benjamin Milkereit et al. Materials (Basel). .

Abstract

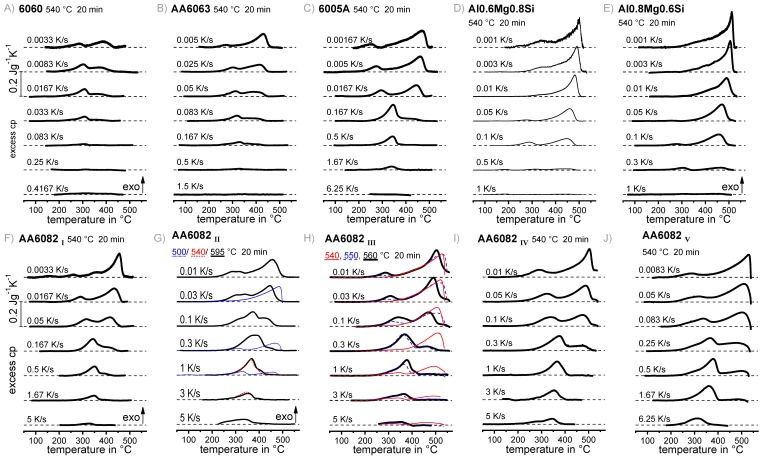
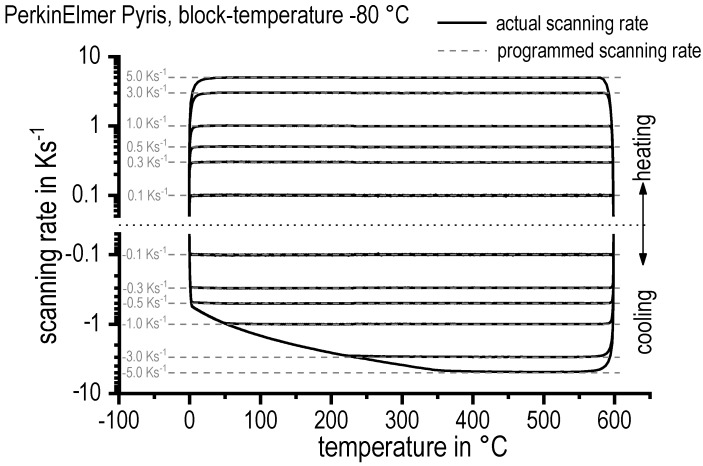
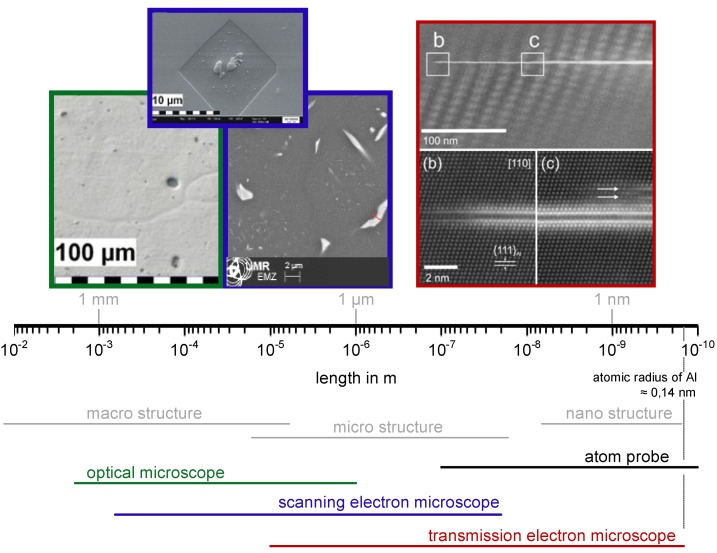
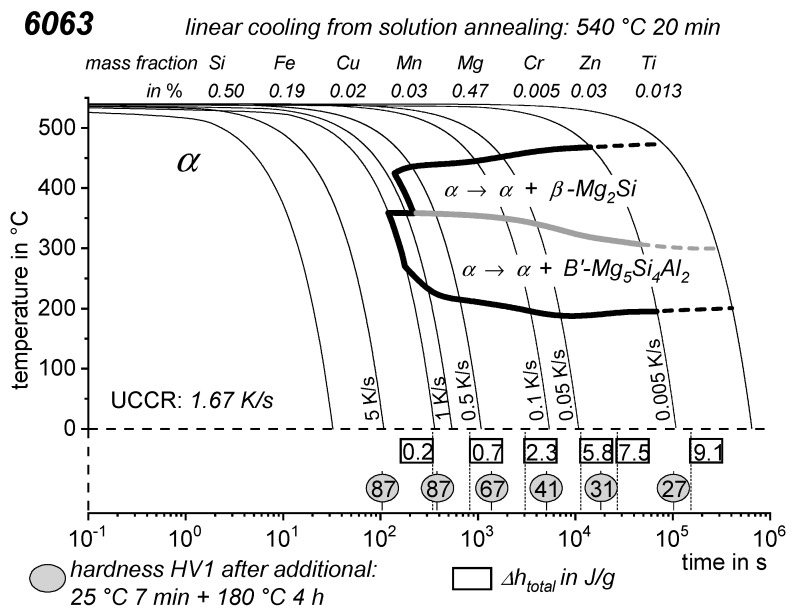
For aluminium alloys, precipitation strengthening is controlled by age-hardening heat treatments, including solution treatment, quenching, and ageing. In terms of technological applications, quenching is considered a critical step, because detrimental quench-induced precipitation must be avoided to exploit the full age-hardening potential of the alloy. The alloy therefore needs to be quenched faster than a critical cooling rate, but slow enough to avoid undesired distortion and residual stresses. These contrary requirements for quenching can only be aligned based on detailed knowledge of the kinetics of quench-induced precipitation. Until the beginning of the 21st century, the kinetics of relevant solid-solid phase transformations in aluminium alloys could only be estimated by ex-situ testing of different properties. Over the past ten years, significant progress has been achieved in this field of materials science, enabled by the development of highly sensitive differential scanning calorimetry (DSC) techniques. This review presents a comprehensive report on the solid-solid phase transformation kinetics in Al alloys covering precipitation and dissolution reactions during heating from different initial states, dissolution during solution annealing and to a vast extent quench-induced precipitation during continuous cooling over a dynamic cooling rate range of ten orders of magnitude. The kinetic analyses are complemented by sophisticated micro- and nano-structural analyses and continuous cooling precipitation (CCP) diagrams are derived. The measurement of enthalpies released by quench-induced precipitation as a function of the cooling rate also enables predictions of the quench sensitivities of Al alloys using physically-based models. Various alloys are compared, and general aspects of quench-induced precipitation in Al alloys are derived.

Keywords: AlCu wrought alloys; AlMgSi wrought alloys; AlSi wrought alloys; AlSiMg cast alloys; AlZnMg wrought alloys; DSC; aluminium alloys; kinetics; quench induces precipitation; quench sensitivity.


Conflict of interest statement

The authors declare no conflict of interest.

Figures

Figure A1
Figure A1
Comparison of DSC cooling curves for 10 different AlMgSi alloys.
Figure A2
Figure A2
Comparison of the continuous cooling precipitation diagrams, the total specific precipitation enthalpies after cooling and hardness after additional artificial ageing, for 9 different AlMgSi alloys.
Figure A3
Figure A3
Comparison of DSC cooling curves for 10 different AlZnMg(Cu) alloys. The ordinate scaling is identical for all alloys except 7049A, for which the distance of the shifted zero-levels is doubled.
Figure A4
Figure A4
Comparison of the continuous cooling precipitation diagrams, the total specific precipitation enthalpies after cooling and hardness after additional artificial ageing, for 10 different AlZnMg(Cu) alloys.
Figure 1
Figure 1
Simplified temperature-time profile of heat treatments within the production of structural Al products (SSS supersaturated solid solution, QIP quench-induced precipitates).
Figure 2
Figure 2
Pseudo-binary phase diagram for Al-Mg2Si (adapted from [5]) and schematic temperature-time profile of an age-hardening procedure.
Figure 3
Figure 3
Example of a model for diffusion-controlled precipitation reactions [82]: (A) plotted on a linear time scale; (B) plotted on a logarithmic time scale.
Figure 4
Figure 4
Construction scheme of a power-compensated scanning calorimeter (PerkinElmer Instruments). S: Sample furnace with sample in crucible; R: reference-furnace (analogous to sample-furnace); 1: heating wire; 2 resistance thermometer. Both sensors are separated from each other and located in surroundings at constant temperature (cold block) [113].
Figure 5
Figure 5
Basic time-temperature profile of DSC experiments.
Figure 6
Figure 6
Comparison of two basic measurement set-ups: (A) a sample versus an empty reference sensor, acquiring the specific heat capacity of the sample; (B) a sample versus an inert reference sample of similar heat capacity, acquiring the specific excess heat capacity of the sample compared to the reference.
Figure 7
Figure 7
Quality attributes of DSC raw data. A & B show the same raw data, measured by cooling an AlCuMg alloy with 0.3 K/s in a PerkinElrmer Pyris 1 DSC. (A) Overshoot artefacts and the quality attribute of the heat flow difference between the high- and low-temperature isotherm, are highlighted; (B) the quality attribute of heat flow difference between sample and baseline measurements in the isothermal section at high-temperatures is highlighted.
Figure 8
Figure 8
Effects of inadequate or adequate sample packing in a CALVET-type heat flux differential scanning calorimeter under otherwise very similar experimental conditions: (A) heat flow of sample (HFS) and baseline (HFBL) measurements without sample packing showing substantially different heat flow in regions without phase transformations; (B) if the samples are packed properly HFS and HFBL are very similar in reaction-free temperature regions, i.e., subtracting HFBL from HFS results in a nearly straight zero-level.
Figure 9
Figure 9
DSC cooling curves of a pure binary Al-Si alloy covering a wide range of cooling rates. It can be seen that exothermic precipitation reactions at higher temperatures are only detected at slower cooling rates. Original data from [117].
Figure 10
Figure 10
Typical performance diagram of a PerkinElmer Pyris diamond DSC.
Figure 11
Figure 11
(A) Scanning rate ranges of different DSC devices and the quenching dilatometer; (B) related sample dimensions and masses (in the case of Al samples). In order to make the broad dynamic range easier knowable the cooling rate axis is complemented by the durations of cooling, which are needed to cover the temperature range of 540 to 20 °C (typical for the age-hardening of Al alloys).
Figure 12
Figure 12
Dimensions of quench-induced precipitation illustrated by micrographs from optical, scanning electron and transmission electron microscopy from an AlMgSi and an AlZnMgCu alloy.
Figure 13
Figure 13
Scheme of the different analyses required for construction of a complete continuous cooling precipitation diagram, illustrated here for alloy 7150.
Figure 14
Figure 14
Schematic presentation of heat treatments applied to alloys in this work (introduced in [128]): (A) variation in cooling rate; (B) interrupted cooling.
Figure 15
Figure 15
Continuous cooling precipitation diagram of 6063, as published in Ref. [146].
Figure 16
Figure 16
Heating DSC curves of 6082III in initial state T651, [148].
Figure 17
Figure 17
Schemes for (A) a precipitation process from a homogeneously distributed solid solution covering time steps t1 to t2; (B) dissolution of a precipitate covering the time steps t3 to t4, t4−t3 < t2−t1.
Figure 18
Figure 18
DSC heating at 0.1 K/s for the alloys (A) 6005A; (B) 6016; and (C) 6181 with the initial conditions T4 and T6, and in case of 6005A overaged (solution treated, over-critically quenched and aged at 200 °C for 10 h) [120].
Figure 19
Figure 19
(A) Enthalpy change of 6005A T4 during heating to 580 °C; (BE) enthalpy levels of 6005A for initial conditions T4 and T6, over-aged and soft annealed, respectively, covering the heating rate range 0.01 to 5 K/s [120].
Figure 20
Figure 20
Schematic development of the enthalpy level Δh for different temperature-time profiles with final reheating (RH). (A) Slow cooling (sc) from solution treatment to room temperature; (B) slow cooling from solution treatment to a certain temperature and interruption by overcritical cooling; (C) arbitrary types of ageing after overcritical cooling from solution treatment; and (D) overcritical cooling (oc) from solution treatment.
Figure 21
Figure 21
Schematic development of the enthalpy levels of three different heat treatment states in a medium-strength AlMgSi alloy obtainable by reheating to a certain maximum temperature. Values are based on those of 6005A in [120]. The shaded area signifies the heating rate range covered by DSC in Ref. [120].
Figure 22
Figure 22
Direct cooling DSC curves of (A) Al0.26Si and (B) Al0.72Si in a range of cooling rates from 1 to 10−3 K/s; (C) DSC reheating curves of Al0.26Si after cooling at rates down to 3 × 10⁻⁵ K/s.
Figure 23
Figure 23
Enthalpy development by quench-induced precipitation. Combination of directly (blue triangles) and indirectly (red circles) measured results. Predictions obtained from model in Ref. [117].
Figure 24
Figure 24
OM images of “quench-induced” precipitation in Al0.72Si after cooling at different rates.
Figure 25
Figure 25
OM images of Barkers-etched Al0.72Si samples after two different cooling rates, revealing that the vast majority of quench-induced precipitation occurs inside the grains.
Figure 26
Figure 26
SEM-SE images of quench-induced precipitates in Al0.72Si after cooling at 0.01 K/s. Left: Polygonal particle originating from the HTR; middle and right: needle-/plate-shaped particles from the LTR [132].
Figure 27
Figure 27
BF-STEM images of hexagonal Si plate in Al0.72Si after cooling at 0.1 K/s, zone axis [001]Al [132].
Figure 28
Figure 28
BF-STEM images of a thin plate formed from cooling at 0.1 K/s (pure Si, diamond cubic), standing out from the Al matrix in three different rotations: (A) −40°; (B) 0° (zone axis [001]Al); and (C) 40° [132].
Figure 29
Figure 29
CCP diagram of Al0.72Si. Instead of hardness values, the mass fraction of Si supersaturation is stated.
Figure 30
Figure 30
(A) Cooling DSC curves for 6005A; and (B) related specific precipitation enthalpy after cooling and hardness after subsequent ageing.
Figure 31
Figure 31
Upper critical cooling rates for nine different AlMgSi alloys and two binary AlSi alloys as a function of their total Mg+Si content.
Figure 32
Figure 32
(A) Cooling resulting from placing one end of the experimental bar in water, measured at a distance of 5.5 cm from the bar end; (B) “instantaneous cooling rate as a function of temperature (as given in A). The points indicate the start (Ps) and end (Pf) of precipitation [25].” Digitized data from Ref. [25].
Figure 33
Figure 33
CCP diagram for 6063 obtained by DSC [128] comparing the data points (red) of Ref. [25].
Figure 34
Figure 34
Cooling DSC curves for 6063 in a narrow range of cooling rates at higher excess cp magnification, indicating at least four separate peaks below the two major reaction regions.
Figure 35
Figure 35
Quench-induced precipitation in 6005A after different cooling rates [128]: (A) OM and (B) SEM secondary electron micrographs of quench-induced β-Mg2Si particles originating from the HTRs; (C) TEM images of quench-induced rod-shaped B’ or β’ particles. In each case, the particle dimensions are substantially reduced with increasing cooling rate.
Figure 36
Figure 36
Microstructure of 6005A alloy samples investigated at different temperatures: (A) using SEM backscattered electron images at a cooling rate of 0.0016 K/s; and (B) using bright-field TEM at a cooling rate of 0.16 K/s [128].
Figure 37
Figure 37
Bright-field TEM micrograph of a 6005A specimen after cooling at 0.16 K/s [128].
Figure 38
Figure 38
BF-TEM images of a quench-induced hexagonal Si plate particle, precipitated in 6005A cooled from 540 °C 20 in at 0.167 K/s to 375 °C.
Figure 39
Figure 39
Microstructural details of 6005A: (AC) SEM secondary electron images of Mg2Si particles after very slow cooling (0.00083 K/s), which all seem to be nucleated on coarse primary Fe-rich particles [128,138]. (A,B) Intragrannular precipitated Mg2Si plates in two perpendicular alignments; (C) Mg2Si precipitate on the grain boundary; (D) TEM-BF image of rod-shaped precipitate from LTR during cooling with 0.16 K/s to 225 °C (β’/B’, [118,128]). Nucleation seems to take place on an Mn-rich dispersoid particle [128].
Figure 40
Figure 40
Comparison of measured and predicted values for the specific precipitation enthalpies and hardness after artificial ageing as a function of cooling rate for four AlMgSi alloys. The specific precipitation enthalpy values are plotted for total reactions (black squares), high-temperature reactions (red triangle, tip upwards) and low-temperature reactions (blue triangle, tip downwards). (A) 6063; (B) 6005A; (C) 6082I; and (D) 6082V [118].
Figure 41
Figure 41
Comparison of hardness after ageing and total precipitation enthalpy predicted by the model from Ref. [118] for alloys 6063, 6082I and 6082V.
Figure 42
Figure 42
DSC cooling curves for (A) 6082 I and (B) Al0.6Mg0.8Si; (C) total specific precipitation enthalpies; and (D) hardness after ageing of both alloys as functions of cooling rate.
Figure 43
Figure 43
OM images of Al0.6Mg0.8Si after cooling at 0.01 K/s and 0.1 K/s.
Figure 44
Figure 44
Three different fcc β-Mg2Si phase particles in Al0.8Mg0.6Si after cooling at 0.1 K/s. The particles have different orientation relationships with the matrix (TEM work by Shravan Kairy and Matthew Weyland, Monash University, Melbourne, Australia).
Figure 45
Figure 45
Fine quench-induced hexagonal β′-Mg9Si5 particles after cooling Al0.6Mg0.8Si at 0.1 K/s. The β′-particles apparently contain disordered areas (TEM work by Shravan Kairy and Matthew Weyland, Monash University, Melbourne, Australia).
Figure 46
Figure 46
CCP diagram for 6082I [128,146].
Figure 47
Figure 47
CCP diagram for Al0.6Mg0.8Si.
Figure 48
Figure 48
Cooling DSC curves for 7020.
Figure 49
Figure 49
Cooling DSC curves for 7150.
Figure 50
Figure 50
Cooling DSC curves for 7150 and 7020, showing hints of a precipitation reaction at very low temperatures (150 to 50 °C) [133].
Figure 51
Figure 51
Quench-induced precipitation in 7150 during cooling at 3 K/s [129].
Figure 52
Figure 52
TEM image of an air-cooled 7150 sample (average cooling rate 1 K/s) showing a recrystallised grain on the left-hand side and several subgrains on the right. It can be seen that the quench-induced η-Mg(Zn,Al,Cu)2 precipitates preferentially nucleate at grain/subgrain boundaries and also appear inside the recrystallised grain, nucleating at Al3Zr dispersoids [119].
Figure 53
Figure 53
HAADF-STEM images of Y-phase platelets enriched in Zn and Cu after cooling of 7150 at 10 K/s, viewed from the [110]α direction, showing that the thickness varies along its length, with growth ledges indicated by arrows in (c). The regular pattern in the matrix on either side of the plate in (a) is an artefact caused by Moiré fringing between the lattice and scan frame. This plate appears to be nucleating from an attached void. Similar images in (eg) from a second plate, but viewed from the [112]α direction, show variations in thickness and stacking order along the length of the precipitate [143].
Figure 54
Figure 54
Ultimate tensile strength and yield strength of 7150 in the as-quenched and artificially aged conditions [143].
Figure 55
Figure 55
Measured values and model predictions for hardness after ageing and specific precipitation enthalpies of six AlZnMg(Cu) alloys [119]. Values for the total specific precipitation enthalpy were obtained by in situ cooling DSC as outlined above. For 7049A, chip-sensor based differential fast scanning calorimetry was applied [130,162].
Figure 56
Figure 56
Comparison of experimentally obtained specific precipitation enthalpies after cooling and hardness after additional ageing for three differently concentrated AlZnMgCu alloys.
Figure 57
Figure 57
(A) Raw 1000 K/s reheating curves for states previously cooled at rates of 10 K/s (first reheating) and 105 K/s (second reheating = baseline measurement). (B) Subtracted measurement curves, i.e., curves measured for the first reheating minus the curves measured for the second reheating, for various cooling rates. The baselines for integration are indicated by dashed lines [129].
Figure 58
Figure 58
(A) Specific precipitation enthalpy after cooling from solution annealing of alloy 7150, as a function of cooling rate measured by DFSC. (B) Specific precipitation enthalpy after cooling from solution annealing and Vickers hardness after subsequent ageing (120 °C 24 h) of alloy 7150, as a function of cooling rate. The enthalpy values obtained by DFSC are shown as average values and standard deviation for six samples. The solid lines are model predictions from Ref. [119]. The DSC and hardness data tested on large samples were published in Ref. [133]. Hardness was tested for samples at the millimetre scale at the same cooling rates, obtained using a quenching dilatometer [129].
Figure 59
Figure 59
Results for 7150, showing (A) the total enthalpy change at a cooling rate of 3 K/s measured by DFSC and DSC; (B) the DSC curve at a cooling rate of 3 K/s, shown for comparison. The vertical red dashed lines indicate the precipitation start and end temperatures. (C) Total enthalpy change at different interruption temperatures and different cooling rates. The enlarged dots indicate the transition temperatures for the various precipitation reactions [129].
Figure 60
Figure 60
Continuous cooling precipitation diagram for 7020 [146].
Figure 61
Figure 61
Complete continuous cooling precipitation diagram for 7150, covering seven orders of magnitude of cooling rates/cooling duration.
Figure 62
Figure 62
Evaluation of the characteristic transformation start and end temperatures from in situ measurements of the electrical resistivity [88]. Example of an average cooling rate of 0.7 K/s.
Figure 63
Figure 63
CCP diagram for 7050 obtained by in situ electrical resistivity measurements in Ref. [88]. Mass fractions of major alloying elements in %: 6.1 Zn, 2.15 Mg; 2.37 Cu.
Figure 64
Figure 64
CCP diagram for 7075II [161].
Figure 65
Figure 65
CCP diagram for alloy 7075 from Ref. [60] obtained by in situ voltage measurements. Mass fractions of major alloying elements in %: 5.44 Zn; 2.55 Mg; 1.37 Cu.
Figure 66
Figure 66
Comparison of two AlCu(Mg) alloys: (A) DSC cooling curves of 2024; (B) DSC cooling curves for 2219; (C) total specific precipitation enthalpies after cooling; and (D) hardness after additional ageing for both alloys.
Figure 67
Figure 67
CCP diagram for 2024 [146], revised version. Hardness values obtained after cooling and natural ageing.
Figure 68
Figure 68
CCP diagram for 2019 [146]. Hardness values obtained after cooling and artificial ageing.
Figure 69
Figure 69
Comparison of three different AlSiMg cast alloys: (A) cooling DSC curves for permanent mould-cast Al7Si0.3Mg, [214]; (B) cooling DSC curves for two variants of Al10Si0.3Mg—one of the variants was produced by high-pressure die-casting, the second by laser beam melting, [131,215]; (C,D) values of specific precipitation enthalpy and hardness after ageing for the three cast alloys.
Figure 70
Figure 70
Comparison of the initial microstructures of (a) as-cast and (b,c) as-LBM Al10Si0.3Mg [215].
Figure 71
Figure 71
Eutectic structure of Al10Si0.3Mg produced by high-pressure die-cast and LBM, for different soaking times at 525 °C.
Figure 72
Figure 72
Comparison of hardness after cooling and subsequent ageing for LBM Al10Si0.3Mg.
Figure 73
Figure 73
Comparison of specific precipitation enthalpies after cooling and hardness after subsequent ageing for the three AlSiMg cast alloys.
Figure 74
Figure 74
CCP diagram for Al7Si0.3Mg.
Figure 75
Figure 75
CCP diagram for high-pressure die-cast Al10Si0.3Mg.
Figure 76
Figure 76
CCP diagram of LBM Al10Si0.3Mg.
Figure 77
Figure 77
Dynamic behaviour of quench-induced precipitation in four substantially different Al-based alloys, (A) Al0.72Si, (B) 6082IV, (C) 7150, (D) 2024.
Figure 78
Figure 78
(A) Quasi-binary phase diagram for Al-Mg2Si (adapted from [5]). (BD) DSC cooling curves for three different alloys for which the applied solution treatment resulted in an incomplete dissolution. (E,F) DSC cooling curves for two different alloys for which the applied solution treatment resulted in complete dissolution. In (D,F), the same alloy is considered, although cooling started from two different temperatures: 540 °C and 560 °C. The mass fractions of Mg and Si for the different alloys are stated.
Figure 79
Figure 79
TEM-BF image of quench-induced B’-rods after air cooling (≈1 K/s) in a 6082 alloy (courtesy Shuncai Wang, University of Southampton, UK & Paul Rometsch, published in [118]).
Figure 80
Figure 80
Comparison of measurements and predictions of the volume fractions of Mg2Si precipitated during cooling in three different AlMgSi alloys [118].
Figure 81
Figure 81
DSC cooling curves for age-hardening Mg alloy WE43 [123].
Figure 82
Figure 82
Continuous cooling precipitation diagram of age-hardening Mg alloy WE43 [123].
Figure 83
Figure 83
X5CrNiCuNb16-4 (a) Selected DSC cooling curves of X5CrNiCuNb16-4 after austenitisation at 1100 °C, 30 min. The DSC peaks between about 1000 °C and 600 °C indicate the quench-induced precipitation of Cu-rich particles, while the strong peak below about 200 °C corresponds to the martensitic transformation. (b) Hardness as a function of the cooling rate in the quenched and in the quenched and aged conditions, adapted from [122].
Figure 84
Figure 84
(a) Continuous DSC cooling curves of Inconel 718; (b) hardness profile and specific precipitation heat depending on the cooling rate [122].

References

    1. Statista Global Raw-Steel Production from 2002 to 2017. ID153008, Recource: World Steel Association. [(accessed on 11 July 2018)]; Available online: https://de.statista.com/statistik/daten/studie/153008/umfrage/welt-rohst...
    1. Statista Global Production Amount of Major non-Ferrus Metals in 2013 and 2014. 323132 Resource: World Bureau of Metal Statistics. [(accessed on 11 July 2018)]; Available online: https://de.statista.com/statistik/daten/studie/323132/umfrage/produktion...
    1. Statista . American Foundry Society; [(accessed on 11 July 2018)]. Global Production of Castings from Various Metals in 2016. Ressources: European Foundry Association. Available online: https://de.statista.com/statistik/daten/studie/421534/umfrage/produktion...
    1. Statista Global Demand for Aluminum from 2006 to 2019. ID156039. [(accessed on 11 July 2018)]; Available online: https://de.statista.com/statistik/daten/studie/156039/umfrage/weltweite-...
    1. Polmear I.J. Light Alloys from Traditional Alloys to Nanocrystals. 4th ed. Elsevier Butterworth-Heinemann; Amsterdam, The Netherlands: 2006.

LinkOut - more resources