. 2019 Dec 6;11(12):658.
doi: 10.3390/pharmaceutics11120658.

Monitoring the Fate of Orally Administered PLGA Nanoformulation for Local Delivery of Therapeutic Drugs

Affiliations

Monitoring the Fate of Orally Administered PLGA Nanoformulation for Local Delivery of Therapeutic Drugs

Lucia Morelli et al. Pharmaceutics. .

Abstract

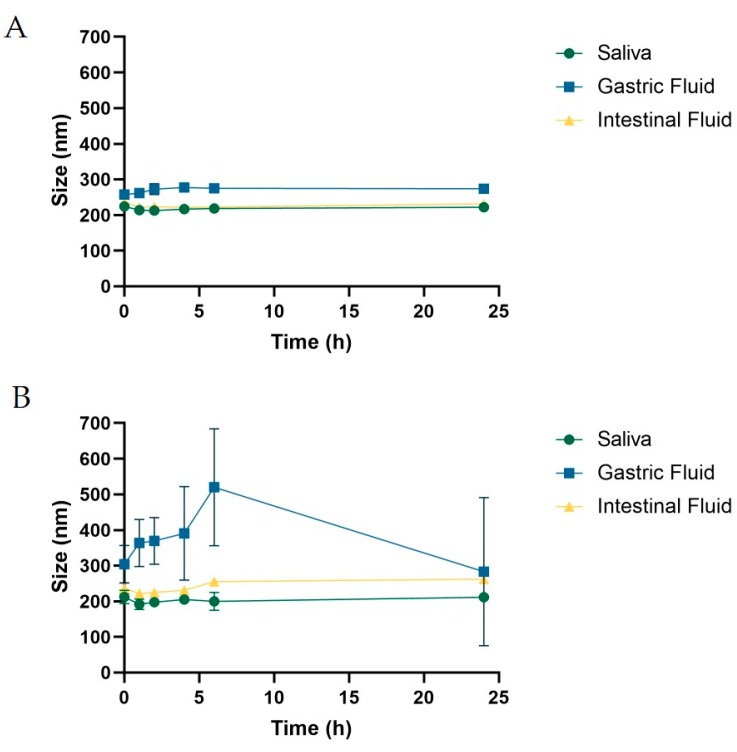
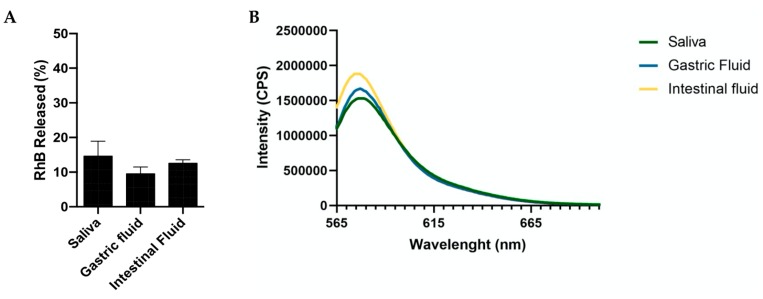
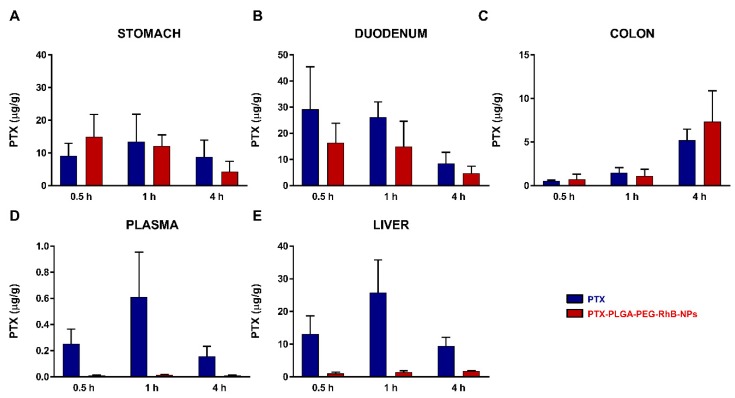
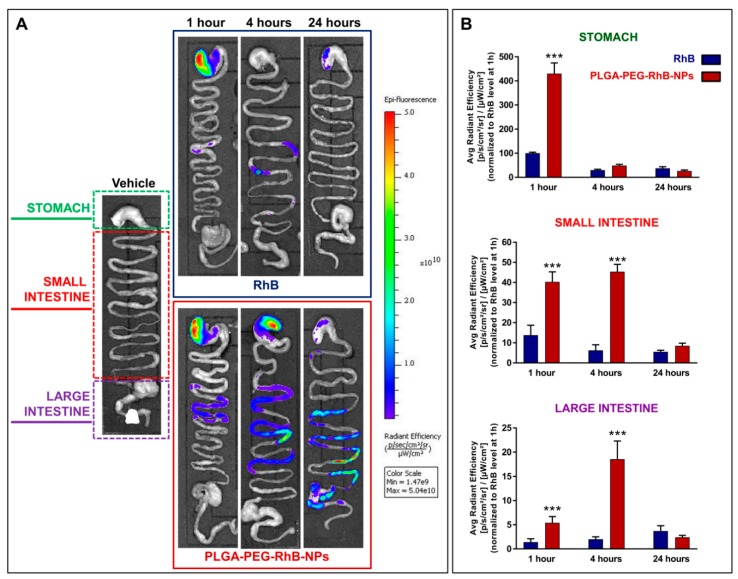
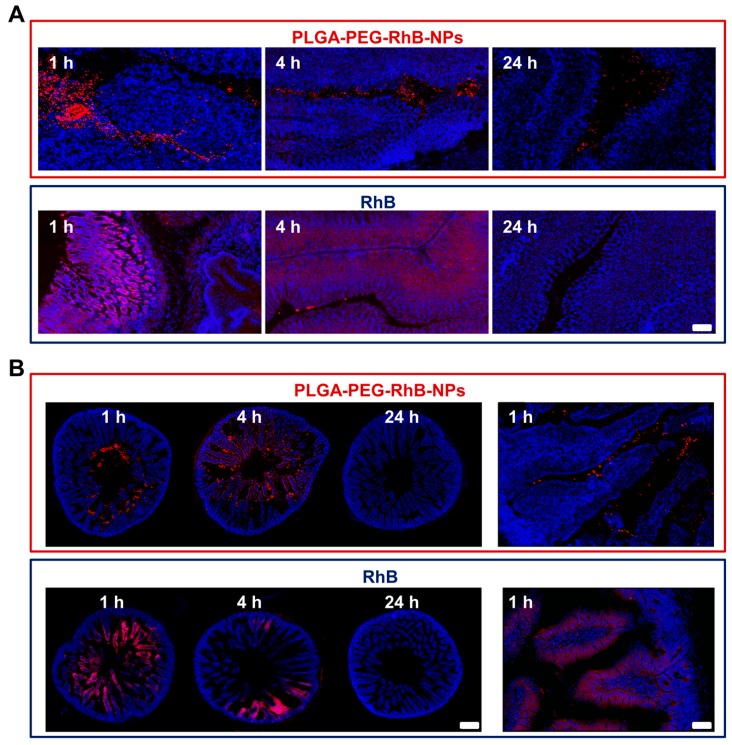
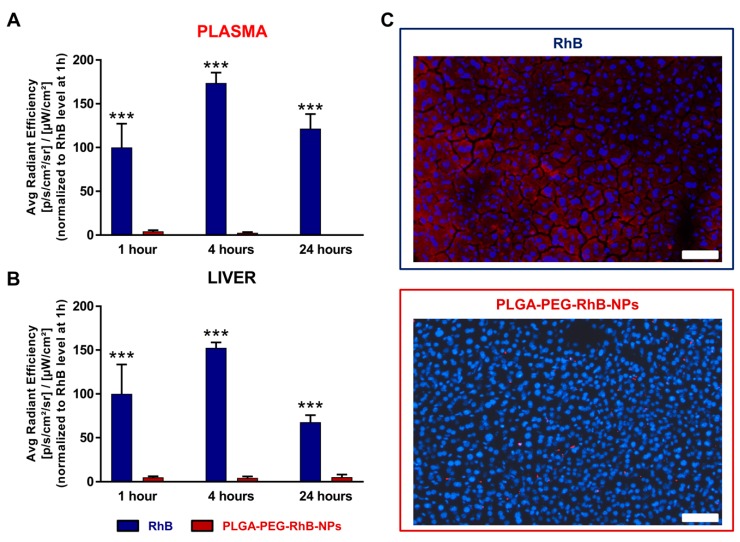
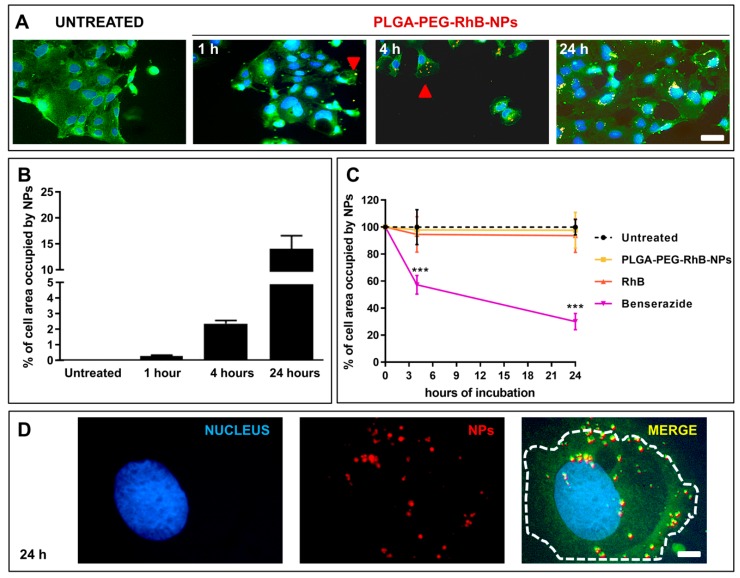
One of the goals of the pharmaceutical sciences is the amelioration of targeted drug delivery. In this context, nanocarrier-dependent transportation represents an ideal method for confronting a broad range of human disorders. In this study, we investigated the possibility of improving the selective release of the anti-cancer drug paclitaxel (PTX) in the gastro-intestinal tract by encapsulating it into the biodegradable nanoparticles made by FDA-approved poly(lactic-co-glycolic acid) (PLGA) and coated with polyethylene glycol to improve their stability (PLGA-PEG-NPs). Our study was performed by combining the synthesis and characterization of the nanodrug with in vivo studies of pharmacokinetics after oral administration in mice. Moreover, fluorescent PLGA-nanoparticles (NPs), were tested both in vitro and in vivo to observe their fate and biodistribution. Our study demonstrated that PLGA-NPs: (1) are stable in the gastric tract; (2) can easily penetrate inside carcinoma colon 2 (CaCo2) cells; (3) reduce the PTX absorption from the gastrointestinal tract, further limiting systemic exposure; (4) enable PTX local targeting. At present, the oral administration of biodegradable nanocarriers is limited because of stomach degradation and the sink effect played by the duodenum. Our findings, however, exhibit promising evidence towards our overcoming these limitations for a more specific and safer strategy against gastrointestinal disorders.

Keywords: PLGA-NPs; gastrointestinal tract; in vivo imaging; nanomedicine; paclitaxel.


Conflict of interest statement

The authors declare no conflict of interest.

Figures

Figure 1
Figure 1
Graphics showing the diameter, measured by dynamic light scattering (DLS), after incubation of (A) pegylated or (B) not pegylated poly(lactic-co-glycolic acid)-nanoparticles (PLGA-NPs) in artificial fluids mimicking the saliva (green lines), the gastric juice (blue lines), or proximal intestinal fluid (yellow line). For all conditions, the measurements were carried out at 1, 2, 4, 6, 24 h from the starting point.
Figure 2
Figure 2
Graphics showing (A) the amount of RhB released from PLGA-PEG-RhB-NPs after 24 h incubation in artificial fluids mimicking the saliva, the gastric juice, or proximal intestinal fluid (mean ± SD; n = 5); (B) emission spectra of poly(lactic-co-glycolic acid)-polyethylene glycol-RhB-nanoparticles (PLGA-PEG-RhB-NPs) incubated in different media.
Figure 3
Figure 3
Comparison of the paclitaxel (PTX) distribution in (A) stomach, (B) duodenum, (C) colon, (D) plasma, and (E) liver of mice after administration of a single treatment of PTX or PTX-PLGA-PEG-RhB-NPs (20 mg/kg p.o.). The bars are the mean value ± SD (n = 4).
Figure 4
Figure 4
Signal distribution in the gastrointestinal (GI) tract of mice treated with RhB or PLGA-PEG-RhB-NPs. (A) Representative ex vivo scanning of the excised organs after washing with saline solutions to remove debris of feces. Animals were sacrificed at 1, 4, and 24 h after the treatment with the same dose of RhB. In the left column, a vehicle-treated mouse was shown to demonstrate the lack of the auto fluorescent component in this analysis. The interval of fluorescence signal intensity associated with the scale of colors is reported on the right. Five animals for each experimental group were used. (B) The quantification of the signal associated with the treatment was performed, dividing each sample into three tracts, as shown in the panel. The bars are the value of signal normalized to 100, considering the mean value measured in the stomach of mice treated with RhB alone and sacrificed 1 h after the oral administration. The bars are the mean value ± SD (n = 5). The Student’s t-test was used to compare the levels between the two groups for each time point. *** p < 0.0001.
Figure 5
Figure 5
Representative images showing the distribution of RhB in (A) stomach and (B) duodenum of mice treated with either PLGA-PEG-RhB-NPs or RhB alone. (A) In the upper panels, the localization of signal (red) in gastric sections (blue) is shown 1, 4, and 24 h after the oral administration of PLGA-PEG-RhB-NPs. The same procedure has been used to track the presence of the dye in mice receiving the same amount of RhB (lower panels). Scale bar 100 µm. (B) Representative images of the duodenum are shown of PLGA-PEG-RhB-NPsand RhB-treated mice in upper and lower panels, respectively. Scale bar 200 µm. The thicker and more intense blue staining in the periphery of the sections represents the basal layer of the duodenum where the exchanges of tissue/blood occur. The red signal is more concentrated to the center, likely corresponding to the lumen close to the apical side of the villi. A higher magnified picture from a mouse sacrificed 1 h after the ingestion of NPs confirms the weak interaction between NPs and villi. In the duodenum of RhB-treated mice, a deep overlapping between the villi and the RhB was observed at both 1 and 24 h after treatment. A higher magnified image confirms the penetration of the dye into the external side of the villi. Scale bar 50 µm.
Figure 6
Figure 6
Signal measurement in (A) the plasma and (B) the liver of mice orally treated with RhB (blue bars) or PLGA-PEG-RhB-NPs (red bars). Animals were sacrificed at 1, 4, and 24 h after the treatment with the same dose of RhB. Five animals for each experimental group were used. In both graphics, quantification of the signal was normalized to the RhB level at 1 h and expressed as 100. The bars are the mean value ± SD (n = 5). The Student’s t-test was used to compare the levels between the two groups for each time point. *** p < 0.0001. (C) Representative images of the signal related to the dye in a section of liver from mice treated with PLGA-PEG-RhB-NPs (upper panel) or RhB alone (lower panel), both sacrificed 1 h after the treatment. Scale bar 50 µm.
Figure 7
Figure 7
Longitudinal study to evaluate PLGA-PEG-RhB-NPs internalization in CaCo2 cells. (A) Low magnified pictures showing the progressive penetration of NPs in cells. Representative images have been selected from non-treated cells (NT, left panel). For each image, the nuclei were stained with Hoechst 33258 (blue), whereas high excitation with the laser at the wavelength of 488 nm will allow unveiling the border of the cells by exploiting their auto fluorescent profile (green). Starting from the 1st hour, it is possible to see orange spots obtained by the merge between the red signal referred to the RhB and the green background. These spots became more evident 4 and 24 h after incubation. Scale bar 70 µm. (B) Quantification of the percentage of the area (pixels) occupied by NPs for every single cell at the different time-points. Data are expressed as mean value ± SD, n = 10. (C) Quantification of the viability of the cells of CaCo2 after exposure to RhB (orange line), PLGA-PEG-RhB-NPs (yellow line), and Benserazide as inner control (purple line) measured by RealTime-Glo™ MT Cell Viability Assay (Promega kit) 4 and 24 h after incubation The values obtained from non-treated cells were normalized to 100 for each time point. Values are expressed as mean ± SD (n = 6). The Student’s t-test was used to compare the levels among the two groups for each time point. *** p < 0.0001 compared to NT. (D) Higher magnification pictures showing the same field of view achieved 24 h after PLGA-PEG-RhB-NPs incubation. In the left panel, the cell nucleus, in the middle panel, the red spots associated with NPs, and in the right panel, the merge between the three channels. The dotted line is the border of the cell. Scale bar 15 µm.

References

    1. Peer D., Karp J.M., Hong S., Farokhzad O.C., Margalit R., Langer R. Nanocarriers as an emerging platform for cancer therapy. Nat. Nanotechnol. 2007;2:751–760. doi: 10.1038/nnano.2007.387. - DOI - PubMed
    1. Heath J.R. Nanotechnologies for biomedical science and translational medicine. Proc. Natl. Acad. Sci. USA. 2015;112:14436–14443. doi: 10.1073/pnas.1515202112. - DOI - PMC - PubMed
    1. Violatto M.B., Casarin E., Talamini L., Russo L., Baldan S., Tondello C., Messmer M., Hintermann E., Rossi A., Passoni A., et al. Dexamethasone Conjugation to Biodegradable Avidin-Nucleic-Acid-Nano-Assemblies Promotes Selective Liver Targeting and Improves Therapeutic Efficacy in an Autoimmune Hepatitis Murine Model. ACS Nano. 2019;13:4410–4423. doi: 10.1021/acsnano.8b09655. - DOI - PubMed
    1. Bartneck M., Scheyda M.K., Warzecha K.T., Rizzo Y.L., Hittatiya K., Luedde T., Storm G., Trautwein C., Lammers T., Tacke F. Fluorescent cell-traceable dexamethasone-loaded liposomes for the treatment of inflammatory liver diseases. Biomaterials. 2015;37:367–382. doi: 10.1016/j.biomaterials.2014.10.030. - DOI - PubMed
    1. Hoshyar N., Gray S., Han H., Bao G. The effect of nanoparticle size on in vivo pharmacokinetics and cellular interaction. Nanomedicine. 2016;11:673–692. doi: 10.2217/nnm.16.5. - DOI - PMC - PubMed