. 2019 Dec 17;6(6):ENEURO.0283-19.2019.
doi: 10.1523/ENEURO.0283-19.2019. Print 2019 Nov/Dec.

Distinct Genetic Signatures of Cortical and Subcortical Regions Associated with Human Memory

Affiliations

Distinct Genetic Signatures of Cortical and Subcortical Regions Associated with Human Memory

Pin Kwang Tan et al. eNeuro. .

Abstract

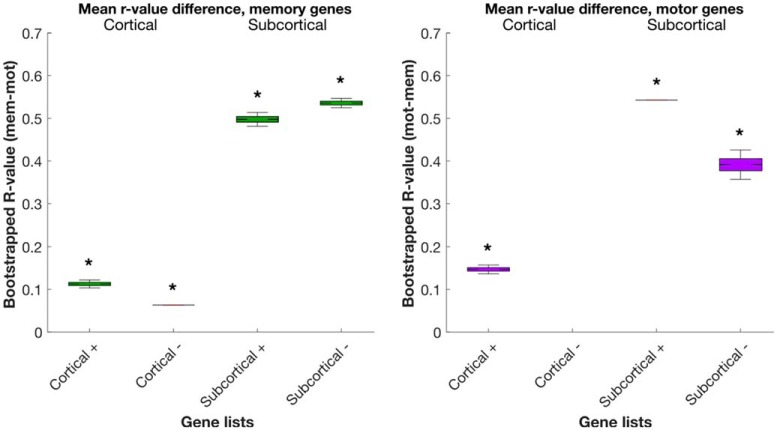
Despite the discovery of gene variants linked to memory performance, understanding the genetic basis of adult human memory remains a challenge. Here, we devised an unsupervised framework that relies on spatial correlations between human transcriptome data and functional neuroimaging maps to uncover the genetic signatures of memory in functionally-defined cortical and subcortical memory regions. Results were validated with animal literature and showed that our framework is highly effective in identifying memory-related processes and genes compared to a control cognitive function. Genes preferentially expressed in cortical memory regions are linked to memory-related processes such as immune and epigenetic regulation. Genes expressed in subcortical memory regions are associated with neurogenesis and glial cell differentiation. Genes expressed in both cortical and subcortical memory areas are involved in the regulation of transcription, synaptic plasticity, and glutamate receptor signaling. Furthermore, distinct memory-associated genes such as PRKCD and CDK5 are linked to cortical and subcortical regions, respectively. Thus, cortical and subcortical memory regions exhibit distinct genetic signatures that potentially reflect functional differences in health and disease, and nominates gene candidates for future experimental investigations.

Keywords: cognition; cortical; genetic; human; memory; neuroimaging.


Figures

Figure 1.
Figure 1.
Overview of genetic signature discovery framework. A, The AHBA and Neurosynth neuroimaging maps, and their preprocessing and integration into a common neuroimaging template space. B, Calculation of spatial similarity between the maps separately for the cortical and subcortical regions, and for memory and motor functions, deriving a ranked gene list L per analysis (contains genes and mean r value). C, Functional characterization of each L with biologically meaningful gene sets with GSEA Pre-ranked analysis (dotted lines connecting L and gene sets represent the clustering of genes into enriched gene sets), yielding positively and negatively scoring gene sets S + and S . D, Assessing differences and the overlap between cortical and subcortical memory genes. E, Identification of candidate genes associated with the cognitive function and brain region, operationalized as the subset of genes driving the enrichment score of the significantly enriched gene sets found using GSEA Pre-ranked analysis. This produced two candidate gene lists, CL + and CL , containing highly positively and negatively correlated genes from S + and S , respectively. F, Literature review of each CL quantifying the genes associated with the target or control cognitive function. G, Assessing framework validity and precision with each of eight CLs. See Extended Data Figure 1-1 for a visualization of GRB14 gene expression in the AHBA, Extended Data Figure 1-2 for a visualization of the Neurosynth maps, and Extended Data Figure 1-3 for the cortical and subcortical regions used in the spatial correlation analysis.
Figure 2.
Figure 2.
An example of spatial similarity analysis output. The expression levels of the top-correlated cortical gene, GRB14, is visualized as a function of the Neurosynth map’s voxel-wise relevance to memory function (z score). Normalized gene expression (y-axis) plotted against neuroimaging map z scores (x-axis). Each colored regression line represents the best-fit line for each of six donors (colors); the translucent band around each line represents the 95% confidence interval estimate.
Figure 3.
Figure 3.
Enrichment map visualization for cortical memory. Clusters are labeled with P for positive, N for negative. Gene set clusters were found to be related to memory. Positive clusters were associated with immune signaling, calcium transport and actin filament assembly. The negative cluster contained gene sets involved in chromatin dynamics and epigenetic regulation. See Extended Data Figure 3-1 for the full output from GSEA Pre-ranked.
Figure 4.
Figure 4.
Enrichment map visualization for subcortical memory. Clusters are labeled with P for positive, N for negative. Gene set clusters were found to be associated with memory. Positive clusters were associated with synaptic transmission, long-term plasticity, glutamate signaling, and neurite morphogenesis. Negative clusters included gene sets involved in transcription and translation, and glial cell differentiation. See Extended Data Figure 4-1 for the full output from GSEA Pre-ranked.
Figure 5.
Figure 5.
Overlap between cortical and subcortical memory gene sets and genes. A, Number of overlapping cortical and subcortical memory gene sets derived from GSEA. B, Number of overlapping cortical and subcortical memory genes derived from GSEA. Light green denotes cortical genes, dark green denotes subcortical genes. See Extended Data Figure 5-1 for the list of gene sets and genes that are shared or distinct across cortex and subcortex.
Figure 6.
Figure 6.
Bootstrapped correlation value differences for all cortical and subcortical candidate genes of memory and motor analysis. For a given memory gene, we calculated the difference between memory and motor analysis r values by subtracting motor r from memory r. If the memory r was negative, we took the negative of the difference (to get a positive value). Vice versa for the motor genes. For each cognitive function, we subsampled the number of genes used to the lowest number for calculating the bootstrapped mean difference (231 memory genes and 146 motor genes, respectively, 10,000 iterations). If the 95th percentile did not overlap with the baseline of zero, the bootstrapped difference is considered significant (p < 0.05). Note that for the motor cortical analysis, no negatively correlated genes survived the threshold and thus no motor cortical (–) gene list is shown here. See Extended Data Figure 6-1 for the complete list of correlation value differences for genes used in the bootstrap analysis. *denotes p < 0.05.
Figure 7.
Figure 7.
Precision scores for top-10 cortical and subcortical candidate genes of memory and motor analysis. For a given memory gene list, we calculated the memory and motor precision scores with Equations 1, 2 and their difference. Ideally, memory gene lists should obtain a memory score above 0.5, and a motor score below 0.5, and vice versa for the motor genes. Note that for the motor cortical analysis, no negatively correlated genes survived the threshold and thus no motor cortical (–) gene list is shown. See Extended Data Figure 7-1 for the candidate genes of each analysis and the derived method precision score for each gene list.

Similar articles

Cited by

References

    1. Alberini CM, Kandel ER (2015) The regulation of transcription in memory consolidation. Cold Spring Harb Perspect Biol 7:a021741. 10.1101/cshperspect.a021741 - DOI - PMC - PubMed
    1. Arnatkevic̆iūtė A, Fulcher BD, Fornito A (2019) A practical guide to linking brain-wide gene expression and neuroimaging data. Neuroimage 189:353–367. 10.1016/j.neuroimage.2019.01.011 - DOI - PubMed
    1. Basu S, Kustanovich I, Lamprecht R (2016) Arp2/3 and VASP are essential for fear memory formation in lateral amygdala. eNeuro 3:ENEURO.0302-16.2016. 10.1523/ENEURO.0302-16.2016 - DOI - PMC - PubMed
    1. Baumgartner WA, Cohen KB, Fox LM, Acquaah-Mensah G, Hunter L (2007) Manual curation is not sufficient for annotation of genomic databases. Bioinformatics 23:i41–i48. 10.1093/bioinformatics/btm229 - DOI - PMC - PubMed
    1. Berto S, Wang G-Z, Germi J, Lega BC, Konopka G (2017) Human genomic signatures of brain oscillations during memory encoding. Cereb Cortex 89:1–16. - PMC - PubMed

Publication types