. 2020 Jan;31(1):118-138.
doi: 10.1681/ASN.2019080832. Epub 2019 Dec 9.

Single-Cell RNA Sequencing Reveals Renal Endothelium Heterogeneity and Metabolic Adaptation to Water Deprivation

Affiliations

Single-Cell RNA Sequencing Reveals Renal Endothelium Heterogeneity and Metabolic Adaptation to Water Deprivation

Sébastien J Dumas et al. J Am Soc Nephrol. 2020 Jan.

Abstract

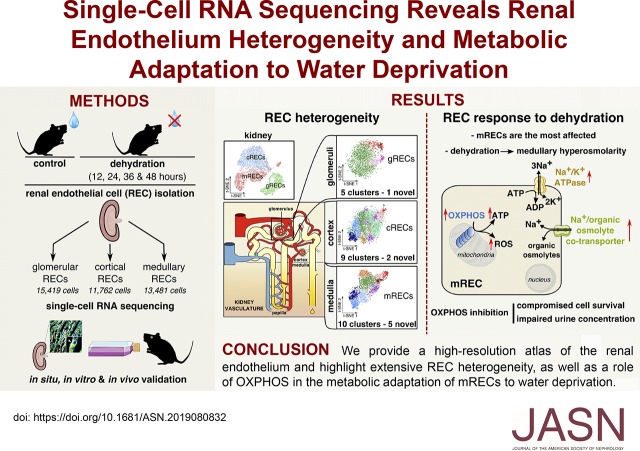
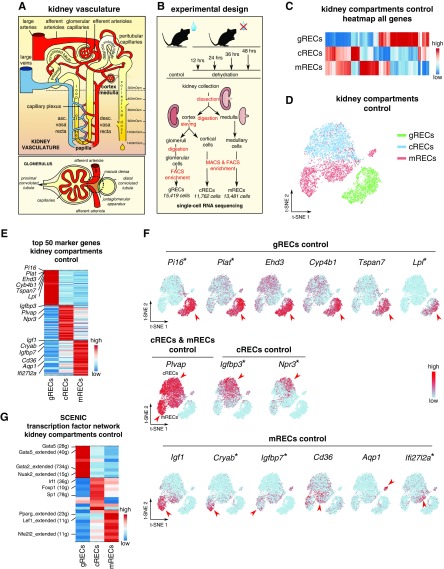
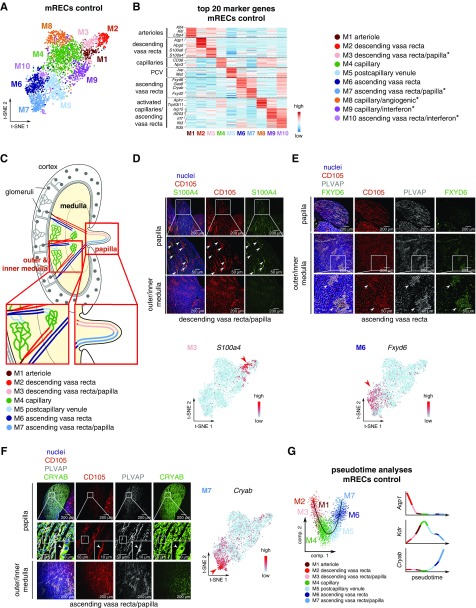
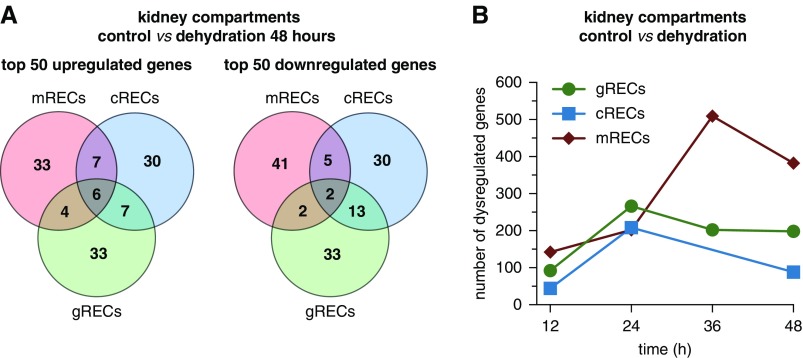
Background: Renal endothelial cells from glomerular, cortical, and medullary kidney compartments are exposed to different microenvironmental conditions and support specific kidney processes. However, the heterogeneous phenotypes of these cells remain incompletely inventoried. Osmotic homeostasis is vitally important for regulating cell volume and function, and in mammals, osmotic equilibrium is regulated through the countercurrent system in the renal medulla, where water exchange through endothelium occurs against an osmotic pressure gradient. Dehydration exposes medullary renal endothelial cells to extreme hyperosmolarity, and how these cells adapt to and survive in this hypertonic milieu is unknown.

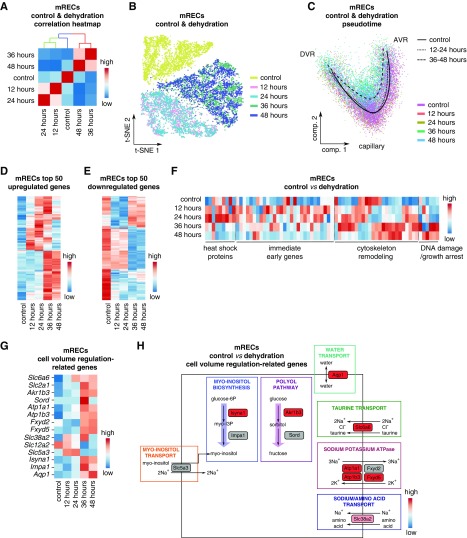
Methods: We inventoried renal endothelial cell heterogeneity by single-cell RNA sequencing >40,000 mouse renal endothelial cells, and studied transcriptome changes during osmotic adaptation upon water deprivation. We validated our findings by immunostaining and functionally by targeting oxidative phosphorylation in a hyperosmolarity model in vitro and in dehydrated mice in vivo.

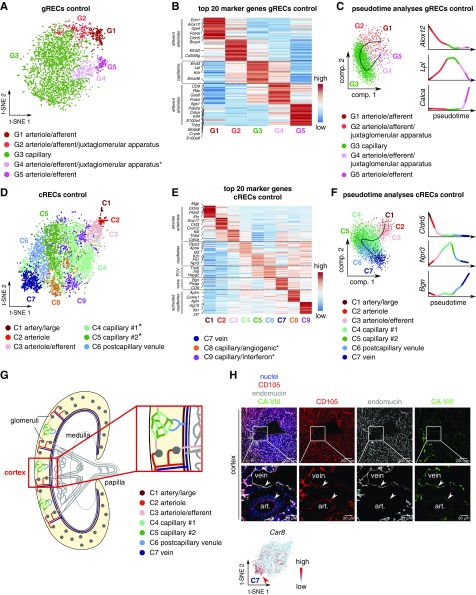
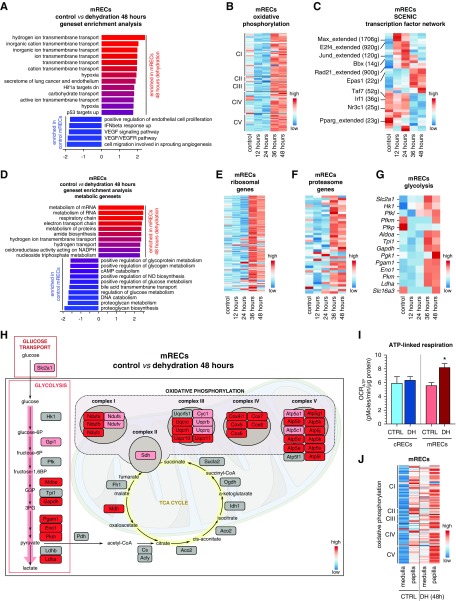
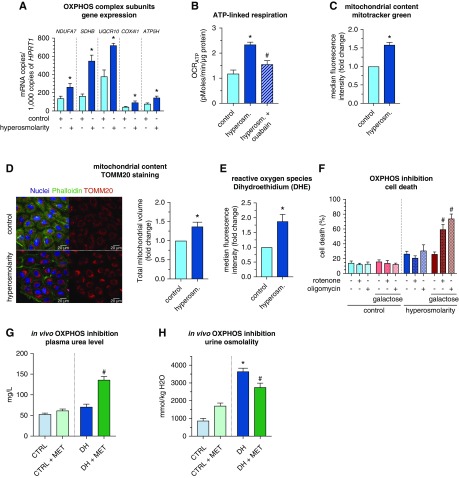
Results: We identified 24 renal endothelial cell phenotypes (of which eight were novel), highlighting extensive heterogeneity of these cells between and within the cortex, glomeruli, and medulla. In response to dehydration and hypertonicity, medullary renal endothelial cells upregulated the expression of genes involved in the hypoxia response, glycolysis, and-surprisingly-oxidative phosphorylation. Endothelial cells increased oxygen consumption when exposed to hyperosmolarity, whereas blocking oxidative phosphorylation compromised endothelial cell viability during hyperosmotic stress and impaired urine concentration during dehydration.

Conclusions: This study provides a high-resolution atlas of the renal endothelium and highlights extensive renal endothelial cell phenotypic heterogeneity, as well as a previously unrecognized role of oxidative phosphorylation in the metabolic adaptation of medullary renal endothelial cells to water deprivation.

Keywords: dehydration; heterogeneity; oxidative phosphorylation; renal endothelial cells; scRNA-sequencing; urine concentration.


Figures

None
Graphical abstract
Figure 1.
Figure 1.
Control RECs show kidney compartment-specific gene signatures. All data in (C–F) are generated using RECs from kidneys in control condition. (A) Simplified schematic overview of the nephron and glomerular vasculature. The renal artery supplies blood to the entire kidney, and branches into afferent arterioles, which enter glomeruli to form fenestrated glomerular capillaries where blood ultrafiltration takes place. Unlike most capillary beds, glomerular capillaries exit into efferent arterioles, which branch into cortical peritubular capillaries vascularizing the proximal and distal convoluted tubules. DVR branch off from the efferent arterioles of juxtamedullary nephrons, enter the medulla and branch into a capillary plexus that drains blood into AVR. Vasa recta surround the loop of Henle and are essential for concentrating the urine. Peritubular capillaries and AVR connect to renal veins in the cortex, which drain the blood from the kidney. (B) Schematic overview of the study design. Kidney cortex, medulla, and glomeruli were enzymatically digested until obtaining single-cell suspensions. After a pre-enrichment of CD31+ cRECs and mRECs via MACS, all RECs were purified by FACS. Single-cell RNA sequencing of these RECs resulted in 15,419 high-quality gRECs; 11,762 high-quality cRECs; and 13,481 high-quality mRECs for all conditions. (C) Expression-level scaled heatmap of all genes from RECs isolated from the three kidney compartments. Scale: light blue is low expression, red is high expression. (D) t-SNE plot showing REC clusters from the three kidney compartments. (E) Expression-level scaled heatmap of the top 50 marker genes of REC clusters isolated from the three kidney compartments. (F) t-SNE plots of RECs isolated from the three kidney compartments, color-coded for the expression of the indicated markers. Red arrowheads indicate cells with high expression of the indicated marker on the t-SNE plots. Scale: light blue is low expression, red is high expression. Asterisks indicate novel marker genes. (G) Expression-level scaled heatmap of the top 10 inferred transcription factor gene regulatory networks (as analyzed using SCENIC) in RECs from the three kidney compartments. Numbers between parentheses indicate the number of genes (g) that are part of the regulons for the respective transcription factors. Red corresponds to high transcription factor activity, blue corresponds to low transcription factor activity. See also Supplemental Figure 1 and Supplemental Tables 1 and 2.
Figure 2.
Figure 2.
Control gRECs and cRECs exhibit intracompartment heterogeneity. All data shown were generated using gRECs and cRECs from kidneys in control condition. (A) gREC subclustering visualized by t-SNE plot. Asterisk indicates previously unrecognized subcluster. (B) Expression-level scaled heatmap of the top 20 marker genes in gREC subcluster phenotypes. (C) Pseudotime analysis of gREC subclusters and loess smoothed expression of the indicated gene markers in pseudotime in the indicated gREC subclusters. (D) cREC subclusters visualized by t-SNE plot. Asterisks indicate newly recognized subclusters. (E) Expression-level scaled heatmap of the top 20 marker genes in cREC subclusters. (F) Pseudotime analysis of cREC subclusters and loess smoothed gene expression of the indicated markers in pseudotime in the indicated cREC subclusters. Angiogenic and response-to-IFN cREC subclusters were not included in the pseudotime analysis. (G) Simplified schematic overview of the renal cortical vasculature. Inset shows larger magnification of the boxed area. Subclusters C4 and C5 are novel; the other vascular beds have been previously documented at the anatomic level. (H) Representative micrographs of mouse kidney sections immunostained for the endothelial cell marker CD105 (red), the vein/capillary marker endomucin (gray), and the novel marker CA-VIII (green) for the vein cluster (C7). Nuclei are counterstained with Hoechst (blue). Bottom images are magnifications of the respective boxed areas. Arrrowheads indicate endothelial cells from an artery and a vein. A t-SNE plot of cRECs, color-coded for the expression of Car8 is shown below. Scale: light blue is low expression, red is high. Note: CA-VIII denotes the protein, encoded by the Car8 gene. Scale bar, 200 µm (top panels) and 50 µm (bottom panels). See also Supplemental Figures 2 and 4, and Supplemental Tables 1, 3–5. Art, artery.
Figure 3.
Figure 3.
Control mRECs exhibit intracompartment heterogeneity. All data shown were generated using mRECs from kidneys in control condition. (A) mREC subclustering visualized by t-SNE plot. (B) Expression-level scaled heatmap of the top 20 marker genes in mREC subclusters. Asterisks indicate newly recognized subclusters. (C) Schematic overview of the renal papillary vasculature. Insets show larger magnifications of the respective boxed areas. (D) Representative micrographs of mouse kidney sections immunostained for the endothelial cell marker CD105 (red) and the novel marker S100A4 (green) for the DVR/papilla subcluster (M3). Nuclei are counterstained with Hoechst (blue). Top and middle panels are images of the papilla; middle images are magnifications of the respective boxed areas, with arrowheads indicating CD105+S100A4+ ECs. Bottom panels are images of outer/inner medulla. A t-SNE plot of mRECs color-coded for the expression of S100a4 is shown beneath the micrographs. Scale: light blue is low expression, red is high expression. Scale bar, 200 µm (top and bottom panels) and 50 µm (middle panels). (E) Representative micrographs of mouse kidney sections immunostained for the endothelial cell marker CD105 (red), the fenestrated endothelial marker PLVAP (gray), and the novel marker FXYD6 (green) for the AVR cluster (M6). Nuclei are counterstained with Hoechst (blue). Top panels are images of the papilla; middle and bottom panels are images of outer/inner medulla; bottom images are magnifications of the respective boxed areas, with arrowheads indicating CD105+PLVAP+ FXYD6+ ECs. A t-SNE plot of mRECs color-coded for the expression of Fxyd6 is shown beneath the micrographs. Scale: light blue is low expression, red is high expression. Scale bar, 200 µm (top and middle panels) and 50 µm (bottom panels). (F) Representative micrographs of mouse kidney sections immunostained for the endothelial cell marker CD105 (red), the fenestrated endothelial marker PLVAP (gray), and the novel marker CRYAB (green) for the AVR/papilla cluster (M7). Nuclei are counterstained with Hoechst (blue). Top and middle panels are images of the papilla of the mouse kidney; middle images are magnifications of the respective boxed areas. Higher magnification of the respective boxed areas is shown in insets, with arrowheads indicating CD105+PLVAP+CRYAB+ ECs. Bottom panels are images of outer/inner medulla of the mouse kidney. A t-SNE plot of mRECs color-coded for the expression of Cryab is shown on the right of the micrographs. Scale: light blue is low expression, red is high expression. Scale bar, 200 µm (top and bottom panels), 50 µm (middle panels), and 10 µm (insets in middle panels). (G) Pseudotime analysis of mREC subclusters and loess smoothed gene expression of the indicated markers in pseudotime in the indicated mREC subclusters. Angiogenic and response-to-IFN mREC subclusters were not included in the analysis. The t-SNE plots shown in (D–F) are also represented in Supplemental Figure 4A at a larger size for reasons of clarity. See also Supplemental Figures 3 and 4 and Supplemental Tables 1, 3–5.
Figure 4.
Figure 4.
mRECs are the most affected by dehydration. (A) Venn diagram of the top 50 up- and downregulated genes in RECs from the three kidney compartments at 48 hours of dehydration. (B) Number of dysregulated genes [(log2(fold change) >0.2 or <0.2] in gRECs, cRECs, and mRECs at the different dehydration time points versus control. Note for the 36-hour time point: the cREC sample did not meet sequencing quality standards and was therefore not included in downstream analyses. See also Supplemental Figure 5 and Supplemental Table 6.
Figure 5.
Figure 5.
mRECs show a typical transcriptomic response to hyperosmolarity in dehydration. (A) Correlation heatmap of mRECs from the control condition and at different dehydration time points. Scale: red indicates a high transcriptome similarity, blue indicates a low transcriptome similarity. (B) t-SNE plot color-coded for mRECs from the control condition and at different dehydration time points. (C) Pseudotime analysis of mRECs from control conditions, and at 12–24 and 36–48 hours of dehydration. (D and E) Expression-level scaled heatmap of the top 50 upregulated (D) and downregulated (E) genes in mRECs at different dehydration time points. Red corresponds to high gene expression levels, blue corresponds to low gene expression levels. (F) Expression-level scaled heatmap of genes encoding heat shock proteins, or genes involved in cytoskeleton remodeling, DNA damage, and growth arrest, and immediate early genes in mRECs from control condition and at the different dehydration time points. Red corresponds to high expression levels, blue corresponds to low expression levels. (G) Expression-level scaled heatmap of cell volume regulation–related genes in mRECs from control condition and at the different dehydration time points. Red corresponds to high expression levels, blue corresponds to low expression levels. (H) Pathway map showing changes in transcript levels of genes belonging to myo-inositol and polyol pathways, and genes encoding transporters related to cell volume regulation in mRECs after 48 hours of dehydration compared with control. Scale bar: red corresponds to gene upregulation after dehydration, gray indicates that the change in gene expression did not reach the fold change threshold to be color-coded. See also Supplemental Figure 7 and Supplemental Table 1.
Figure 6.
Figure 6.
mRECs metabolically adapt to dehydration. (A) GSEA of mRECs after 48 hours of dehydration compared with controls. (B) Expression-level scaled heatmap of oxidative phosphorylation-related genes for mRECs from the control condition and at different dehydration time points. (C) Expression-level scaled heatmap of the top up- and downregulated inferred transcription factor gene regulatory networks (as analyzed using SCENIC) in mRECs in control condition and at different dehydration time points. Numbers between parentheses indicate the number of genes (g) that are part of the regulons for the respective transcription factors. Red corresponds to high transcription factor activity, blue corresponds to low transcription factor activity. (D) GSEA using only metabolic gene sets of mRECs after 48 hours of dehydration compared with controls. (E–G) Expression-level scaled heatmap of ribosomal genes (E), proteasome genes (F), and glycolysis-related genes (G) for mRECs from the control condition and at different dehydration time points. (H) Pathway map showing changes in transcript levels of metabolic genes of glycolysis, TCA cycle, and oxidative phosphorylation in mRECs after 48-hour dehydration compared with controls. Scale bar: red corresponds to gene upregulation after dehydration, gray indicates that the change in gene expression did not reach the fold change threshold to be color-coded. (I) OCRATP of cRECs and mRECs isolated from control mice and from mice subjected to 48 hours of dehydration (DH). Data are from n=3 independent experiments, for which three mice were pooled each time. (J) Expression-level scaled heatmap of oxidative phosphorylation-related genes for mRECs from papillary subclusters or other medullary subclusters in the control condition and after 48 hours dehydration. See also Supplemental Figure 5 and Supplemental Table 7. Statistical test: unpaired t test, *P<0.05.
Figure 7.
Figure 7.
ECs survive hyperosmolarity during dehydration by upregulating oxidative phosphorylation. (A) Quantitative RT-PCR analysis of OXPHOS complex subunit-encoding transcripts (NDUFA7, SDHB, UQCR10, COX4I1, ATP5H) in control and hyperosmolarity-exposed HUVECs (n=4). (B) OCRATP of control and hyperosmolarity-exposed HUVECs, in the absence or presence of ouabain (0.5 µM) (n=3). (C) MitoTracker green median fluorescence intensity of control and hyperosmolarity-exposed HUVECs (n=10). (D) Left: representative images of control and hyperosmolarity-exposed HUVECs stained for the mitochondrial marker TOMM20 (red), the cytoskeleton phalloidin (green), and the nucleus (Hoechst, blue). Scale bar: 20 µM. Right: total mitochondrial volume per cell of TOMM20-stained control and hyperosmolarity-exposed HUVECs (n=4). (E) DHE median fluorescence intensity of control and hyperosmolarity-exposed HUVECs (n=8). (F) Cell death quantification of control and hyperosmolarity-exposed HUVECs in the presence or absence of OXPHOS inhibitors (rotenone 2 µM; oligomycin 1.2 µM) in control medium or medium in which glucose was replaced by galactose (n=3–6). (G and H) Plasma urea levels (G) and urine osmolality (H) of mice treated with vehicle or metformin (600 mg/kg, twice a day) and submitted to 48 hours of dehydration (DH) (n=5–17). Data are mean±SEM. See also Supplemental Figure 8. Statistical tests: one-sample t test, unpaired t test, one- and two-way ANOVA/Bonferroni, *P<0.05 compared with control; #P<0.05 compared with hyperosmolarity or dehydration.

Comment in

Similar articles

Cited by

References

    1. Molema G, Aird WC: Vascular heterogeneity in the kidney. Semin Nephrol 32: 145–155, 2012 - PubMed
    1. Jourde-Chiche N, Fakhouri F, Dou L, Bellien J, Burtey S, Frimat M, et al. .: Endothelium structure and function in kidney health and disease. Nat Rev Nephrol 15: 87–108, 2019 - PubMed
    1. Kriz W: Fenestrated glomerular capillaries are unique. J Am Soc Nephrol 19: 1439–1440, 2008 - PubMed
    1. Eckardt KU, Bernhardt WM, Weidemann A, Warnecke C, Rosenberger C, Wiesener MS, et al. .: Role of hypoxia in the pathogenesis of renal disease. Kidney Int Suppl S46–S51, 2005 - PubMed
    1. Pallone TL, Edwards A, Mattson DL: Renal medullary circulation. Compr Physiol 2: 97–140, 2012 - PubMed

Publication types