. 2019 Dec 26;116(52):26382-26388.
doi: 10.1073/pnas.1822037116. Epub 2019 Dec 9.

Disappearance of the last tropical glaciers in the Western Pacific Warm Pool (Papua, Indonesia) appears imminent

Affiliations

Disappearance of the last tropical glaciers in the Western Pacific Warm Pool (Papua, Indonesia) appears imminent

Donaldi S Permana et al. Proc Natl Acad Sci U S A. .

Abstract

The glaciers near Puncak Jaya in Papua, Indonesia, the highest peak between the Himalayas and the Andes, are the last remaining tropical glaciers in the West Pacific Warm Pool (WPWP). Here, we report the recent, rapid retreat of the glaciers near Puncak Jaya by quantifying the loss of ice coverage and reduction of ice thickness over the last 8 y. Photographs and measurements of a 30-m accumulation stake anchored to bedrock on the summit of one of these glaciers document a rapid pace in the loss of ice cover and a ∼5.4-fold increase in the thinning rate, which was augmented by the strong 2015-2016 El Niño. At the current rate of ice loss, these glaciers will likely disappear within the next decade. To further understand the mechanisms driving the observed retreat of these glaciers, 2 ∼32-m-long ice cores to bedrock recovered in mid-2010 are used to reconstruct the tropical Pacific climate variability over approximately the past half-century on a quasi-interannual timescale. The ice core oxygen isotopic ratios show a significant positive linear trend since 1964 CE (0.018 ± 0.008‰ per year; P < 0.03) and also suggest that the glaciers' retreat is augmented by El Niño-Southern Oscillation processes, such as convection and warming of the atmosphere and sea surface. These Papua glaciers provide the only tropical records of ice core-derived climate variability for the WPWP.

Keywords: ENSO; Papua Indonesia; climate change; glacier retreat; tropical ice cores.


Conflict of interest statement

The authors declare no competing interest.

Figures
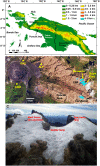
Fig. 1.
Fig. 1.
Geographical and physical setting of the Papua ice fields. (A) Topography of New Guinea Island, showing the location of Puncak Jaya in Papua. (B) Papua glaciers and locations of stations with available instrumental records (DISP, GRS, and ALP) (background image: https://eoimages.gsfc.nasa.gov/images/imagerecords/91000/91716/puncak_oli_2017339_lrg.jpg). (C) Oblique aerial photo taken in June 2010 of the ENF, showing the locations of the drill sites on the west and east domes. The distance between the summits of the domes is about 600 m.
Fig. 2.
Fig. 2.
Ice thinning and retreat of Papua glaciers. (A) Schematic of connected PVC pipes illustrating ice thickness changes on the ENF in June 2010, November 2015 (gray), May 2016 (red), and November 2016 (blue). Oblique aerial photographs of the ENF taken in (B) June 2010, (C) November 2015, (D) November 2016, and (E) March 2018 show the bifurcation of the ice mass.
Fig. 3.
Fig. 3.
Changes of total ice area and impact of the 2015–2016 El Niño on Papua glaciers. (A) Landsat-5 satellite image of the glaciated area on October 9, 2009. The ENF and the Carstensz Glacier are outlined in black boxes. (B) Planet’s satellite image of ENF taken on May 16, 2016, showing outlines of ice extent on June 11, 2002 (as in ref. 6); March 16, 2015; May 16, 2016; and March 28, 2018. (C) Planet’s satellite image of Carstensz Glacier taken on May 16, 2016, showing outlines of ice extent on same dates as in B. (D) The changes of total glacier area near Puncak Jaya from ∼1850 to 2018. The Inset highlights the ice area changes from 2002 to 2018. Color-coded triangles depict the coverage outlined in B and C; the gray circles and uncertainty bars are derived from other studies (17). Additional information on the satellite images in B and C are provided in SI Appendix, Table S1.
Fig. 4.
Fig. 4.
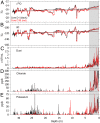
Ice core records. The (A) δ18O and (B) δD in the D1 (black) and D1B (red) cores show high reproducibility and positive trends toward the surface. Comparison of (C) mineral dust, (D) chloride, and (E) potassium concentrations among the ENF cores shows reproducibility and increased concentrations toward the top as the stable isotope variability decreases and the trend of isotopic enrichment increases (gray shading).
Fig. 5.
Fig. 5.
Annual ice core records since 1964. (A) The δ18O and 3H data from 68 samples in D1 core (red closed circles with error bars). The 1964 horizon is marked by the 3H peak (2.98 ± 0.42 TU) at 23.4-m depth. (B) The D1 and D1B δ18O time series are compared, and 12 points in D1 (green closed circles) are paired with corresponding points in 13-mo running means of NINO3 ERSST (24) after assigning the 1964 3H peak at 23.4 m and assuming the top layer is May 2010. The correlations between the 2 ice cores’ δ18O values and the NINO3 SSTs are shown. (C) The logged values of annual averages of dust concentration (size of >0.63 μm) in the D1 and D1B cores post-1964. (D) As in C, but for chloride concentrations. (E) As in C, but for potassium concentrations.
Fig. 6.
Fig. 6.
Comparison of core D1 and GNIP station 3H records. (A) The 3H record from core D1 is shown in depth next to (B) the annual 3H in precipitation collected from GNIP stations in Jayapura, Indonesia (blue curve), and Madang, Papua New Guinea (red curve), from 1957 to 1991 (Bottom). The green curve depicts the average 3H values from the 2 stations where the records overlap (1974–1982). The thin lines connect similar features in the ice core and precipitation curves. Note that the 3H concentration in precipitation collected at the stations has been calculated using the decay half-life of 12.3 y in order to show that the value of the peak in the sample collected in 1964 is compatible with that in the ice core record.

References

    1. Thompson L. G., Mosley-Thompson E., Davis M. E., Brecher H. H., Tropical glaciers, recorders and indicators of climate change, are disappearing globally. Ann. Glaciol. 52, 23–34 (2011).
    1. Thompson L. G., et al. , Annually resolved ice core records of tropical climate variability over the past ∼1800 years. Science 340, 945–950 (2013). - PubMed
    1. Vimeux F., et al. , Climate variability during the last 1000 years inferred from Andean ice cores: A review of methodology and recent results. Palaeogeogr. Palaeoclimatol. Palaeoecol. 281, 229–241 (2009).
    1. Taylor R. G., et al. , Recent glacial recession in the Rwenzori Mountains of East Africa due to rising air temperature. Geophys. Res. Lett. 33, L10402 (2006).
    1. Thompson L. G., et al. , Kilimanjaro ice core records: Evidence of Holocene climate change in tropical Africa. Science 298, 589–593 (2002). - PubMed

LinkOut - more resources