. 2019 Dec 26;116(52):26580-26590.
doi: 10.1073/pnas.1911273116. Epub 2019 Dec 9.

Pancreatic cancer organoids recapitulate disease and allow personalized drug screening

Affiliations

Pancreatic cancer organoids recapitulate disease and allow personalized drug screening

Else Driehuis et al. Proc Natl Acad Sci U S A. .

Abstract

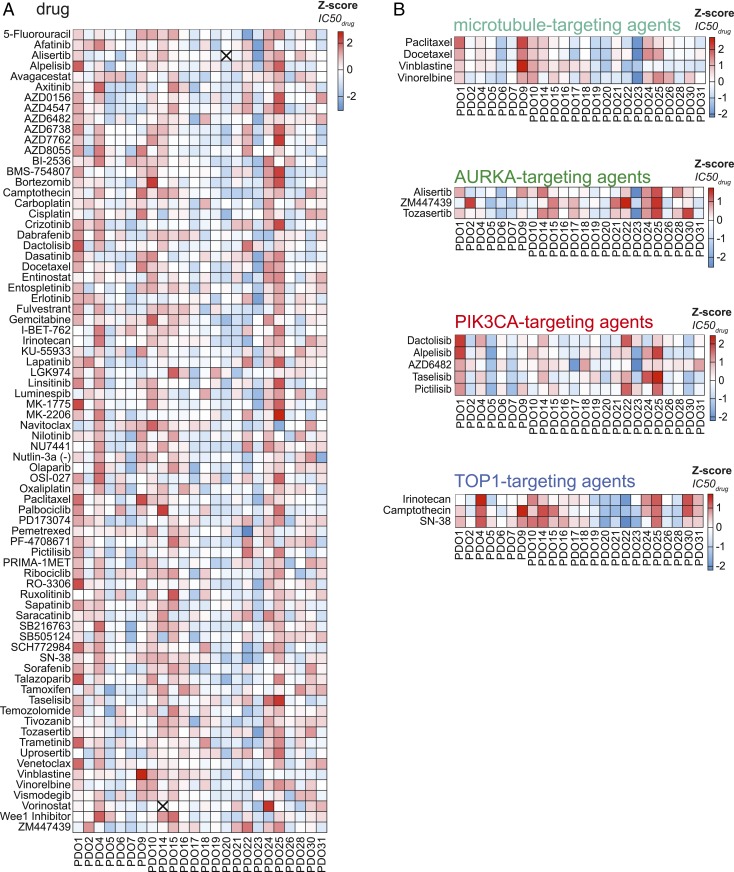
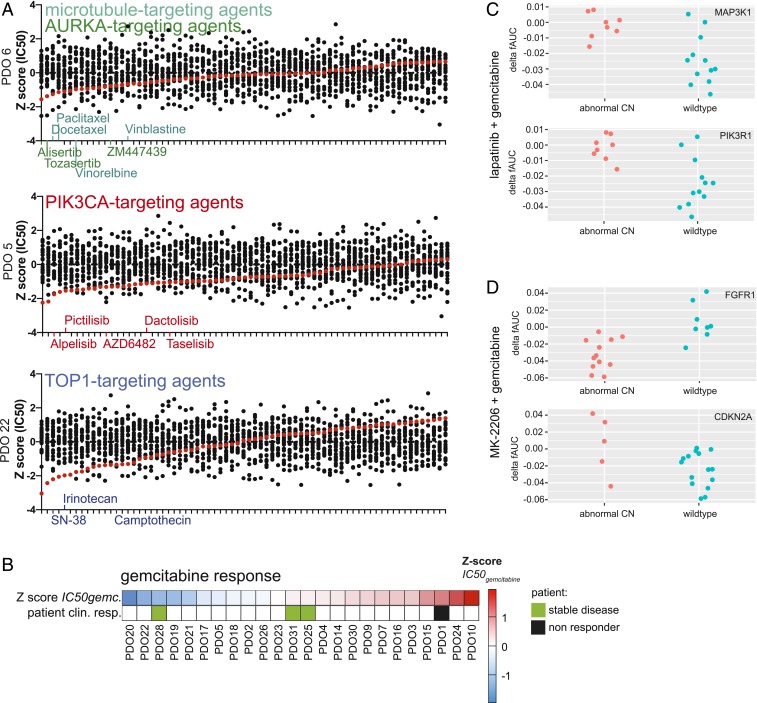
We report the derivation of 30 patient-derived organoid lines (PDOs) from tumors arising in the pancreas and distal bile duct. PDOs recapitulate tumor histology and contain genetic alterations typical of pancreatic cancer. In vitro testing of a panel of 76 therapeutic agents revealed sensitivities currently not exploited in the clinic, and underscores the importance of personalized approaches for effective cancer treatment. The PRMT5 inhibitor EZP015556, shown to target MTAP (a gene commonly lost in pancreatic cancer)-negative tumors, was validated as such, but also appeared to constitute an effective therapy for a subset of MTAP-positive tumors. Taken together, the work presented here provides a platform to identify novel therapeutics to target pancreatic tumor cells using PDOs.

Keywords: biobank; cancer; organoids; pancreatic cancer; personalized medicine.


Conflict of interest statement

Competing interest statement: H.C. is an inventor listed on several patents related to organoid technology. H.C. is the (unpaid) Chief Scientific Officer of Hubrecht Organoid Technology, a cofounder of Surrozen, and a scientific advisory board member for Kallyope, Merus, and Decibel. H. Clevers is a nonexecutive board member of Roche and Genentech and a scientific advisor for Life Sciences Partners. E.D. is an inventor on a patent related to organoid technology.

Figures

Fig. 1.
Fig. 1.
Patient-derived organoids can be established from different pancreatic tumor types and recapitulate the tissue of the original tumor. (A) Pie chart depicting the characteristics of the tumor biobank described in this work. ACC, acinar cell carcinoma; CC, cholangiocarcinoma; IPMN, intraductal papillary mucinous neoplasm. (B) Brightfield images of 3 PDO cultures, shown in 2 magnifications. (C) Brightfield images of H&E staining of tumor tissue and corresponding organoids showing organoid morphology in culture. (D) IHC staining for TP53 in tumor tissue and corresponding organoids of patient 11. The TP53 staining is consistent with TP53 mutation status of the tumor and organoids and is corresponding in tumor tissue and organoids. (E) IHC for SMAD4 in tumor tissue and brightfield images of corresponding organoid lines, grown in either complete medium or medium lacking A83-01 and Noggin. SMAD4 mutant cells can be functionally selected in organoid cultures by removing TGF-β inhibitors A83-01 and Noggin. (F) qPCR for BMP target genes ID1 and ID3. Induction of BMP signaling by the removal of Noggin and A83-01 resulted in up-regulation of ID1 and ID3 in SMAD4 wild-type PDO 8 and PDO 10 but not in SMAD mutant PDO 23. Expression is shown relative to organoids grown in complete medium. This experiment was performed in technical triplicate.
Fig. 2.
Fig. 2.
Genomic landscape of pancreatic PDOs recapitulates genetic alterations commonly found in this tumor type. (A) Overview of severe somatic events detected in PDOs in genes commonly altered in PDAC. Here a panel of 220 oncogenic driver genes (marked with an asterisk) and tumor suppressor genes was analyzed for genetic alterations. Different mutation types are depicted with different colors. Five samples lacked a reference DNA, marked with “*no blood ref.,” and pathogenic mutations for these samples were called based on the COSMIC database. The mutation frequency per gene is depicted on the left and is calculated without the inclusion of tumor-only samples. In some cases, multiple organoid lines were established from tissues obtained from 1 patient. Color coding at the bottom of the figure shows whether organoid lines are derived from the same patient. (B) Volcano plots showing the common losses and gains of chromosome arms (annotated by the chromosome number, followed by p or q). The gains and losses were normalized against the mean genome ploidy level.
Fig. 3.
Fig. 3.
High-throughput drug screening in PDOs reveals sensitivities to a range of therapeutic agents. (A) A total of 76 compounds were tested in 24 PDOs. The z-scores of obtained IC50 values are depicted in the heatmap. High values (indicating resistance) are depicted in red, and low values (indicating sensitivity) are in blue. An “X” indicates that the data generated for this compound/PDO combination are not present. Compounds are ordered alphabetically. (B) Response of PDOs to compounds targeting the same biological process or pathway, highlighting similar responses observed among the different compounds. High values (indicating resistance) are depicted in red, and low values (indicating sensitivity) are in blue.
Fig. 4.
Fig. 4.
Individual PDO drug responses indicate clinically relevant therapeutic vulnerabilities and reveal potential biomarkers for therapy response. (A) For PDO 5, PDO 6, and PDO 22, therapeutic compounds are arranged from most effective to least effective. Enrichment of compounds that target the same biological process or pathway is observed. Inhibitors targeting the same target are shown in identical colors, with color-coding as in Fig. 3B. (B) Correlation between gemcitabine response of PDOs and corresponding patients. For patient clinical response, green indicates a response to gemcitabine treatment, and a black box indicates resistance to treatment. Sensitivity to chemotherapy is indicated by the z-score of IC50 values. (C) Response of PDOs treated with lapatinib and gemcitabine, depicted in delta fAUC, plotted for samples either with (red) or without (blue) copy number alteration of MAP3K1 and PIK3R1. (D) Response of PDOs treated with MK-2206 and gemcitabine, depicted in delta fAUC, plotted for samples either with (red) or without (blue) copy number alteration of FGFR1 or CDKN2A.
Fig. 5.
Fig. 5.
PRMT5 inhibition is effective in a subset of PDOs. (A) Detection of CDKN2A and MTAP gene body loss in the 25 tumor-derived PDOs for which reference DNA was available. Dark green indicates the presence and light green indicates the absence of gene-coding DNA. For both genes, both alleles are shown. (B) Expression levels of CDKN2A and MTAP as detected by RNA sequencing in PDOs. The heatmap shows log2 values of normalized counts. Red indicates a high value; blue, a low value. (C) Heatmap showing the AUC values of the response to EZP015556 of all tested PDOs and corresponding MTAP DNA status. Low AUC, indicating sensitivity to PRMT5 inhibition, is depicted in blue. High AUC, indicating low sensitivity to PRMT5 inhibition, is depicted in red. MTAP mutation status is indicated in the row below, with black indicating loss of MTAP and white indicating MTAP wild-type status. (D) Induction of MTAP expression in MTAP+ (dark blue), MTAP (light blue), and MTAP+ EZP01556-sensitive (red) lines. Cells are exposed to EZP015556 either in combination with doxycycline-mediated induction (square symbols, dashed lines) or without (round symbols, solid lines). The experiment was performed in technical triplicate. DOX, doxycycline. (E) MTA levels detected in PDOs, shown in pmol/106 cells. MTA levels were measured in 3 MTAP+ PRMT5 inhibition-resistant lines (blue), 2 MTAP PRMT5-sensitive lines (green), and 3 MTAP+ PRMT5 inhibition-sensitive lines (red). (F) In MTAP+ PRMT5 inhibition-sensitive PDO 20, MTA levels were measured in a clone infected with the inducible MTAP overexpression construct. MTA levels were measured in both the absence (red bar) and presence (white bar, red outline) of doxycycline, resulting in expression of wild-type MTAP protein. (G) Correlation plot showing correlation (significant, P = 0.0079, Pearson correlation) between MTA levels (x-axis) and sensitivity to EZP015556, depicted by the AUC (y-axis).

References

    1. Howlader N., Noone A., Krapcho M., Miller D., Bishop K., Kosary C. et al. , “SEER Cancer Statistics Review, 1975–2014” (National Cancer Institute, 2016).
    1. Schmuck R. B., de Carvalho-Fischer C. V., Neumann C., Pratschke J., Bahra M., Distal bile duct carcinomas and pancreatic ductal adenocarcinomas: Postulating a common tumor entity. Cancer Med. 5, 88–99 (2016). - PMC - PubMed
    1. Conroy T., Desseigne F., Ychou M., Bouche O., Guimbaud R., Becouarn Y. et al. , FOLFIRINOX versus gemcitabine for metastatic pancreatic cancer. N. Engl J Med. 364, 1817–1825 (2011). - PubMed
    1. Von Hoff D. D., Ervin T., Arena F. P., Chiorean E. G., Infante J., Moore M et al. , Increased survival in pancreatic cancer with nab-paclitaxel plus gemcitabine. N. Engl J Med. 369, 1691–1703. - PMC - PubMed
    1. Seino T., et al. , Human pancreatic tumor organoids reveal loss of stem cell niche factor dependence during disease progression. Cell Stem Cell 22, 454–467.e6 (2018). - PubMed

LinkOut - more resources