

Vaccine-Specific Immune Responses against Mycobacterium ulcerans Infection in a Low-Dose Murine Challenge Model
- PMID: 31818964
- PMCID: PMC7035934
- DOI: 10.1128/IAI.00753-19
Vaccine-Specific Immune Responses against Mycobacterium ulcerans Infection in a Low-Dose Murine Challenge Model
Abstract
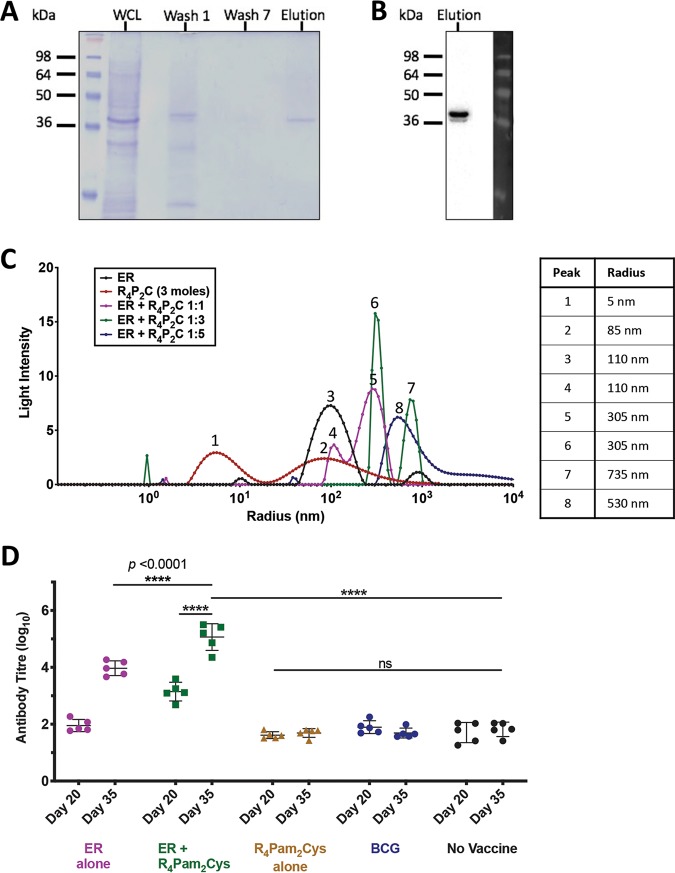
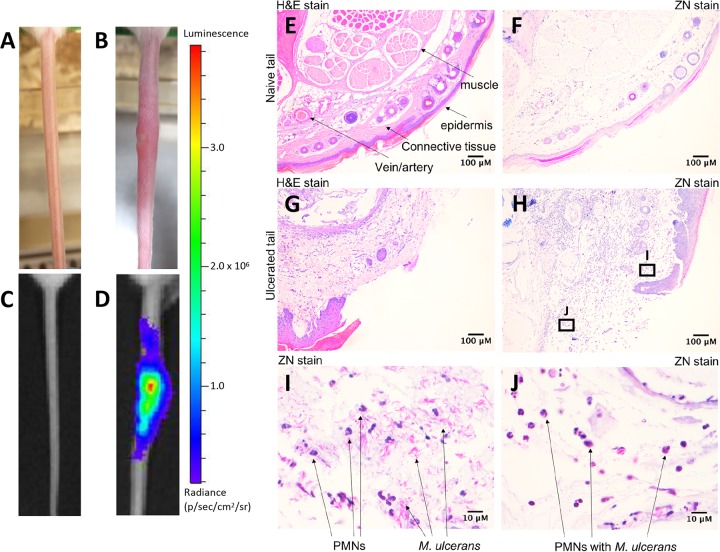
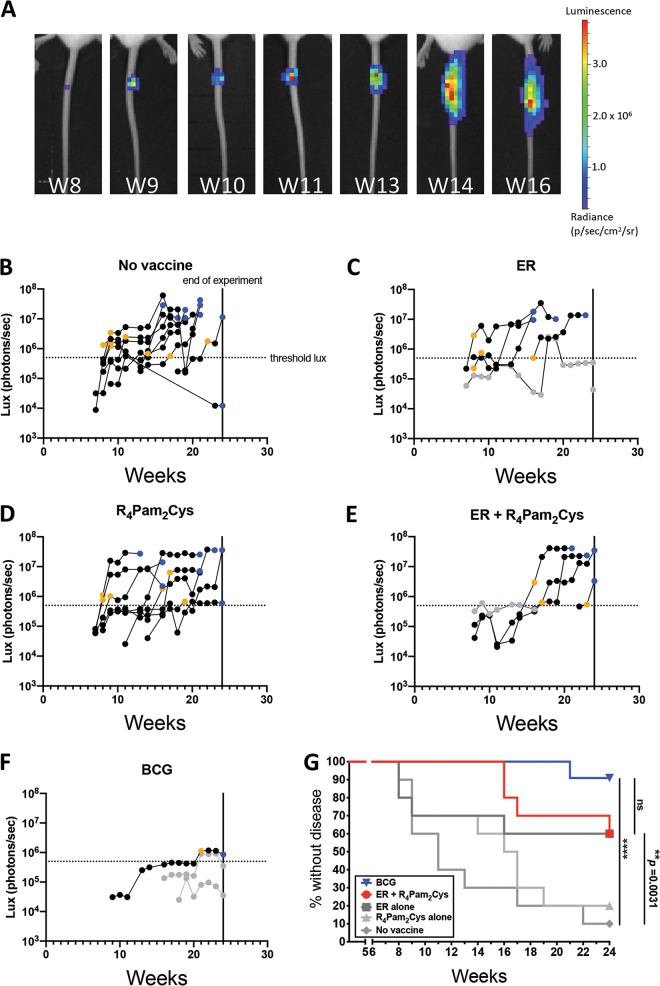
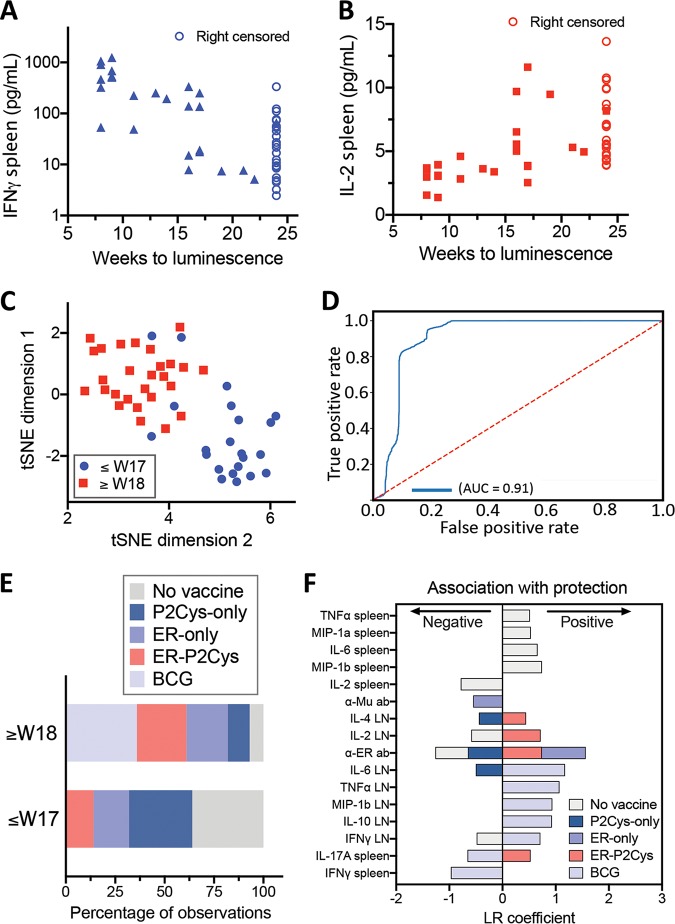
The neglected tropical disease Buruli ulcer (BU) is an infection of subcutaneous tissue with Mycobacterium ulcerans There is no effective vaccine. Here, we assessed an experimental prime-boost vaccine in a low-dose murine tail infection model. We used the enoyl reductase (ER) domain of the M. ulcerans mycolactone polyketide synthases electrostatically coupled with a previously described Toll-like receptor 2 (TLR-2) agonist-based lipopeptide adjuvant, R4Pam2Cys. Mice were vaccinated and then challenged via tail inoculation with 14 to 20 CFU of a bioluminescent strain of M. ulcerans Mice receiving either the experimental ER vaccine or Mycobacterium bovis bacillus Calmette-Guérin (BCG) were equally protected, with both groups faring significantly better than nonvaccinated animals (P < 0.05). To explore potential correlates of protection, a suite of 29 immune parameters were assessed in the mice at the end of the experimental period. Multivariate statistical approaches were used to interrogate the immune response data to develop disease-prognostic models. High levels of interleukin 2 (IL-2) and low gamma interferon (IFN-γ) produced in the spleen best predicted control of infection across all vaccine groups. Univariate logistic regression revealed vaccine-specific profiles of protection. High titers of ER-specific IgG serum antibodies together with IL-2 and IL-4 in the draining lymph node (DLN) were associated with protection induced by the ER vaccine. In contrast, high titers of IL-6, tumor necrosis factor alpha (TNF-α), IFN-γ, and IL-10 in the DLN and low IFN-γ titers in the spleen were associated with protection following BCG vaccination. This study suggests that an effective BU vaccine must induce localized, tissue-specific immune profiles with controlled inflammatory responses at the site of infection.
Keywords: Buruli ulcer; Mycobacterium ulcerans; machine learning; mycolactone; polyketide synthase; vaccine.
Copyright © 2020 American Society for Microbiology.
Figures
Similar articles
-
Recombinant BCG Expressing Mycobacterium ulcerans Ag85A Imparts Enhanced Protection against Experimental Buruli ulcer.PLoS Negl Trop Dis. 2015 Sep 22;9(9):e0004046. doi: 10.1371/journal.pntd.0004046. eCollection 2015 Sep. PLoS Negl Trop Dis. 2015. PMID: 26393347 Free PMC article.
-
Cellular immunity confers transient protection in experimental Buruli ulcer following BCG or mycolactone-negative Mycobacterium ulcerans vaccination.PLoS One. 2012;7(3):e33406. doi: 10.1371/journal.pone.0033406. Epub 2012 Mar 8. PLoS One. 2012. PMID: 22413022 Free PMC article.
-
Analysis of the vaccine potential of plasmid DNA encoding nine mycolactone polyketide synthase domains in Mycobacterium ulcerans infected mice.PLoS Negl Trop Dis. 2014 Jan 2;8(1):e2604. doi: 10.1371/journal.pntd.0002604. eCollection 2014. PLoS Negl Trop Dis. 2014. PMID: 24392169 Free PMC article.
-
Buruli ulcer.Hum Vaccin. 2011 Nov;7(11):1198-203. doi: 10.4161/hv.7.11.17751. Epub 2011 Nov 1. Hum Vaccin. 2011. PMID: 22048117 Review.
-
Buruli ulcer: The Efficacy of Innate Immune Defense May Be a Key Determinant for the Outcome of Infection With Mycobacterium ulcerans.Front Microbiol. 2020 May 25;11:1018. doi: 10.3389/fmicb.2020.01018. eCollection 2020. Front Microbiol. 2020. PMID: 32523571 Free PMC article. Review.
Cited by
-
Protective Efficacy of BCG Vaccine against Mycobacterium leprae and Non-Tuberculous Mycobacterial Infections.Vaccines (Basel). 2022 Mar 3;10(3):390. doi: 10.3390/vaccines10030390. Vaccines (Basel). 2022. PMID: 35335022 Free PMC article. Review.
-
A human model of Buruli ulcer: Provisional protocol for a Mycobacterium ulcerans controlled human infection study.Wellcome Open Res. 2024 Oct 21;9:488. doi: 10.12688/wellcomeopenres.22719.2. eCollection 2024. Wellcome Open Res. 2024. PMID: 39386965 Free PMC article.
-
Multi-epitope vaccine candidates based on mycobacterial membrane protein large (MmpL) proteins against Mycobacterium ulcerans.Open Biol. 2023 Nov;13(11):230330. doi: 10.1098/rsob.230330. Epub 2023 Nov 8. Open Biol. 2023. PMID: 37935359 Free PMC article.
-
A composite subunit vaccine confers full protection against Buruli ulcer disease in the mouse footpad model of Mycobacterium ulcerans infection.PLoS Negl Trop Dis. 2025 Feb 21;19(2):e0012710. doi: 10.1371/journal.pntd.0012710. eCollection 2025 Feb. PLoS Negl Trop Dis. 2025. PMID: 39982950 Free PMC article.
-
Lipopeptide adjuvants for antibiotics and vaccines: the future step in the fight against multidrug-resistant and extensively drug-resistant pathogens.Explor Drug Sci. 2024;2:203-233. doi: 10.37349/eds.2024.00043. Epub 2024 Apr 29. Explor Drug Sci. 2024. PMID: 40842601 Free PMC article.
References
-
- Guarner J, Bartlett J, Whitney EA, Raghunathan PL, Stienstra Y, Asamoa K, Etuaful S, Klutse E, Quarshie E, van der Werf TS, van der Graaf WT, King CH, Ashford DA. 2003. Histopathologic features of Mycobacterium ulcerans infection. Emerg Infect Dis 9:651–656. doi:10.3201/eid0906.020485. - DOI - PMC - PubMed
-
- Vincent QB, Ardant M-F, Adeye A, Goundote A, Saint-André J-P, Cottin J, Kempf M, Agossadou D, Johnson C, Abel L, Marsollier L, Chauty A, Alcaïs A. 2014. Clinical epidemiology of laboratory-confirmed Buruli ulcer in Benin: a cohort study. Lancet Glob Health 2:e422–e430. doi:10.1016/S2214-109X(14)70223-2. - DOI - PubMed
-
- Oliveira MS, Fraga AG, Torrado E, Castro AG, Pereira JP, Filho AL, Milanezi F, Schmitt FC, Meyers WM, Portaels F, Silva MT, Pedrosa J. 2005. Infection with Mycobacterium ulcerans induces persistent inflammatory responses in mice. Infect Immun 73:6299–6310. doi:10.1128/IAI.73.10.6299-6310.2005. - DOI - PMC - PubMed
-
- Yerramilli A, Tay EL, Stewardson AJ, Kelley PG, Bishop E, Jenkin GA, Starr M, Trevillyan J, Hughes A, Friedman ND, O'Brien DP, Johnson PDR. 2017. The location of Australian Buruli ulcer lesions–implications for unravelling disease transmission. PLoS Negl Trop Dis 11:e0005800. doi:10.1371/journal.pntd.0005800. - DOI - PMC - PubMed
Publication types
MeSH terms
Substances
LinkOut - more resources
Full Text Sources
Medical
Molecular Biology Databases
Miscellaneous
