. 2020 Jan 15;40(3):694-709.
doi: 10.1523/JNEUROSCI.1446-19.2019. Epub 2019 Dec 9.

SIRT3 Haploinsufficiency Aggravates Loss of GABAergic Interneurons and Neuronal Network Hyperexcitability in an Alzheimer's Disease Model

Affiliations

SIRT3 Haploinsufficiency Aggravates Loss of GABAergic Interneurons and Neuronal Network Hyperexcitability in an Alzheimer's Disease Model

Aiwu Cheng et al. J Neurosci. .

Abstract

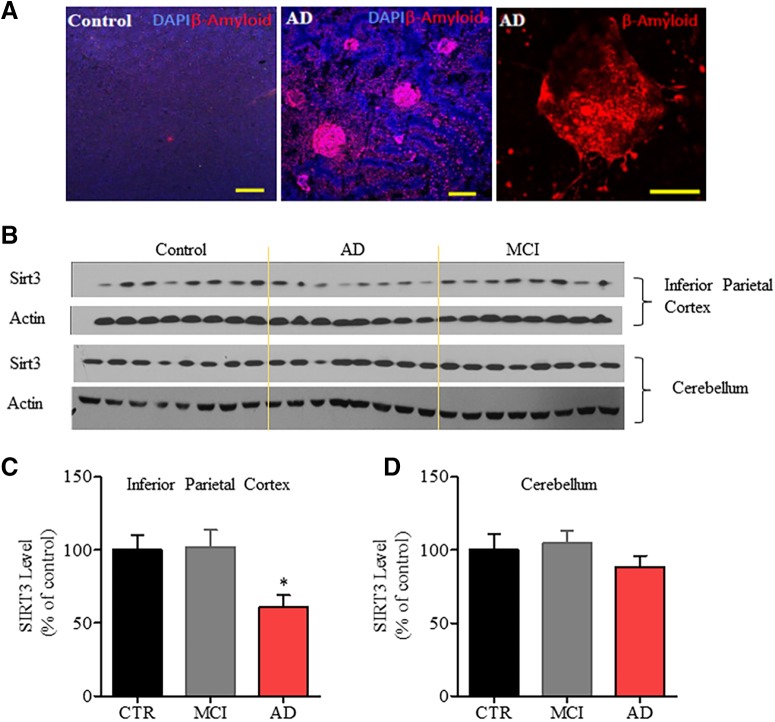
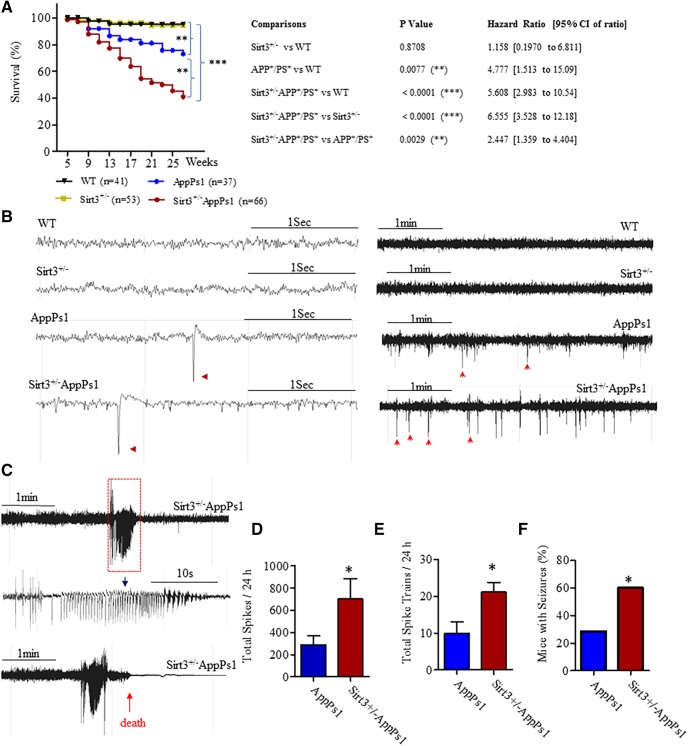
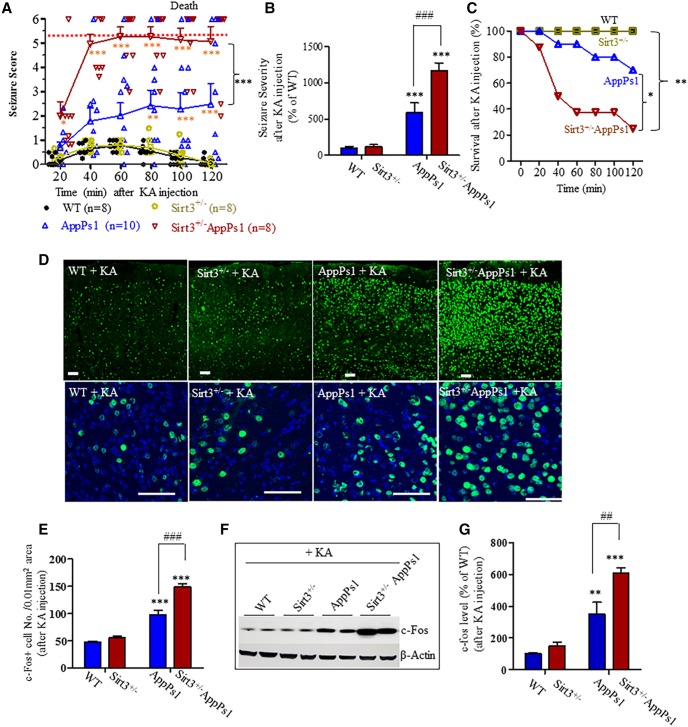
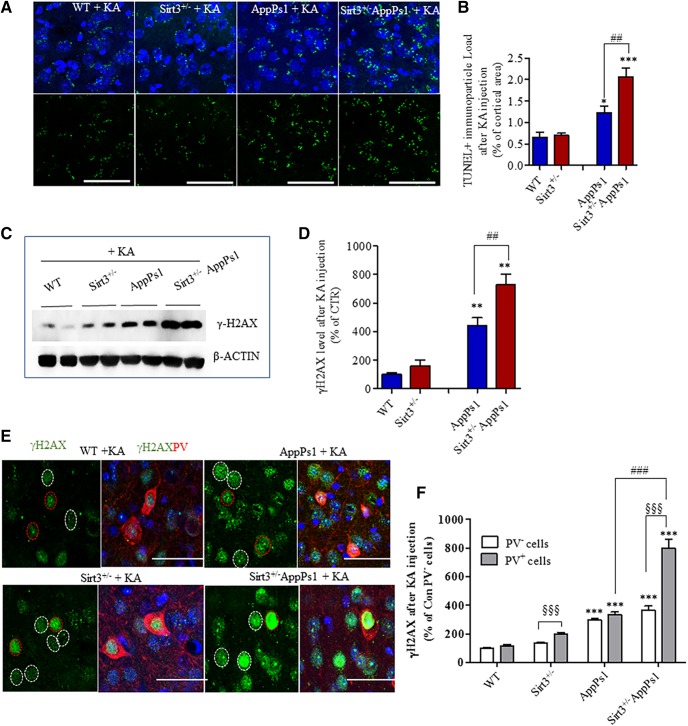
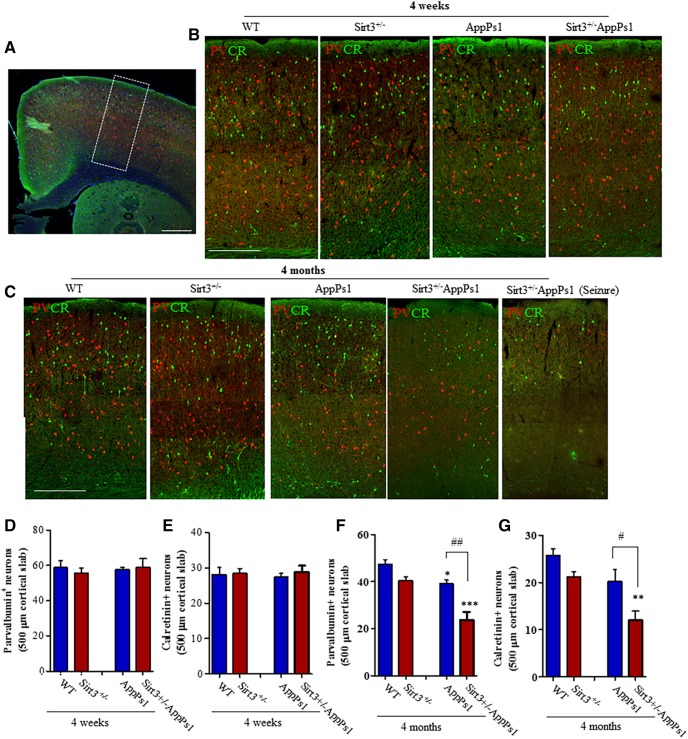
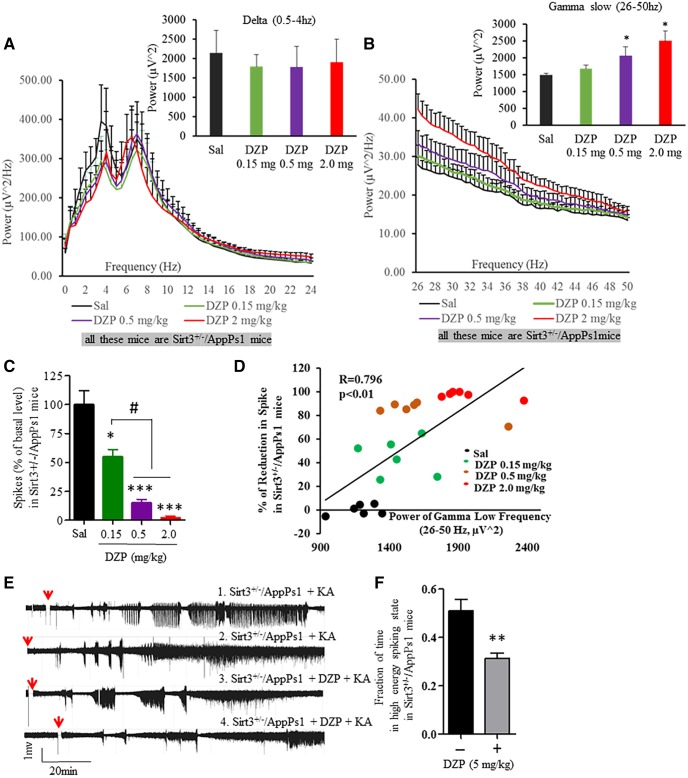
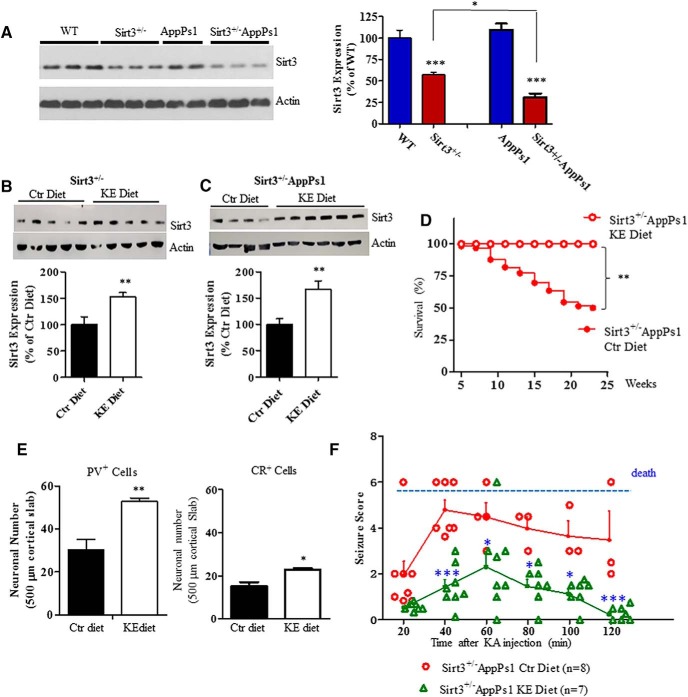
Impaired mitochondrial function and aberrant neuronal network activity are believed to be early events in the pathogenesis of Alzheimer's disease (AD), but how mitochondrial alterations contribute to aberrant activity in neuronal circuits is unknown. In this study, we examined the function of mitochondrial protein deacetylase sirtuin 3 (SIRT3) in the pathogenesis of AD. Compared with AppPs1 mice, Sirt3-haploinsufficient AppPs1 mice (Sirt3+/-AppPs1) exhibit early epileptiform EEG activity and seizure. Both male and female Sirt3+/-AppPs1 mice were observed to die prematurely before 5 months of age. When comparing male mice among different genotypes, Sirt3 haploinsufficiency renders GABAergic interneurons in the cerebral cortex vulnerable to degeneration and associated neuronal network hyperexcitability. Feeding Sirt3+/-AppPs1 AD mice with a ketone ester-rich diet increases SIRT3 expression and prevents seizure-related death and the degeneration of GABAergic neurons, indicating that the aggravated GABAergic neuron loss and neuronal network hyperexcitability in Sirt3+/-AppPs1 mice are caused by SIRT3 reduction and can be rescued by increase of SIRT3 expression. Consistent with a protective role in AD, SIRT3 levels are reduced in association with cerebral cortical Aβ pathology in AD patients. In summary, SIRT3 preserves GABAergic interneurons and protects cerebral circuits against hyperexcitability, and this neuroprotective mechanism can be bolstered by dietary ketone esters.SIGNIFICANCE STATEMENT GABAergic neurons provide the main inhibitory control of neuronal activity in the brain. By preserving mitochondrial function, SIRT3 protects parvalbumin and calretinin interneurons against Aβ-associated dysfunction and degeneration in AppPs1 Alzheimer's disease mice, thus restraining neuronal network hyperactivity. The neuronal network dysfunction that occurs in Alzheimer's disease can be partially reversed by physiological, dietary, and pharmacological interventions to increase SIRT3 expression and enhance the functionality of GABAergic interneurons.

Keywords: Alzheimer disease; GABAergic; hyperexcitability; mitochondria; seizure; telemetry.


Figures

Figure 1.
Figure 1.
SIRT3 protein levels are reduced in the inferior parietal cortex, but not in the cerebellum, of AD patients. A, Representative images showing Aβ plaques in the inferior parietal cortex of Control and AD patient. Red represents β-amyloid immunostaining. Blue represents DAPI staining. Scale bar, 100 μm. B, Immunoblot analysis of SIRT3 protein levels in samples of inferior parietal cortex (top) and cerebellum (bottom) of 8 neurologically normal control subjects, 8 patients with MCI, and 8 AD patients. C, D, Results of densitometric analysis of SIRT3 protein levels in inferior parietal cortex (C) and cerebellum (D), normalized to the actin level in the same blot. Values are expressed as a percentage of the SIRT3 level in samples from control subjects (mean ± SEM; n = 8 for each group). One-way ANOVA followed by Bonferroni post hoc tests: for inferior parietal cortex (C), F(2,21) = 5.079, *p = 0.0159. *p < 0.05, comparing Control versus AD or MCI versus AD. For cerebellum (D), F(2,21) = 0.8415, p = 0.4451.
Figure 2.
Figure 2.
SIRT3 haploinsufficiency triggers cerebral hyperexcitability, seizures, and early death in AppPs1 AD mice. A, Modified Kaplan–Meier survival curves mice of the four indicated genotypes within 27 weeks. WT (n = 41: 19 females and 22 males); Sirt3+/− (n = 53: 23 females and 30 males); AppPs1 (n = 37, 17 females and 20 males); Sirt3+/−AppPs1 (n = 66: 27 females and 39 males). Survival data were analyzed by the Cox proportional hazards model to generate HRs and 95% CI of ratios. The statistical significance of the differences in survival curves was determined by log-rank test. Right, p values for the comparisons between different types of mice and their HRs. (See Figure 2-1. There were no gender differences in survival rates for AppPs1 and Sirt3+/−AppPs1 mice within 27 weeks. A, B, Modified Kaplan–Meier survival curves for female and male mice of AppPs1 (A) and Sirt3+/−AppPs1 (B) mice before the age of 27 weeks. AppPs1 (n = 7 females and 20 males); Sirt3+/−AppPs1 (n = 7 females and 39 males). The statistical significance between female and male survival curves was determined by log-rank test. Survival data were analyzed by the Cox proportional hazards model to generate HRs and 95% CI of ratios. p values and HRs (female vs male) are indicated in the figures. B, Examples of home cage EEG recordings showing high time resolution traces from WT, Sirt3+/−, AppPs1, and Sirt3+/−AppPs1 mice. Calibration: 1 s. Red arrowheads indicate representative large-amplitude single spikes observed in AppPs1 and Sirt3+/−AppPs1 mice, respectively. Following brief high-resolution traces, total 5 min traces from each genotype are shown to illustrate the differences of spike occurrence among them. Calibration: 1 min. Arrows indicate some of representative large-amplitude single spikes. C, EEG recordings showing examples of bursts of epileptiform activity in two Sirt3+/−AppPs1 mice. Bottom, In the case of the EEG recording, the mouse died shortly after the seizure-like activity. D, Quantitative analysis of high-voltage spikes in AppPs1 and Sirt3+/−AppPs1 during a 24 h recording period. Values are mean ± SEM. AppPs1, n = 8; Sirt3+/−AppPs1, n = 9. *p = 0.0346, unpaired t test (one-tailed). E, Quantitative analysis of spike trains/bursts during a 24 h recording period in AppPs1 and Sirt3+/−AppPs1. Values are mean ± SEM. AppPs1, n = 4; Sirt3+/−AppPs1, n = 6. *p = 0.0129, unpaired t test (one-tailed). F, Percentages of mice exhibiting behavioral manifestations of seizures determined by examination of home cage video recordings. AppPs1 number (seizure vs nonseizure) = 18 (4, 14) and Sirt3+/−AppPs1 (seizure vs nonseizure) = 12 (8, 4). *p = 0.039, Fisher exact test (two-sided), and the strength of association: relative risk = 3.0.
Figure 3.
Figure 3.
SIRT3 haploinsufficiency sensitizes AppPs1 AD mice to KA-induced seizures and death. A, B, Mice (14–17 weeks old) were administered KA (20 mg/kg, i.p.), and seizure scores were recorded during 10 min intervals during a 120 min period. A, The average values for every two consecutive 10 min intervals were plotted. B, Overall seizure severity was determined by integrating individual scores per mouse over the duration of the observation period (see Materials and Methods). Values are expressed as a percentage of the value for WT mice (mean ± SEM; 8–10 mice/group). A, Two-way ANOVA followed by Bonferroni post tests: Fgroup(3,176) = 127.9, ***p < 0.001; Ftime(5,176) = 6.6716, ***p < 0.001; interaction *p = 0.017, *p < 0.05, **p < 0.01, ***p < 0.001 versus WT or Sirt3+/− mice at the corresponding time points. ***p < 0.001, comparing AppPs1 mice to Sirt3+/−AppPs1 mice at 40, 60, 80, 100, and 120 min time points, respectively. B, Factorial two-way ANOVA (the presence of human AppPs1 and the haploinsufficiency of SIRT3 are considered to be two separate factors) followed by Bonferroni post tests: Fsirt3(1,30) = 10.72, **p = 0.0033; FAppPs1(1,30) = 68.72, ***p < 0.0001; interaction **p = 0.0052, ***p < 0.001 versus WT or Sirt3+/−; ###p < 0.001, between AppPs1 and Sirt3+/−AppPs1. C, Survival plots for mice of the four genotypes of mice during the 2 h period after KA injection as in Figure 2A. WT = 8, Sirt+/− = 8, AppPs1 = 10, and Sirt+/−AppPs1 = 8 mice. The statistical significance between survival curves was determined by log-rank test. p values for the comparisons between different type of mice and their HRs gained by two-sided Cox proportional hazards model were as follows: Sirt3+/− versus WT, p = 1.0; AppPs1 versus WT or Sirt3+/−, p = 0.1014, HR = 6.664; Sirt3+/−AppPs1 versus WT or Sirt3+/−, **p = 0.0023, HR = 14.38; Sirt3+/−AppPs1 versus AppPs1, *p = 0.0361, HR = 4.786. All the HRs are within 95% CI of ratios. D, Confocal images of c-Fos immunostaining (green) and cell nucleus staining with DAPI (blue) in sections of frontal cortex in mice of the indicated genotypes. Scale bar, 50 μm. E, Numbers of c-Fos+ cells per 0.01 mm2 area in sections of the frontal cortex of mice of each genotype. F, Immunoblot analysis of c-Fos levels in frontal cortex of mice 2 h after KA injection. The immunoblots were reprobed with an actin antibody. G, Results of densitometric analysis of immunoblots. Levels of c-Fos were normalized to the level of actin in the same sample. Values are expressed as a percentage of the value for WT mice. E, G, Values are mean ± SEM (4 or 5 mice/group). Factorial two-way ANOVA followed by Bonferroni post hoc tests: Fsirt3(1,16) = 28.25, ***p < 0.0001; FAppPs1(1,16) = 164.1, ***p < 0.0001; interaction **p = 0.0014 for E; and Fsirt3(1,12) = 13.49, **p = 0.0037; FAppPs1(1,12) = 71.56, ***p < 0.0001; interaction *p = 0.0302 for F. **p < 0.01, ***p < 0.001 versus WT or Sirt3+/− mice. ## p < 0.01, ###p < 0.001 between AppPs1 and Sirt3+/−AppPs1.
Figure 4.
Figure 4.
SIRT3 haploinsufficiency sensitizes PV-expressing cortical interneurons to KA-induced DNA damage. Mice (14–17 weeks old) were administered 20 mg/kg KA and 2 h later were either perfused transcardially with 4% PFA (for immunohistochemistry) or fresh cortical tissues were collected for immunoblot analysis. A, Confocal images of TUNEL staining (green) in sections of frontal cortex from mice of the indicated genotypes; sections were counterstained with DAPI to label nuclei (blue). Scale bar, 50 μm. B, TUNEL+ particle load expressed as a percentage of the total area of the microscope field. C, Immunoblot of γ-H2AX and actin in samples of frontal cortex from mice of the indicated genotypes. D, Results of densitometric analysis of γ-H2AX levels in frontal cortex of mice of the indicated genotypes. γ-H2AX levels were normalized to the actin level in the same sample. Values are expressed as a percentage of the value for WT mice. B, D, Values are mean ± SEM (4 or 5 mice/group). Factorial two-way ANOVA followed by Bonferroni post hoc tests: Fsirt3(1,13) = 9.215, **p = 0.0096; FAppPs1(1,13) = 45.13, ***p < 0.0001; interaction *p = 0.0192 for B; and Fsirt3(1,14) = 9.647, **p = 0.0077; FAppPs1(1,14) = 66.78, ***p < 0.0001; interaction p = 0.0649 for D. *p < 0.05, **p < 0.01, ***p < 0.001 versus WT or Sirt3+/− mice. ##p < 0.01 between AppPs1 and Sirt3+/−AppPs1. E, Confocal images showing γ-H2AX (green) and PV (red) immunoreactivities in frontal cortex sections from mice of the indicated genotypes after KA injection. The sections were counterstained with DAPI (blue). Red circles represent nuclei of PV+ neurons. White circles represent nuclei of PV neurons. F, Quantitative analysis of γ-H2AX immunostaining intensity in all cells (mean) and PV+ cells. Values are percentage of the mean value for WT mice. Values are mean ± SEM (n = 4 or 5 mice; 15–26 images analyzed/mouse). Two-way ANOVA followed by Bonferroni post hoc tests for group and unpaired t post hoc tests for cell types: Fgroup(3,26) = 95.58, ***p < 0.0001; Fpv cells(1,26) = 40.91, ***p < 0.0001; interaction ***p < 0.0001. ***p < 0.001 versus WT. ###p < 0.001 between AppPs1 and Sirt3+/−AppPs1. §§§p < 0.001 between PV and PV+ cells.
Figure 5.
Figure 5.
SIRT3 haploinsufficiency triggers loss of PV and CR GABAergic interneurons in AppPs1 AD mice. A, Confocal images showing a coronal section from the frontal cortex of a WT mouse immunostained with PV (red) and CR (green) antibodies. Dotted box represents the region of cortex analyzed. Scale bar, 500 μm. B, Images represent PV and CR immunoreactive neurons in frontal cortex sections from 4-week-old mice of the indicated genotypes. Scale bar, 500 μm. C, Images represent PV and CR immunoreactive neurons in frontal cortex sections from 4-month-old mice of the indicated genotypes. Scale bar, 500 μm. D–G, Graphs represent numbers of PV neurons (D, F) and CR neurons (E, G) in 4-week-old (D, E) and 4-month-old (F, G) mice of the indicated genotypes. Values are mean ± SEM (4–6 mice/group). Factorial two-way ANOVA followed by Bonferroni post hoc tests: Fsirt3(1,12) = 0.1242, p = 0.7306; FAppPs1(1,12) = 0.1058, p = 0.7505; interaction p = 0.6251 for D; Fsirt3(1,12) = 0.2918, p = 0.5989; FAppPs1(1,12) = 0.005, p = 0.9439; interaction p = 0.7076 for E; Fsirt3(1,16) = 25.10 ***p = 0.0001, FAppPs1(1,16) = 31.67, ***p < 0.0001, interaction p = 0.0726 for F; Fsirt3(1,16) = 17.15, ***p = 0.0007; FAppPs1(1,16) = 17.25, ***p = 0.0008; interaction p = 0.0503 for G. *p < 0.05, **p < 0.01, ***p < 0.001 versus WT or Sirt3+/−. #p < 0.05, ##p < 0.01 between AppPs1 and Sirt3+/−AppPs1. See Figure 5-1). Loss of GABAergic interneurons in Sirt3+/−/AppPs1 mice in the entorhinal cortex and subiculum. A, Images represent a cerebral hemisphere in a caudal coronal brain section from a 4-month-old WT mouse immunostained with PV (red) and CR (green) antibodies. Yellow and white dotted boxes represent the regions of entorhinal cortex and subiculum, respectively, that were analyzed. B, Images represent PV (red) and CR (green) immunoreactive neurons in entorhinal cortex (top) and subiculum (bottom) of 4-month-old mice of the indicated genotypes. C–E, Graphs represent numbers of PV+ cells (C, E) and CR+ cells (D) in 500-μm-wide areas of EC (yellow box area) (C, D) and subiculum (E) (white box area) of 4-month-old mice of the indicated genotypes. Values are mean and SD (n = 4–6 mice/group). Factorial two-way ANOVA followed by Bonferroni post hoc tests: Fsirt3(1,16) = 4.694, *p = 0.0457; FAppPs1(1,16) = 8.70, **p = 0.0094; interaction p = 0.1895 for C; Fsirt3(1,16) = 8.459, *p = 0.0103; FAppPs1(1,16) = 11.53, **p = 0.0037; interaction p = 0.9862 for D; Fsirt3(1,16) = 17.17, ***p = 0.0008; FAppPs1(1,16) = 66.97, ***p < 0.0001; interaction *p = 0.0163 for E. *p < 0.05, **p < 0.01, ***p < 0.001 versus WT or Sirt3+/−. #p < 0.05, ###p < 0.001 comparing AppPs1 and Sirt3+/−AppPs1.
Figure 6.
Figure 6.
DZP increases gamma frequency power and suppresses epileptiform EEG activity in Sirt3+/−/AppPs1 mice. A, B, EEG power spectra at 0–24 Hz (A) and 26–50 Hz (B) averaged from a 6 h period after administering the indicated doses of DZP (mg/kg) to Sirt3+/−/AppPs1 mice. Bar graph represents analysis of frequency band powers (A, delta band, 0.5–4 Hz; B, gamma slow band, 26–50 Hz). Values are mean ± SEM (n = 6 mice). C, Quantitative analysis of high-voltage spikes during a 6 h period after administration of the indicated doses of DZP in Sirt3+/−/AppPs1 mice. Values are expressed as a percentage of the saline-treated value before administration of DZP. Values are mean ± SEM (n = 6 mice), One-way ANOVA with Student-Newman-Keuls post hoc tests: F(3,20) = 0.1053, p = 0.9560 for A; F(3,20) = 12.98, *p = 0.0108 for B; F(3,20) = 13.98, ***p < 0.0001 for C. *p < 0.05, ***p < 0.001 compared with the value for saline-treated control mice. #p < 0.05 between dosages. D, Correlation between the gamma slow band power and the percentage of reduction of high-voltage spikes after administration of the indicated doses of DZP (6 mice). Linear regression. Values are R2, p, and Spearman's ρ test. E, Examples of EEG recordings in Sirt3+/−/AppPs1 mice beginning 2 h after administration of KA (20 mg/kg). During the recording period, the mice were preadministered either saline or DZP (5 mg/kg) 45 min before KA injections. Red arrows indicate the time of KA injection. F, The fraction of time during the EEG recording period during which high-frequency spiking occurred during a 2 h period after KA administration. Values are mean ± SEM (4 mice/group). t(6) = 3.779, **p = 0.0046, unpaired t test.
Figure 7.
Figure 7.
A dietary KE prevents seizures and early death in Sirt3+/−AppPs1 AD mice. A, Immunoblot analysis of SIRT3 protein levels in frontal cortex of 4-month-old WT, SIRT3+/−, AppPs1, and SIRT3+/−/AppPs1 mice (6 or 7 mice per group). Values are mean ± SEM. Factorial two-way ANOVA followed by Bonferroni post hoc tests: Fsirt3(1,23) = 98.73, ***p < 0.0001; FAppPs1(1,23) = 1.878, p = 0.1838; interaction **p = 0.0082. ***p < 0.001 versus WT. *p < 0.05 between Sirt3+/− and Sirt3+/−AppPs1. B, C, Sirt3+/− (n = 10 mice) and Sirt3+/−/AppPs1 (n = 10) mice (4 months old) were fed either a KE-supplemented diet (KE) or a control diet (Ctr) ad libitum for 2 weeks. The cortical tissue was removed, and SIRT3 protein levels were determined by immunoblot analysis. Values are mean ± SEM. Unpaired t test (one-tailed): **p < 0.01. D, Survival plots for Sirt3+/−/AppPs1 mice maintained on either control or KE diets beginning at 1 month of age. Modified Kaplan–Meier survival curves for Sirt3+/−AppPs1 mice under control or KE diets within 23 weeks. Control diets, 66 mice; KE diets, 11 mice. The statistical significance between survival curves was determined by log-rank test. **p < 0.01. HR was gained by two-sided Cox proportional hazards model. HR (KE/control diet) = 0.2729 (95% CI of ratio: 0.1091–0.6829). E, Results of counts of neurons expressing PV or CR in the frontal cortex of 24-week-old Sirt3+/−/AppPs1 mice that had been maintained on control or KE diets (n = 4 or 5 mice/group). Values are mean ± SEM. Unpaired t test (one-tailed): **p < 0.05, **p < 0.01. F, Sirt3+/− /AppPs1 mice that had been maintained on KE (n = 7) or control (n = 8) diets from 4 to 24 weeks of age were administered 20 mg/kg KA, and seizure-related behaviors were scored every 10 min during a 2 h time period. The results are plotted as scattered individual points every 20 min and as the mean ± SEM at each time point (n = 7 or 8 mice) (solid lines). Two-way ANOVA followed by Bonferroni post hoc tests: Fgroup(1,61) = 73, ***p < 0.0001; Ftime(5,61) = 6.302, ***p < 0.0001; interaction p = 0.2692; *p < 0.05, ***p < 0.001 between KE and control food at the corresponding time point.

Comment in

Similar articles

Cited by

References

    1. Adamec E, Vonsattel JP, Nixon RA (1999) DNA strand breaks in Alzheimer's disease. Brain Res 849:67–77. 10.1016/S0006-8993(99)02004-1 - DOI - PubMed
    1. Amatniek JC, Hauser WA, DelCastillo-Castaneda C, Jacobs DM, Marder K, Bell K, Albert M, Brandt J, Stern Y (2006) Incidence and predictors of seizures in patients with Alzheimer's disease. Epilepsia 47:867–872. 10.1111/j.1528-1167.2006.00554.x - DOI - PubMed
    1. Ashe KH, Zahs KR (2010) Probing the biology of Alzheimer's disease in mice. Neuron 66:631–645. 10.1016/j.neuron.2010.04.031 - DOI - PMC - PubMed
    1. Bakker A, Krauss GL, Albert MS, Speck CL, Jones LR, Stark CE, Yassa MA, Bassett SS, Shelton AL, Gallagher M (2012) Reduction of hippocampal hyperactivity improves cognition in amnestic mild cognitive impairment. Neuron 74:467–474. 10.1016/j.neuron.2012.03.023 - DOI - PMC - PubMed
    1. Borchelt DR, Ratovitski T, van Lare J, Lee MK, Gonzales V, Jenkins NA, Copeland NG, Price DL, Sisodia SS (1997) Accelerated amyloid deposition in the brains of transgenic mice coexpressing mutant presenilin 1 and amyloid precursor proteins. Neuron 19:939–945. 10.1016/S0896-6273(00)80974-5 - DOI - PubMed

Publication types

MeSH terms