

Convergence between Microglia and Peripheral Macrophages Phenotype during Development and Neuroinflammation
- PMID: 31818979
- PMCID: PMC6975289
- DOI: 10.1523/JNEUROSCI.1523-19.2019
Convergence between Microglia and Peripheral Macrophages Phenotype during Development and Neuroinflammation
Abstract
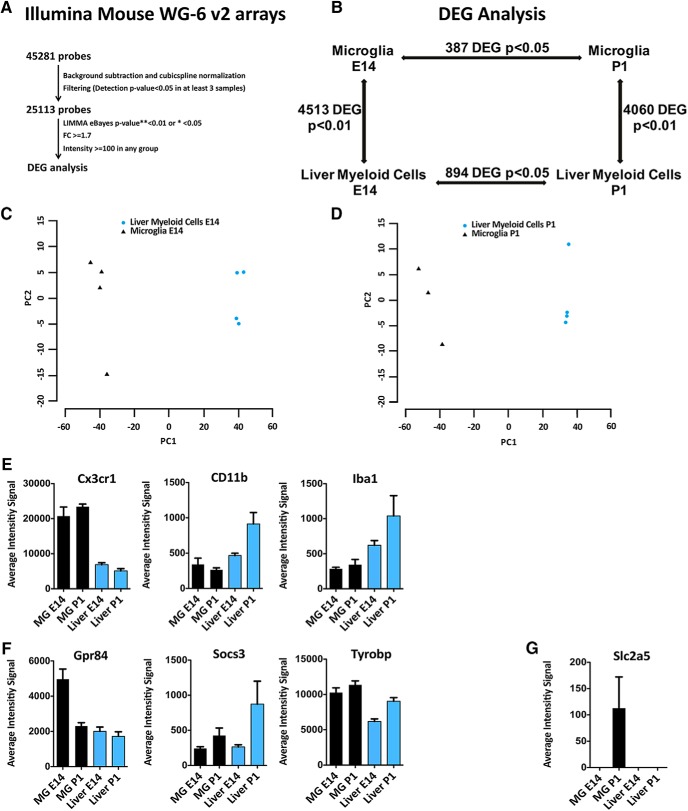
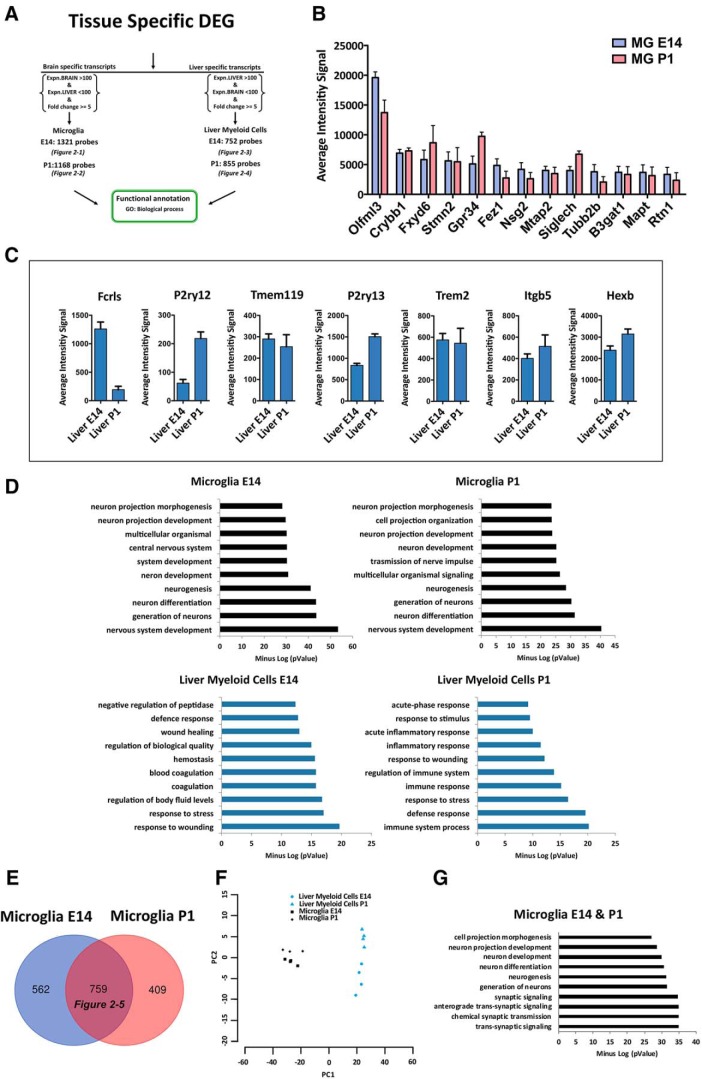
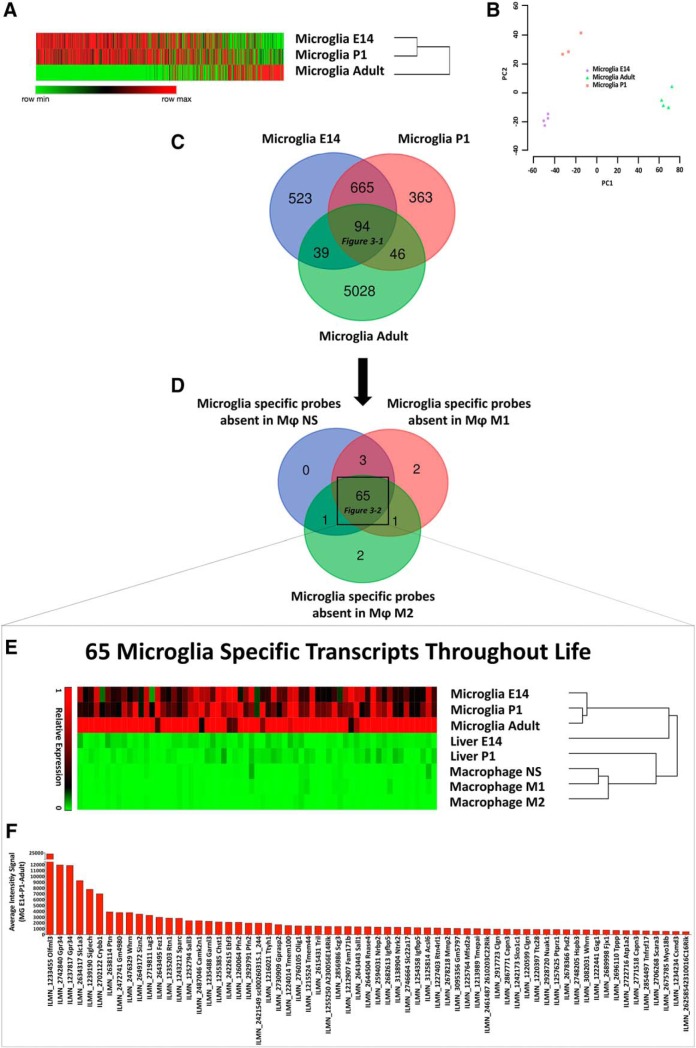
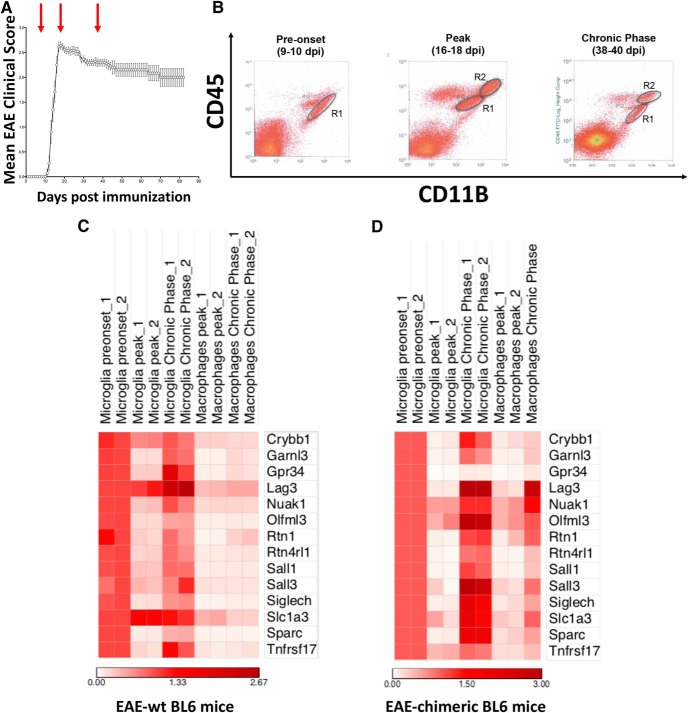
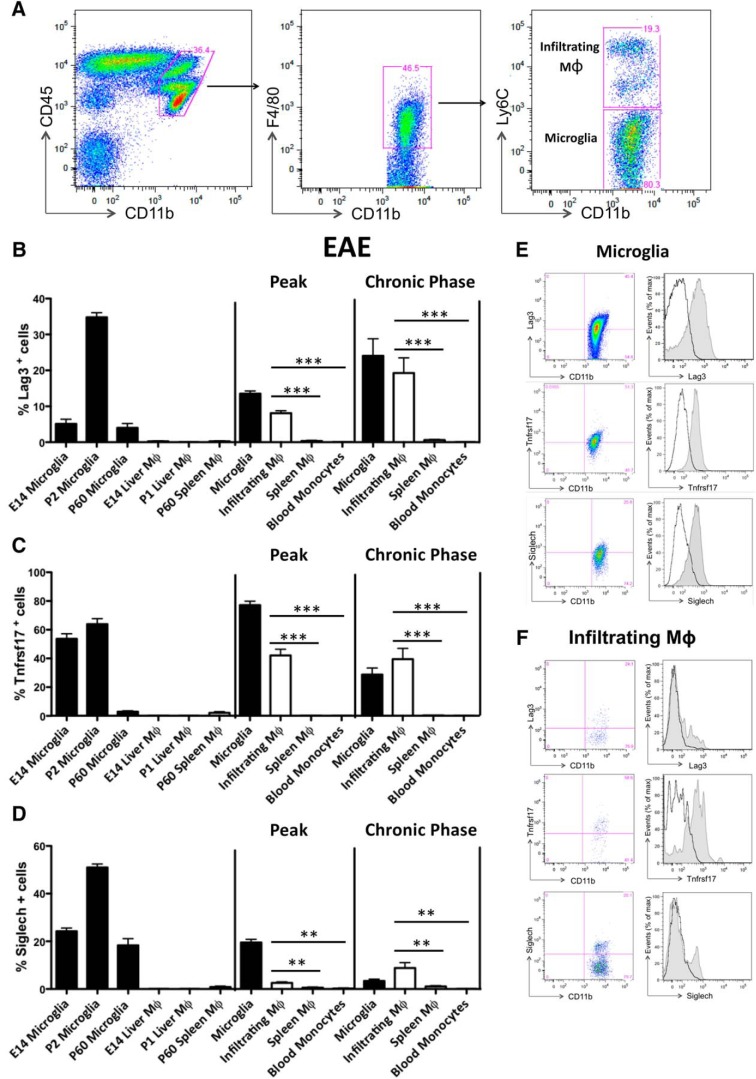
Differently from other myeloid cells, microglia derive exclusively from precursors originating within the yolk sac and migrate to the CNS under development, without any contribution from fetal liver or postnatal hematopoiesis. Consistent with their unique ontology, microglia may express specific physiological markers, which have been partly described in recent years. Here we wondered whether profiles distinguishing microglia from peripheral macrophages vary with age and under pathology. To this goal, we profiled transcriptomes of microglia throughout the lifespan and included a parallel comparison with peripheral macrophages under physiological and neuroinflammatory settings using age- and sex-matched wild-type and bone marrow chimera mouse models. This comprehensive approach demonstrated that the phenotypic differentiation between microglia and peripheral macrophages is age-dependent and that peripheral macrophages do express some of the most commonly described microglia-specific markers early during development, such as Fcrls, P2ry12, Tmem119, and Trem2. Further, during chronic neuroinflammation CNS-infiltrating macrophages and not peripheral myeloid cells acquire microglial markers, indicating that the CNS niche may instruct peripheral myeloid cells to gain the phenotype and, presumably, the function of the microglia cell. In conclusion, our data provide further evidence about the plasticity of the myeloid cell and suggest caution in the strict definition and application of microglia-specific markers.SIGNIFICANCE STATEMENT Understanding the respective role of microglia and infiltrating monocytes in neuroinflammatory conditions has recently seemed possible by the identification of a specific microglia signature. Here instead we provide evidence that peripheral macrophages may express some of the most commonly described microglia markers at some developmental stages or pathological conditions, in particular during chronic neuroinflammation. Further, our data support the hypothesis about phenotypic plasticity and convergence among distinct myeloid cells so that they may act as a functional unit rather than as different entities, boosting their mutual functions in different phases of disease. This holds relevant implications in the view of the growing use of myeloid cell therapies to treat brain disease in humans.
Keywords: EAE; development; macrophages; microglia; plasticity; tissue-reprogramming.
Copyright © 2020 the authors.
Figures
Similar articles
-
The phenotypic convergence between microglia and peripheral macrophages during development and neuroinflammation paves the way for new therapeutic perspectives.Neural Regen Res. 2021 Apr;16(4):635-637. doi: 10.4103/1673-5374.295272. Neural Regen Res. 2021. PMID: 33063713 Free PMC article.
-
High-parameter cytometry unmasks microglial cell spatio-temporal response kinetics in severe neuroinflammatory disease.J Neuroinflammation. 2021 Jul 26;18(1):166. doi: 10.1186/s12974-021-02214-y. J Neuroinflammation. 2021. PMID: 34311763 Free PMC article.
-
Cellular players that shape evolving pathology and neurodegeneration following traumatic brain injury.Brain Behav Immun. 2018 Jul;71:9-17. doi: 10.1016/j.bbi.2018.03.033. Epub 2018 Mar 27. Brain Behav Immun. 2018. PMID: 29601944 Review.
-
Differential transcriptional profiles identify microglial- and macrophage-specific gene markers expressed during virus-induced neuroinflammation.J Neuroinflammation. 2019 Jul 20;16(1):152. doi: 10.1186/s12974-019-1545-x. J Neuroinflammation. 2019. PMID: 31325960 Free PMC article.
-
Microglia and Neuroinflammation: What Place for P2RY12?Int J Mol Sci. 2021 Feb 6;22(4):1636. doi: 10.3390/ijms22041636. Int J Mol Sci. 2021. PMID: 33561958 Free PMC article. Review.
Cited by
-
Sex- and region-specific cortical and hippocampal whole genome transcriptome profiles from control and APP/PS1 Alzheimer's disease mice.PLoS One. 2024 Feb 7;19(2):e0296959. doi: 10.1371/journal.pone.0296959. eCollection 2024. PLoS One. 2024. PMID: 38324617 Free PMC article.
-
Cross-Talk and Subset Control of Microglia and Associated Myeloid Cells in Neurological Disorders.Cells. 2022 Oct 25;11(21):3364. doi: 10.3390/cells11213364. Cells. 2022. PMID: 36359758 Free PMC article. Review.
-
Microglial SIRPα Deletion Facilitates Synapse Loss in Preclinical Models of Neurodegeneration.Neurosci Bull. 2022 Feb;38(2):232-234. doi: 10.1007/s12264-021-00795-5. Epub 2021 Nov 10. Neurosci Bull. 2022. PMID: 34757517 Free PMC article. No abstract available.
-
Robust neuroinflammation and perivascular pathology in rTg-DI rats, a novel model of microvascular cerebral amyloid angiopathy.J Neuroinflammation. 2020 Mar 4;17(1):78. doi: 10.1186/s12974-020-01755-y. J Neuroinflammation. 2020. PMID: 32127016 Free PMC article.
-
Immunosuppressive Functions of M2 Macrophages Derived from iPSCs of Patients with ALS and Healthy Controls.iScience. 2020 Jun 26;23(6):101192. doi: 10.1016/j.isci.2020.101192. Epub 2020 May 23. iScience. 2020. PMID: 32521508 Free PMC article.
References
-
- Bennett ML, Bennett FC, Liddelow SA, Ajami B, Zamanian JL, Fernhoff NB, Mulinyawe SB, Bohlen CJ, Adil A, Tucker A, Weissman IL, Chang EF, Li G, Grant GA, Hayden Gephart MG, Barres BA (2016) New tools for studying microglia in the mouse and human CNS. Proc Natl Acad Sci U S A 113:E1738–1746. 10.1073/pnas.1525528113 - DOI - PMC - PubMed
Publication types
MeSH terms
Substances
LinkOut - more resources
Full Text Sources
Other Literature Sources