. 2020 Jan 24;295(4):926-939.
doi: 10.1074/jbc.RA119.010472. Epub 2019 Dec 9.

Antibody validation for Western blot: By the user, for the user

Affiliations

Antibody validation for Western blot: By the user, for the user

Lakshmi Pillai-Kastoori et al. J Biol Chem. .

Abstract

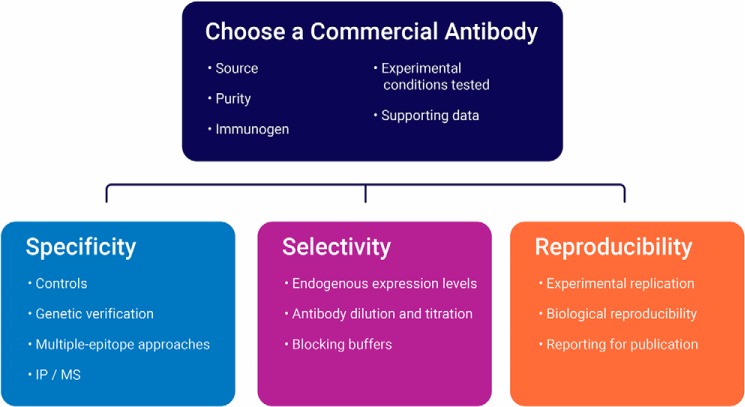
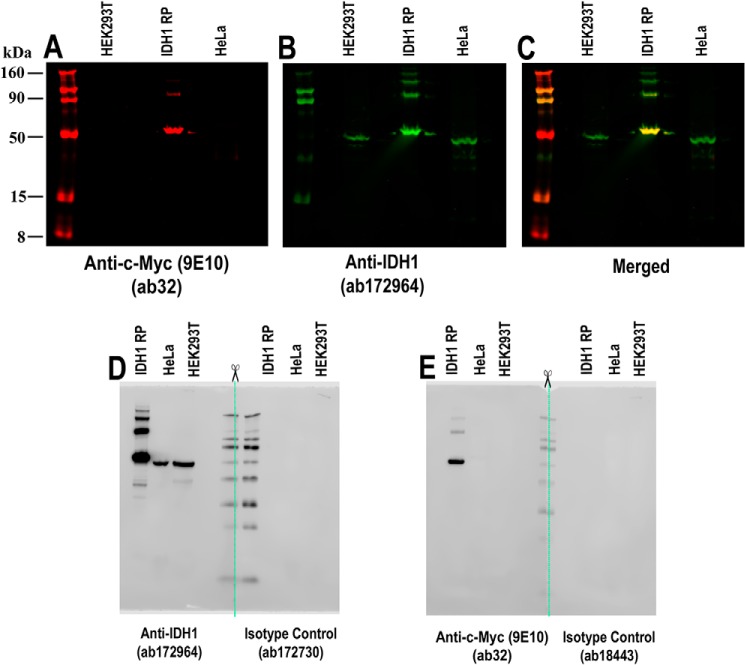
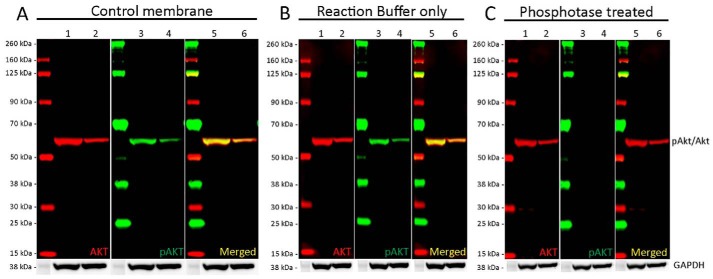
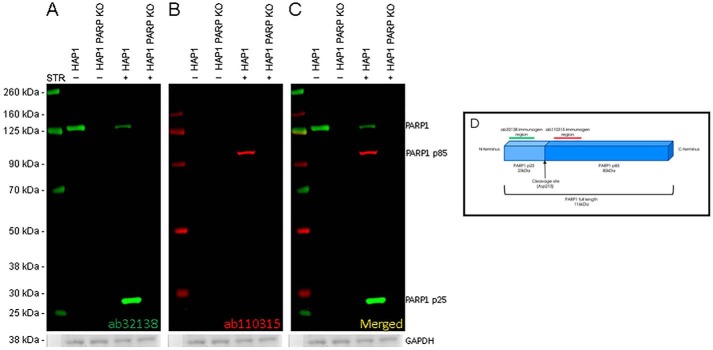
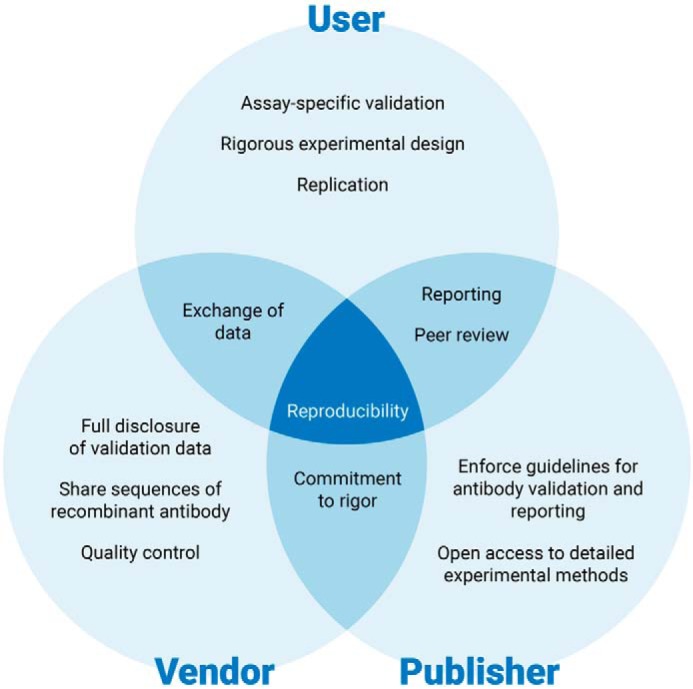
Well-characterized antibody reagents play a key role in the reproducibility of research findings, and inconsistent antibody performance leads to variability in Western blotting and other immunoassays. The current lack of clear, accepted standards for antibody validation and reporting of experimental details contributes to this problem. Because the performance of primary antibodies is strongly influenced by assay context, recommendations for validation and usage are unique to each type of immunoassay. Practical strategies are proposed for the validation of primary antibody specificity, selectivity, and reproducibility using Western blot analysis. The antibody should produce reproducible results within and between Western blotting experiments and the observed effect confirmed with a complementary or orthogonal method. Routine implementation of standardized antibody validation and reporting in immunoassays such as Western blotting may promote improved reproducibility across the global life sciences community.

Keywords: Immunoblot; Methodology; antibody; antibody validation; antigen; immunochemistry; irreproducibility crisis; protein domain; reproducibility; western blot.


Conflict of interest statement

L. P.-K., S. D. S., and A. S.-G. are employees of LI-COR Biosciences, and S. H., A. R., and A. S. are employees of Abcam Plc

Figures

Figure 1.
Figure 1.
Key elements of antibody validation.
Figure 2.
Figure 2.
Effect of blocking buffer on selectivity of an anti-cofilin primary antibody. Cofilin (∼19 kDa) was detected on blots blocked with 5% BSA, 5% nonfat dry milk, or Odyssey blocking buffer. Blots were visualized with IRDye 800CW secondary antibody and laser-based digital imaging. All blots were processed identically and imaged together, with blocking buffer as the only variation. Tissue lysates are as follows: lane 1, mouse brain; lane 2, rat brain; lane 3, mouse liver; lane 4, rat liver; lane 5, mouse thymus; and lane 6, rat thymus. Arrow indicates the expected position of the 19-kDa cofilin band. Choice of blocking buffer greatly impacted the off-target binding of this antibody. For all primary antibodies tested in this study, BSA consistently produced more nonspecific bands than the other blocking buffers. Reprinted with permission from Ambroz et al. (62).
Figure 3.
Figure 3.
Multiple epitope approach to detect β-catenin in cell lysates and to identify potential off-target antibody binding. 20 μg of HAP1, A431, and HeLa lysates were loaded into a 4–12% BisTris gel and run under the MOPS buffer system. The membrane was blocked for 1 h using Odyssey blocking buffer (TBS) before incubation with mouse anti-β-catenin antibody (ab231305) (A) and rabbit anti-β-catenin antibody (ab35272) (B) and at a 1 μg/ml concentration and 1:5000 dilution (0.0000126 μg/ml), respectively. Antibody binding was detected using goat anti-rabbit IgG H&L (IRDye® 800CW) preadsorbed and goat anti-mouse IgG H&L (IRDye® 680RD) preadsorbed secondary antibodies at 1:20,000 dilution for 1 h at room temperature. A, ab231305, binding to the C terminus and visualized in the 700-nm channel (red), displays a strong band at 95 kDa. However, there are several bands at a lower molecular weight present in all lysates. B, ab32572, binding the N terminus of β-catenin and visualized in the 800-nm channel (green), displays a single band at 95 kDa with an additional faint band at 90 kDa in A431 lysate only. C, when both 800- and 700-nm channels are displayed, both ab32572 and ab231305 show a band at 95 kDa, identifying the full-length β-catenin protein. The additional bands seen for ab231305 are not clearly shown to overlay with ab32572. This could represent off-target binding or isoforms lacking the N-terminal binding domain for ab32572. Membranes were visualized using the Odyssey CLx imager with auto-intensity and 84-μm resolution. The membrane was then probed with an anti-GAPDH rabbit antibody conjugated to HRP (ab9385). Staining was developed using a GBOX XT-16 chemiluminescent imager with a 20-min exposure.
Figure 4.
Figure 4.
Anti-MRP1 antibodies were tested against HAP1 WT and HAP1 ABCC1 KO samples in SDS-PAGE. 20 μg of HAP1 (WT) and HAP1 MRP1 (ABCC1) KO were loaded into single 3–8% Tris-acetate gels and run under the Tris-acetate buffer system. The protein gel was transferred onto a single nitrocellulose membrane. Membrane was blocked in 3% milk (TBS + 0.1% Tween) solution before being spliced into two individual strips (A and B). A, membrane was incubated with mouse anti-MRP1 antibody (ab24102) and rabbit anti-α-tubulin antibody (ab52866) at a 1:20 dilution and 1:20,000 dilution, respectively. Antibody binding was detected using goat anti-mouse IgG H&L (IRDye® 800CW) preadsorbed and goat anti-rabbit IgG H&L (IRDye® 680RD) preadsorbed secondary antibodies at 1:20,000 dilution. ab24102 clearly displays a single band at 170 kDa in the 800-nm channel (green) that shows reduced signal in the HAP1 MRP-1 (ABCC1) knockout lysate. This confirms that ab24102 identifies MRP-1 as well as other off-target proteins. ab52866 staining α-tubulin at 50 kDa in the 680-nm channel (red) confirms equal protein loading across all lanes. B, membrane was incubated with anti-MRP1 rabbit antibody (ab233383) and mouse anti-vinculin antibody (ab130007) at a 1:1000 dilution and 1:20,000 dilution, respectively. Antibody binding was detected using goat anti-rabbit IgG H&L (IRDye® 800CW) preadsorbed and goat anti-mouse IgG H&L (IRDye® 680RD) preadsorbed secondary antibodies at 1:20,000 dilution. ab233383 displays the expected glycosylated smear for MRP1 between 150 and 200 kDa in the 800-nm channel (green) that is absent in the HAP1 MRP1 (ABCC1) KO lysate. This demonstrates that in HAP1 cells ab233383 reacts only with MRP1 (ABCC1). Ab130007 staining of vinculin at 125 kDa in the 700-nm channel (red) confirms equal protein loading across all lysates. Membranes were visualized using the Odyssey CLx imager with auto-intensity and 169-μm resolution. Separate images were required to visualize HiMarkTM pre-stained protein standard. White dotted line and scissor symbol denote splicing.
Figure 5.
Figure 5.
Validation of IDH1 antibody using purified recombinant protein in multicolor and chemiluminescent Western blotting. Multicolor and chemiluminescent Western blottings were performed using 10% Bis-Tris SDS-polyacrylamide gel and MOPS buffer system to validate the IDH1 antibody using a purified recombinant IDH1 protein (0.16 μg) containing a c-Myc tag in addition to HEK293T and HeLa whole-cell lysates. A, c-Myc protein tag present on the purified IDH1 recombinant protein is detected in the 700-nm channel (red) at 50 kDa via mouse anti-c-Myc antibody (ab32;1 μg/ml) using IRDye 680RD goat anti-mouse IgG (H + L) for detection. Some overspill of the recombinant protein into neighboring lanes is observed (white box). B, IDH1 recombinant protein and endogenous IDH1 protein, present in HEK293T and HeLa, is detected in the 800-nm channel (green) at 55 and 50 kDa, respectively, using rabbit anti-IDH1 antibody (ab172964; 1.2 μg/ml) and IRDye 800CW goat anti-mouse IgG (H + L) for detection. C, when both 700- and 800-nm channels are displayed, the signal from ab32 and ab172964 overlaps at 50 kDa, identifying the c-Myc–tagged IDH1 protein. No overlap is seen for the endogenous IDH1 present in HEK293T and HeLa whole-cell lysates. A–C, lysates loaded per lane are as follows: 20 μg of blocking buffer: Odyssey blocking buffer (TBS); imager: Odyssey® CLx; resolution: 169 μm; intensity: auto mode. ChameleonTM Duo pre-stained protein ladder for accurate sizing of protein bands. D, single blot was split into two halves (green line) to be incubated with either rabbit anti-IDH1 antibody (ab172964; 0.115 μg/ml) or the corresponding rabbit monoclonal IgG isotype control (ab172730; 0.166 μg/ml) to detect the endogenous IDH1 protein present in HeLa and HEK293T as well IDH1 recombinant protein. Both halves were incubated with HRP-conjugated goat anti-mouse IgG (H + L). E, single blot was split into two halves (green line) to be incubated with either mouse anti-c-Myc antibody (ab32; 1 μg/ml) or the corresponding mouse monoclonal IgG1 isotype control (ab18443; 1 μg/ml) to detect c-Myc protein tag present on the purified IDH1 recombinant protein but absent in HEK293T and HeLa whole-cell lysates. Both halves were incubated with HRP-conjugated goat anti-rabbit IgG (H + L). Blots were detected with WesternSure® PREMIUM chemiluminescent substrate (LI-COR 926–95000) and imaged on an Odyssey® Fc with the following resolution: 125 μm and exposure of 2 min. Lysate loaded per lane: 20 μg; protein ladder: WesternSure® pre-stained chemiluminescent protein ladder (LI-COR 926-980000); blocking buffer: intercept blocking buffer (TBS); intercept T20 (TBS) antibody diluent.
Figure 6.
Figure 6.
Analysis of phosphorylation specificity using multiplexed Western blotting and alkaline phosphatase membrane treatment. 20 μg of LNCaP (lanes 1, 3, and 5) and Jurkat (lanes 2, 4, and 6) whole-cell lysates were loaded into a 4–12% Bis-Tris gel and run under the MOPS buffer system. Following transfer, membranes were cut and separated for alkaline phosphatase treatment. Membranes were blocked for an hour using Odyssey Blocking Buffer (TBS) before incubation with rabbit anti-AKT1 (serine 473) antibody (ab81283) and mouse anti-AKT1 (ab108202) antibody at a 1:2000 dilution (9.7 μg/ml) and 1:500 dilution (1.67 μg/ml), respectively. Antibody binding was detected using goat anti-rabbit IgG H&L (IRDye® 800CW) preadsorbed and goat anti-mouse IgG H&L (IRDye® 680RD) preadsorbed secondary antibodies at 1:20,000 dilution. A, in the untreated control membrane, ab108202 (red) clearly recognizes a single band at 60 kDa in both lysates that corresponds with the molecular weight of AKT1. ab81283 (green) also detects a single band at 60 kDa in both lysates corresponding the phosphorylated form of AKT1. Both bands clearly overlap when the channels are merged. B, membranes treated with the alkaline phosphate reaction buffer displayed identical banding to the control membranes for both AKT1 (ab108202, red) and for pAKT1 (ab81283, green). C. ab108202 (red) displays the expected band at 60 kDa for AKT1. No signal is seen for ab81283 (green). Membranes were visualized using the Odyssey CLx imager with auto-intensity and 84 μm resolution. Membranes were then probed with an anti-GAPDH rabbit antibody conjugated to HRP (ab9385). Staining was developed for 20 min using a GBOX XT-16 chemiluminescent imager.
Figure 7.
Figure 7.
Analysis of PARP1 cleavage by Western blotting. HAP1 WT and HAP1 PARP1 KO cells with (+) and without (−) staurosporine (STR) treatment were lysed, and 20 μg of total protein was loaded into a 4–12% Bis-Tris gel and run under the MOPS buffer system. The membrane was blocked for an hour using Odyssey blocking buffer (TBS) before incubation with rabbit anti-PARP1 antibody (ab32138) and mouse anti-cleaved PARP1 ab110315 at a 1:1000 dilution (9.7 μg/ml) and 1 μg/ml concentration, respectively. Antibody binding was detected using goat anti-rabbit IgG H&L (IRDye® 800CW) preadsorbed and goat anti-mouse IgG H&L (IRDye® 680RD) preadsorbed secondary antibodies at 1:20,000 dilution. A, full-length PARP1 was identified at 130 kDa by ab32138 (green) in HAP1 WT untreated lysates. Following treatment with staurosporine and cleavage of PARP1 in HAP1 WT cells, ab32138 detects a significantly weaker full-length PARP1 signal at 130 kDa alongside a new, stronger band at 28 kDa that represents the N-terminal cleavage product. No banding at either molecular weight is seen in treated or control HAP1 PARP1 knockout lysates. B, following treatment with staurosporine and cleavage of PARP1 in HAP1 WT cells, ab110315 (red) identifies the C-terminal cleavage product of PARP1 at 100 kDa. No banding is seen in the untreated WT control or in HAP1 PARP1 knockout lysates. C, overlay of both 800 and 70 nm displays clear identification of full-length PARP1 and cleavage products in staurosporine-treated HAP1 cells. Membranes were visualized using the Odyssey CLx imager with auto-intensity and 84-μm resolution. The membrane was then probed with an anti-GAPDH rabbit antibody conjugated to HRP (ab9385). Staining was developed for 20 min using GBOX XT-16 chemiluminescent imager. D, illustration of full-length PARP1 protein and associated cleavage products. Immunogen domains of ab32138 (green) and ab110315 (red) are displayed with the corresponding imaging channel color.
Figure 8.
Figure 8.
Collaboration and cooperation are required to address the antibody reproducibility problem. Reproducibility requires the combined efforts of the user, vendor, and publisher. Users should perform assay-specific validation of antibody performance and conduct well-designed experiments. Validation results, whether good or bad, can be openly shared and detailed methods reported when the scientific findings are published. The vendor's role is to provide high-quality, well-characterized antibodies with detailed disclosure of methods and results. The publisher can formulate and enforce guidelines for antibody validation and data reporting, providing access to detailed methods and other supporting information. Researchers must work together to standardize the way research antibodies are validated, used, and reported.

References

    1. Nature. (2016) Reality check on reproducibility. Nature 533, 437 10.1038/533437a - DOI - PubMed
    1. Baker M. (2016) 1,500 scientists lift the lid on reproducibility. Nature 533, 452–454 10.1038/533452a - DOI - PubMed
    1. Lithgow G. J., Driscoll M., and Phillips P. (2017) A long journey to reproducible results. Nature 548, 387–388 10.1038/548387a - DOI - PMC - PubMed
    1. Global Biological Standards Institute (2013) The case for standards in life science research. GBSI, Washington, D. C.
    1. Uhlen M., Bandrowski A., Carr S., Edwards A., Ellenberg J., Lundberg E., Rimm D. L., Rodriguez H., Hiltke T., Snyder M., and Yamamoto T. (2016) A proposal for validation of antibodies. Nat Methods 13, 823–827 10.1038/nmeth.3995 - DOI - PMC - PubMed

LinkOut - more resources