. 2020 Jan 17;295(3):868-882.
doi: 10.1074/jbc.RA119.010340. Epub 2019 Dec 9.

PASylation of IL-1 receptor antagonist (IL-1Ra) retains IL-1 blockade and extends its duration in mouse urate crystal-induced peritonitis

Affiliations

PASylation of IL-1 receptor antagonist (IL-1Ra) retains IL-1 blockade and extends its duration in mouse urate crystal-induced peritonitis

Nicholas E Powers et al. J Biol Chem. .

Abstract

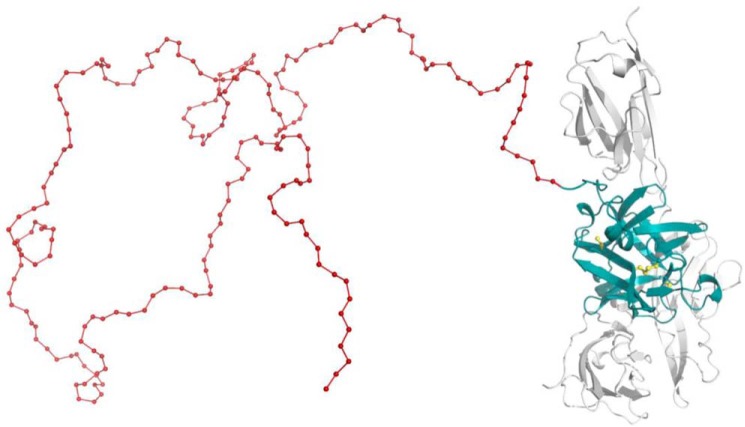
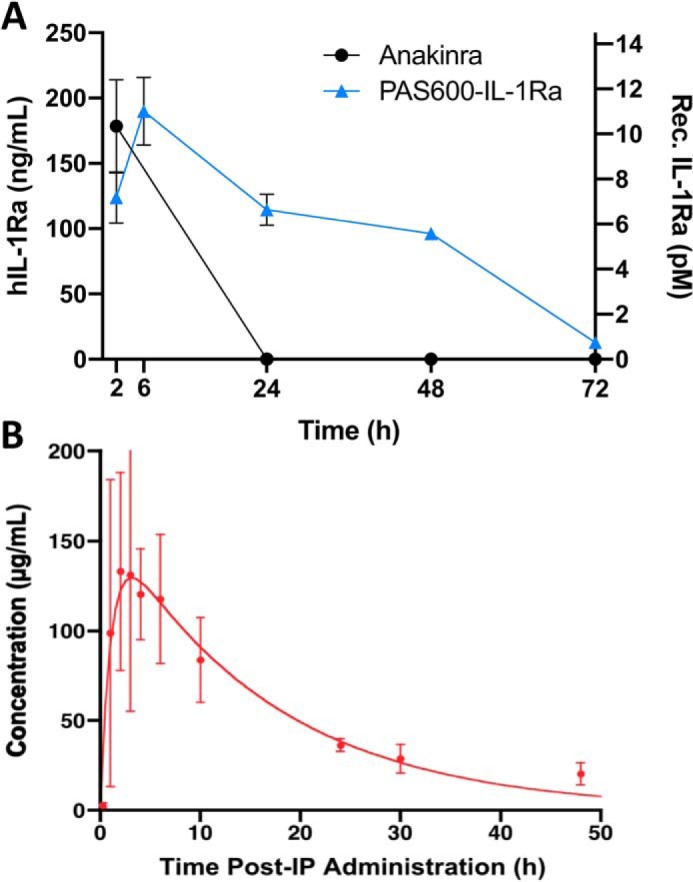
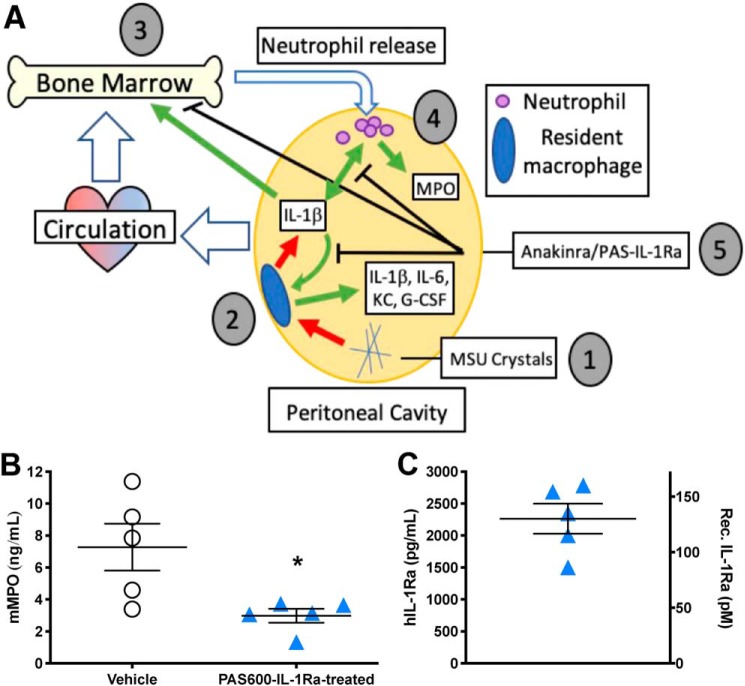
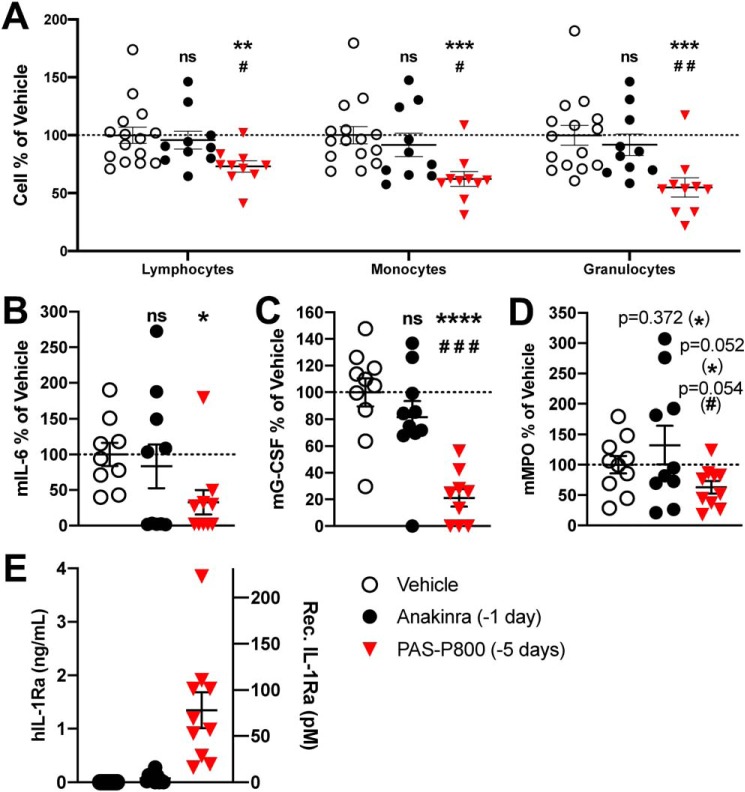
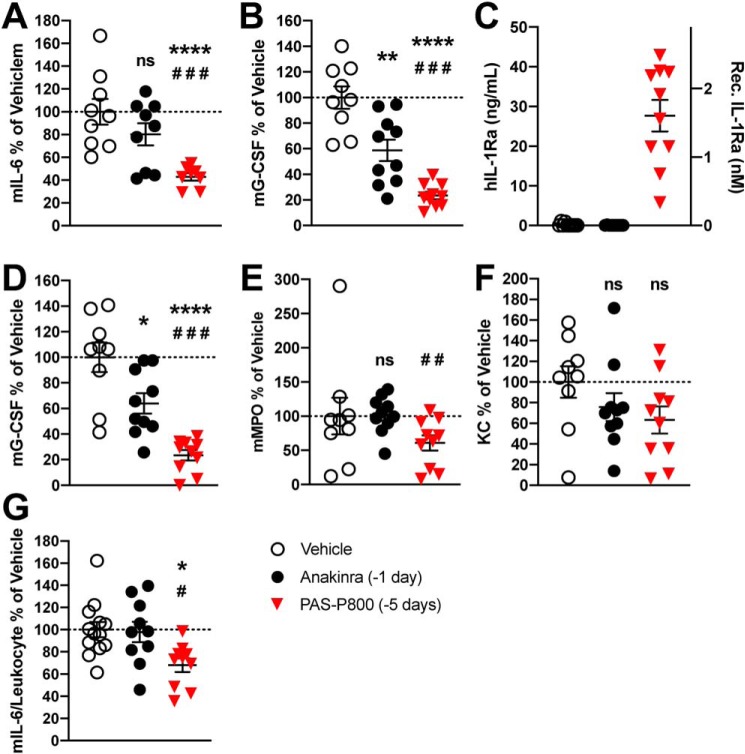
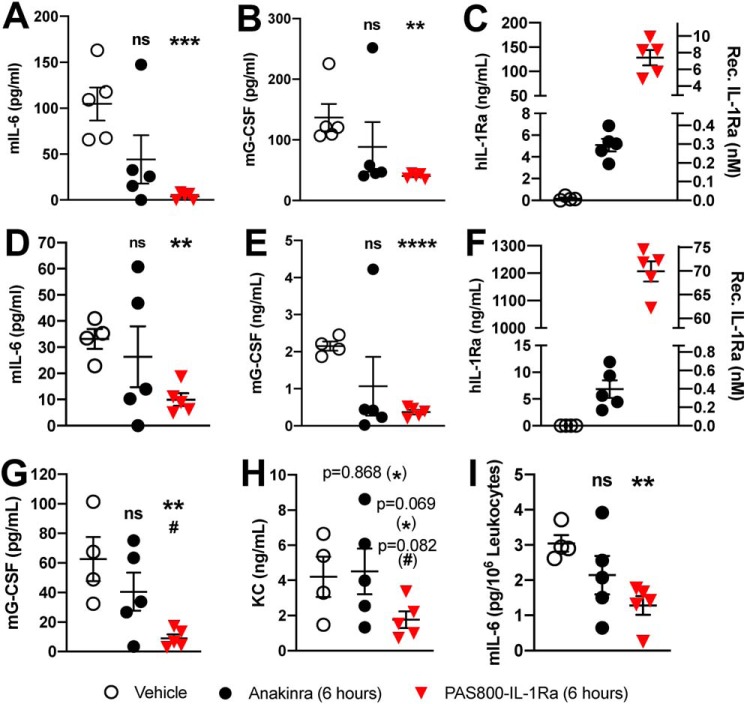
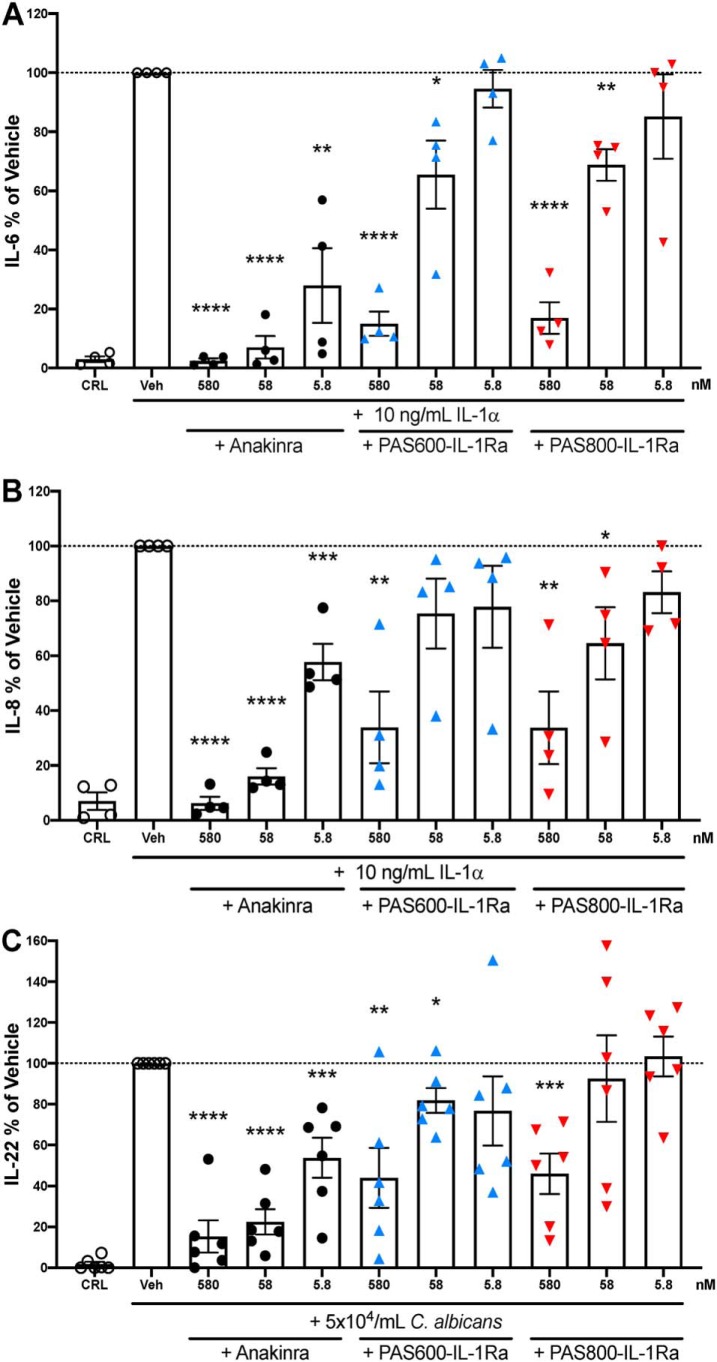
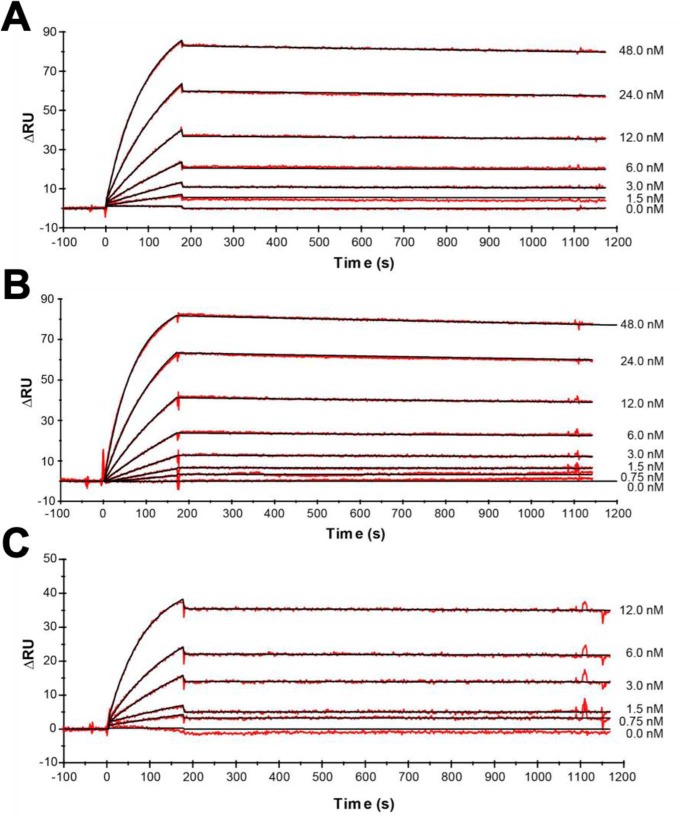
Interleukin-1 (IL-1) is a key mediator of inflammation and immunity. Naturally-occurring IL-1 receptor antagonist (IL-1Ra) binds and blocks the IL-1 receptor-1 (IL-1R1), preventing signaling. Anakinra, a recombinant form of IL-1Ra, is used to treat a spectrum of inflammatory diseases. However, anakinra is rapidly cleared from the body and requires daily administration. To create a longer-lasting alternative, PASylated IL-1Ra (PAS-IL-1Ra) has been generated by in-frame fusion of a long, defined-length, N-terminal Pro/Ala/Ser (PAS) random-coil polypeptide with IL-1Ra. Here, we compared the efficacy of two PAS-IL-1Ra molecules, PAS600-IL-1Ra and PAS800-IL-1Ra (carrying 600 and 800 PAS residues, respectively), with that of anakinra in mice. PAS600-IL-1Ra displayed markedly extended blood plasma levels 3 days post-administration, whereas anakinra was undetectable after 24 h. We also studied PAS600-IL-1Ra and PAS800-IL-1Ra for efficacy in monosodium urate (MSU) crystal-induced peritonitis. 5 days post-administration, PAS800-IL-1Ra significantly reduced leukocyte influx and inflammatory markers in MSU-induced peritonitis, whereas equimolar anakinra administered 24 h before MSU challenge was ineffective. The 6-h pretreatment with equimolar anakinra or PAS800-IL-1Ra before MSU challenge similarly reduced inflammatory markers. In cultured A549 lung carcinoma cells, anakinra, PAS600-IL-1Ra, and PAS800-IL-Ra reduced IL-1α-induced IL-6 and IL-8 levels with comparable potency. In human peripheral blood mononuclear cells, these molecules suppressed Candida albicans-induced production of the cancer-promoting cytokine IL-22. Surface plasmon resonance analyses revealed significant binding between PAS-IL-1Ra and IL-1R1, although with a slightly lower affinity than anakinra. These results validate PAS-IL-1Ra as an active IL-1 antagonist with marked in vivo potency and a significantly extended half-life compared with anakinra.

Keywords: IL-22; PASylation; biotechnology; drug delivery; half-life extension; inflammation; innate immunity; interleukin 1 (IL-1); intrinsically-disordered protein; leukocyte; pharmacokinetics.


Conflict of interest statement

C. K. E., III, and R. D. are shareholders in DNX Biopharmaceuticals, Inc., and A. S., M. S., and U. B. are shareholders of XL-protein GmbH

Figures

Figure 1.
Figure 1.
Three-dimensional structure of PASylated IL-1Ra. Molecular model of IL-1Ra (teal) with an N-terminal PAS extension (here, 200 residues, red) in arbitrary random conformation. Association with the extracellular domain of IL-1R1 (gray) is indicated (based on the crystal structure of the complex, PDB code 1IRA (67)). The four Cys side chains of IL-1Ra are highlighted (yellow); two of them are engaged in a structural disulfide bridge.
Figure 2.
Figure 2.
PAS600–IL-1Ra exhibits an extended plasma half-life. A, plasma levels of IL-1Ra in mice administered subcutaneously with 10 mg/kg (579.5 nmol/kg) anakinra or 10 mg/kg (147.1 nmol/kg) PAS600–IL-1Ra. n = 3. B, blood plasma concentrations of PAS600–IL-1Ra after i.p. administration in mice displayed pharmacokinetics according to the Bateman function, revealing fast biodistribution and a terminal elimination half-life τβ1/2 = 11.3 ± 2.3 h. For comparison, a τβ1/2 value of 2 min was reported for unmodified IL-1Ra (25). Data are presented as mean ± S.D.
Figure 3.
Figure 3.
PAS600–IL-1Ra reduces MSU-crystal peritoneal inflammation. A, graphical abstract of experimental MSU-induced peritonitis. 1) MSU crystals stimulate the release of inflammatory cytokines from 2) resident peritoneal macrophages, including IL-1β, IL-6, KC, and G-CSF. 3) Secreted cytokines entering the circulation stimulate neutrophil release from the bone marrow, which enters the bloodstream and reaches the peritoneal cavity. 4) The inflammatory milieu in the peritoneal cavity stimulates further cytokine and MPO release from infiltrating neutrophils. 5) Anakinra or PAS–IL-1Ra pretreatment inhibits IL-1 signaling in resident macrophages, the bone marrow, and infiltrating neutrophils, reducing the host inflammatory response. B, mean i.p. fluid MPO 6 h after MSU crystal challenge. C, mean i.p. fluid human IL-1Ra (in pg/ml or pm, see under “Experimental procedures”) in PAS600–IL-1Ra–treated mice 6 h after MSU challenge. B and C, n = 5, one point represents one mouse. Data presented as mean ± S.E.; *, p < 0.05 (two-tailed Student's t test).
Figure 4.
Figure 4.
Comparison of 5-day PAS800–IL-1Ra and 1-day anakinra pretreatment efficacy in MSU-crystal–induced peritonitis. A, peritoneal leukocyte populations were assessed in i.p. fluid by automated cell counter (vehicle ranges: lymphocytes, 0.83–2.24 × 10⁶/ml; monocytes, 0.44–0.84 × 10⁶/ml; granulocytes, 1.08–2.02 × 10⁶/ml). Mouse IL-6 (B) (vehicle range 138–8620 pg/ml), mouse G-CSF (C) (vehicle range 111–559 pg/ml), mouse MPO (D) (vehicle range 2.42–39.80 ng/ml), and human IL-1Ra (E) in the i.p. fluid 4 h after i.p. instillation of MSU (120 mg/kg) are shown. B–D, data are expressed as percent change from the vehicle group mean of each experiment, with the vehicle group mean set at 100%. Then, cytokine levels or cell counts from each mouse were expressed as percentage of the vehicle mean. Experiments 1 (5 mice) and 2 (5 mice) were then combined; one point represents one mouse. Data presented as mean ± S.E.; ns, not significant; *, p < 0.05; **, p < 0.01; ***, p < 0.001; and ****, p < 0.0001 (vehicle/PAS800–IL-1Ra comparison); #, p < 0.05; ##, p < 0.01; and ###, p < 0.001 (anakinra/PAS800–IL-1Ra comparison) (two-tailed Student's t test).
Figure 5.
Figure 5.
Comparison of 5-day PAS800–IL-1Ra and 1-day anakinra pretreatment in systemic inflammation in MSU-peritonitis. A–C, plasma levels of mouse IL-6 (A), vehicle range 149–2920 pg/ml, mouse G-CSF (B), vehicle range 3.71–15.30 ng/ml, and human IL-1Ra (C). D–F, remaining blood pellet was lysed in 0.5% Triton X-100 following centrifugation and assayed for mouse G-CSF (D), mouse MPO (E) (2.92–333.47 ng/ml), and KC (F) (551–11578 pg/ml). Whole blood, diluted 1 part in 5, was cultured for 24 h. Supernatants were assayed for mouse IL-6 (G). Absolute IL-6 (vehicle range 17.5–37.0 pg/ml) was normalized per million of circulating leukocytes (see “Results”). Data are expressed as percent change from the vehicle group mean of each experiment, with the vehicle group mean set at 100%. Experiments 1 (5 mice) and 2 (5 mice) were then combined, and one point represents one mouse. Data are presented as mean ± S.E.; ns, not significant; *, p < 0.05; **, p < 0.01; ***, p < 0.001; and ****, p < 0.0001 (control/PAS800–IL-1Ra comparison); #, p < 0.05; ##, p < 0.01; and ###, p < 0.001 (anakinra/PAS800–IL-1Ra comparison) (two-tailed Student's t test).
Figure 6.
Figure 6.
6-h pretreatment with PAS800–IL-1Ra and anakinra reduce inflammation in MSU-crystal–induced peritonitis. A–C, i.p. fluid concentrations of mouse IL-6 (A), mouse G-CSF (B), and human IL-1Ra (C) 4 h after i.p. MSU crystal instillation, as in Fig. 5. D–F, plasma concentrations of mouse IL-6 (D), mouse G-CSF (E), and human IL-1Ra (F) from the same experiment. G and H, remaining blood pellet was lysed with 0.5% Triton X-100, as in Fig. 5, and assayed for mouse G-CSF (G) and KC (H). Whole blood, diluted 1 part in 5, was cultured for 24 h and then the supernatant was assayed for mouse IL-6 (I), as in Fig. 5. Data are presented as mean ± S.E.; ns, not significant;*, p < 0.05; **, p < 0.01; ***, p < 0.001; and ****, p < 0.0001 (Control/PAS800–IL-1Ra comparison); #, p < 0.05 (Anakinra/PAS800–IL-1Ra comparison) (two-tailed Student's t test).
Figure 7.
Figure 7.
Comparison between anakinra and PASylated IL-1Ra in A549 cells and human PBMC. A and B, A549 cells were stimulated for 24 h with recombinant human IL-1α. Experimental n = 4, vehicle IL-6 range 2.03–12.62 ng/ml (A) and vehicle IL-8 range 13.2–36.3 ng/ml (B). C, PBMC from six healthy donors, stimulated 5 days with heat-killed C. albicans. Vehicle IL-22 range 64.6–6290 pg/ml. A–C, equimolar anakinra, PAS600–IL-1Ra and PAS800–IL-1Ra treatments of 5.8–580 nm are indicated below bar graphs. These values were calculated from MS values (Fig. S2). Data are expressed as % change from the vehicle group, with the mean of the vehicle group triplicate set at 100%. One point represents one averaged triplicate (one experimental group). Data are presented as mean ± S.E.; *, p < 0.05; **, p < 0.01; ***, p < 0.001; and ****, p < 0.0001 (two-tailed Student's t test).
Figure 8.
Figure 8.
In vitro binding of PASylated IL-1Ra and anakinra. Real-time kinetic SPR analysis on a BIAcore 2000 instrument of PAS800–IL-1Ra (A), PAS600–IL-1Ra (B), and anakinra versus IL-1R1 (as Fc chimera) (C) immobilized on a CM3 sensorchip (ΔRU = 180). The signals for various ligand concentrations are depicted as red lines with curve fits according to a 1:1 Langmuir model shown in black. The resulting kinetic and affinity parameters are listed in Table 1.

References

    1. Mantovani A., Barajon I., and Garlanda C. (2018) IL-1 and IL-1 regulatory pathways in cancer progression and therapy. Immunol. Rev. 281, 57–61 10.1111/imr.12614 - DOI - PMC - PubMed
    1. Mantovani A., Dinarello C. A., Molgora M., and Garlanda C. (2019) Interleukin-1 and related cytokines in the regulation of inflammation and immunity. Immunity 50, 778–795 10.1016/j.immuni.2019.03.012 - DOI - PMC - PubMed
    1. Rider P., Carmi Y., Guttman O., Braiman A., Cohen I., Voronov E., White M. R., Dinarello C. A., and Apte R. N. (2011) IL-1α and IL-1β recruit different myeloid cells and promote different stages of sterile inflammation. J. Immunol. 187, 4835–4843 10.4049/jimmunol.1102048 - DOI - PubMed
    1. Van Opdenbosch N., and Lamkanfi M. (2019) Caspases in cell death, inflammation, and disease. Immunity 50, 1352–1364 10.1016/j.immuni.2019.05.020 - DOI - PMC - PubMed
    1. Sobowale O. A., Parry-Jones A. R., Smith C. J., Tyrrell P. J., Rothwell N. J., and Allan S. M. (2016) Interleukin-1 in stroke: from bench to bedside. Stroke 47, 2160–2167 10.1161/STROKEAHA.115.010001 - DOI - PubMed

Publication types

Associated data

LinkOut - more resources