

Tuning friction and slip at solid-nanoparticle suspension interfaces by electric fields
- PMID: 31819076
- PMCID: PMC6901442
- DOI: 10.1038/s41598-019-54515-1
Tuning friction and slip at solid-nanoparticle suspension interfaces by electric fields
Abstract
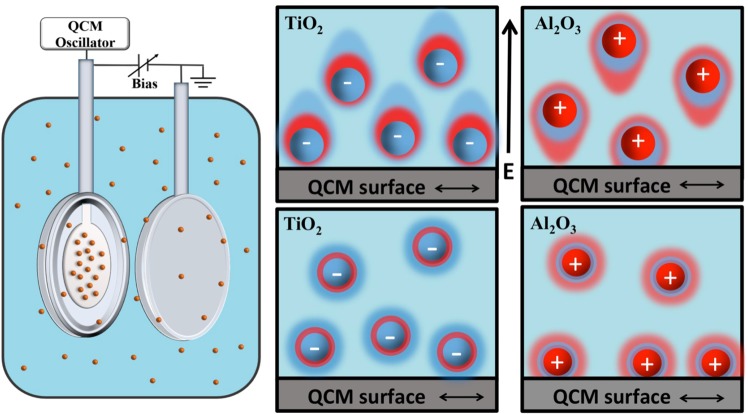
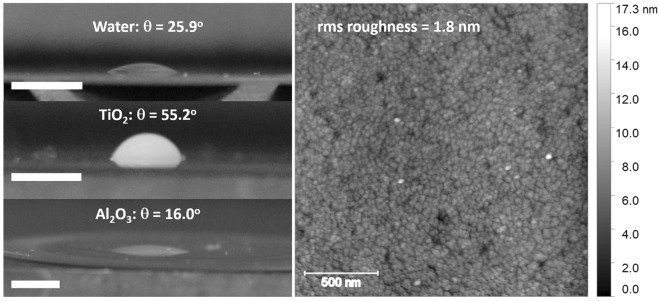
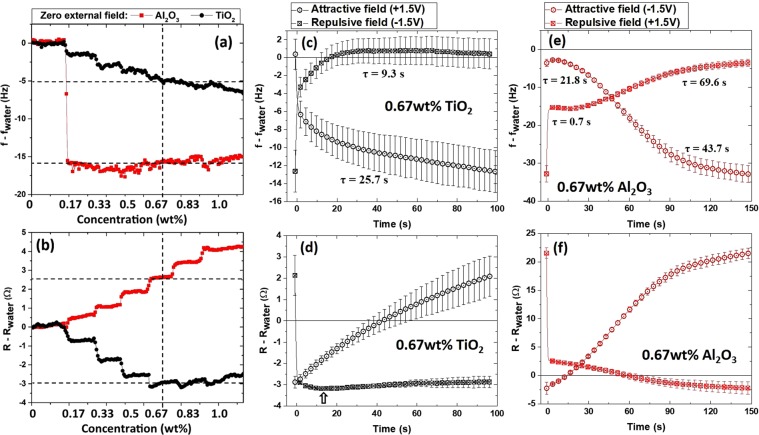
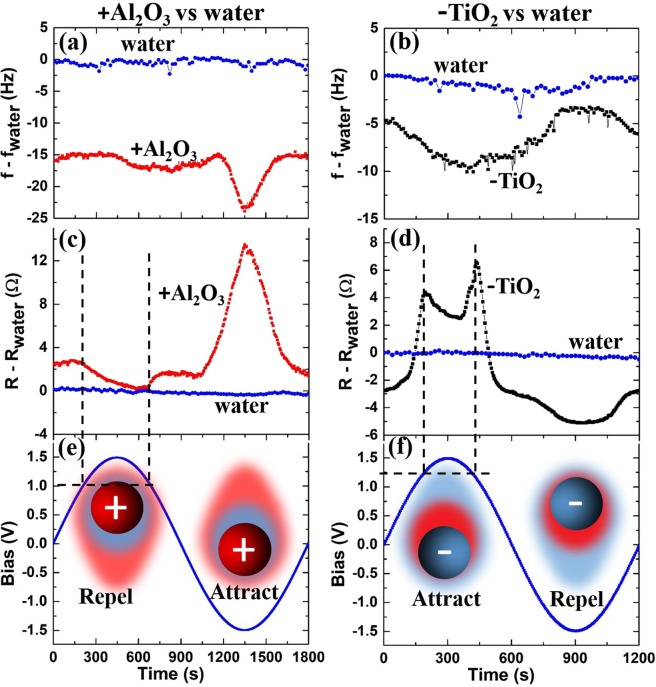
We report an experimental Quartz Crystal Microbalance (QCM) study of tuning interfacial friction and slip lengths for aqueous suspensions of TiO2 and Al2O3 nanoparticles on planar platinum surfaces by external electric fields. Data were analyzed within theoretical frameworks that incorporate slippage at the QCM surface electrode or alternatively at the surface of adsorbed particles, yielding values for the slip lengths between 0 and 30 nm. Measurements were performed for negatively charged TiO2 and positively charged Al2O3 nanoparticles in both the absence and presence of external electric fields. Without the field the slip lengths inferred for the TiO2 suspensions were higher than those for the Al2O3 suspensions, a result that was consistent with contact angle measurements also performed on the samples. Attraction and retraction of particles perpendicular to the surface by means of an externally applied field resulted in increased and decreased interfacial friction levels and slip lengths. The variation was observed to be non-monotonic, with a profile attributed to the physical properties of interstitial water layers present between the nanoparticles and the platinum substrate.
Conflict of interest statement
The authors declare no competing interests.
Figures

Similar articles
-
Tribotronic and electrochemical properties of platinum-nanofluid interfaces formed by aqueous suspensions of 5 and 40 nm TiO2 nanoparticles.J Chem Phys. 2023 Sep 21;159(11):114705. doi: 10.1063/5.0155504. J Chem Phys. 2023. PMID: 37724732
-
A comparative study of the nanoscale and macroscale tribological attributes of alumina and stainless steel surfaces immersed in aqueous suspensions of positively or negatively charged nanodiamonds.Beilstein J Nanotechnol. 2017 Sep 29;8:2045-2059. doi: 10.3762/bjnano.8.205. eCollection 2017. Beilstein J Nanotechnol. 2017. PMID: 29046852 Free PMC article.
-
The influence of water polarization on slip friction at charged interfaces.J Chem Phys. 2024 Nov 28;161(20):204705. doi: 10.1063/5.0232332. J Chem Phys. 2024. PMID: 39601283
-
The coupling of surface charge and boundary slip at the solid-liquid interface and their combined effect on fluid drag: A review.J Colloid Interface Sci. 2015 Sep 15;454:152-79. doi: 10.1016/j.jcis.2015.05.015. Epub 2015 May 15. J Colloid Interface Sci. 2015. PMID: 26021432 Review.
-
QCM-D study of nanoparticle interactions.Adv Colloid Interface Sci. 2016 Jul;233:94-114. doi: 10.1016/j.cis.2015.10.004. Epub 2015 Oct 14. Adv Colloid Interface Sci. 2016. PMID: 26546115 Review.
Cited by
-
Tuning friction force and reducing wear by applying alternating electric current in conductive AFM experiments.Nat Commun. 2025 May 20;16(1):4704. doi: 10.1038/s41467-025-59989-4. Nat Commun. 2025. PMID: 40394013 Free PMC article.
-
Dynamics of Neutral and Charged Nanodiamonds in Aqueous Media Confined between Gold Surfaces under Normal and Shear Loading.ACS Omega. 2020 Apr 27;5(18):10349-10358. doi: 10.1021/acsomega.0c00073. eCollection 2020 May 12. ACS Omega. 2020. PMID: 32426591 Free PMC article.
References
-
- Rogelj J, et al. Energy system transformations for limiting end-of-century warming to below 1.5 C. Nature Climate Change. 2015;5:519–527. doi: 10.1038/nclimate2572. - DOI
-
- Abergel, T. et al. Energy Technology Perspectives 2017: Catalysing Energy Technology Transformations. (IEA 2017).
-
- Holmberg K, Erdemir A. Influence of tribology on global energy consumption, costs and emissions. Friction. 2017;5:263–284. doi: 10.1007/s40544-017-0183-5. - DOI
LinkOut - more resources
Full Text Sources
