. 2019 Dec 9;9(1):18626.
doi: 10.1038/s41598-019-54781-z.

Imaging Salt Uptake Dynamics in Plants Using PET

Affiliations

Imaging Salt Uptake Dynamics in Plants Using PET

Gerard Ariño-Estrada et al. Sci Rep. .

Abstract

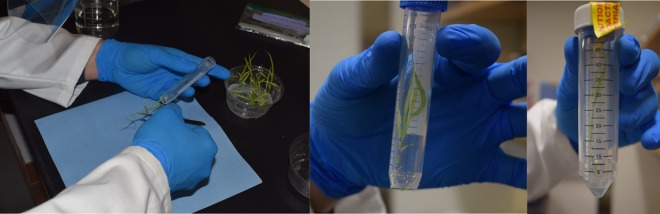
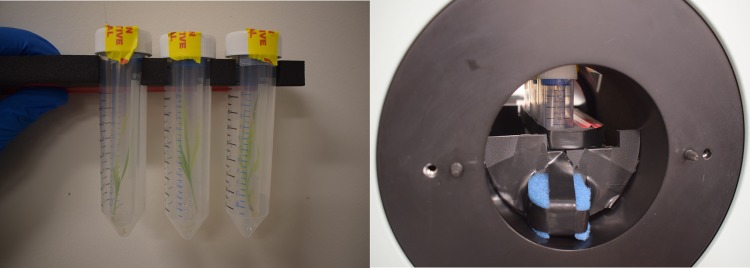
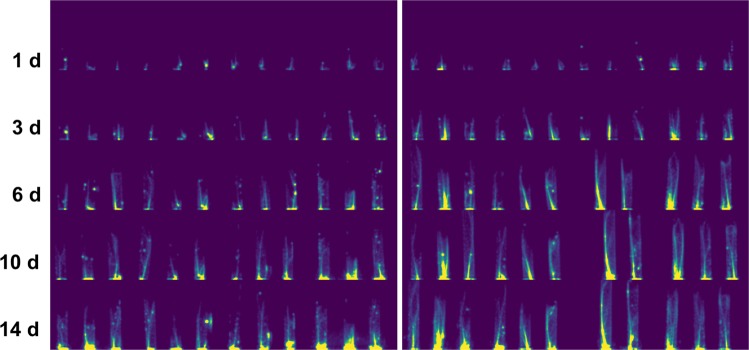
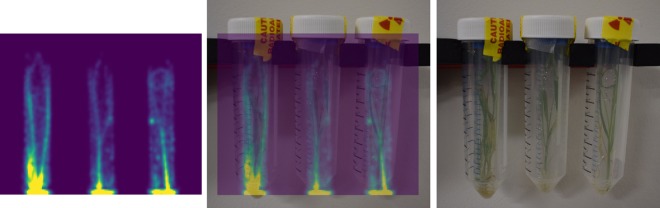
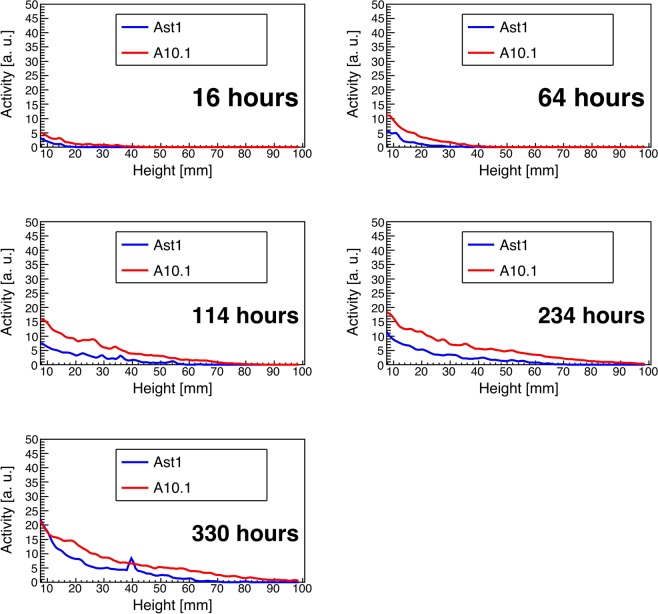
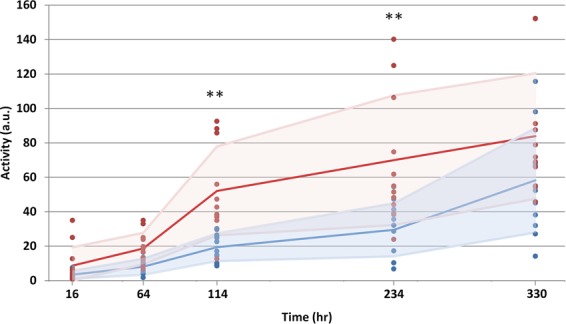
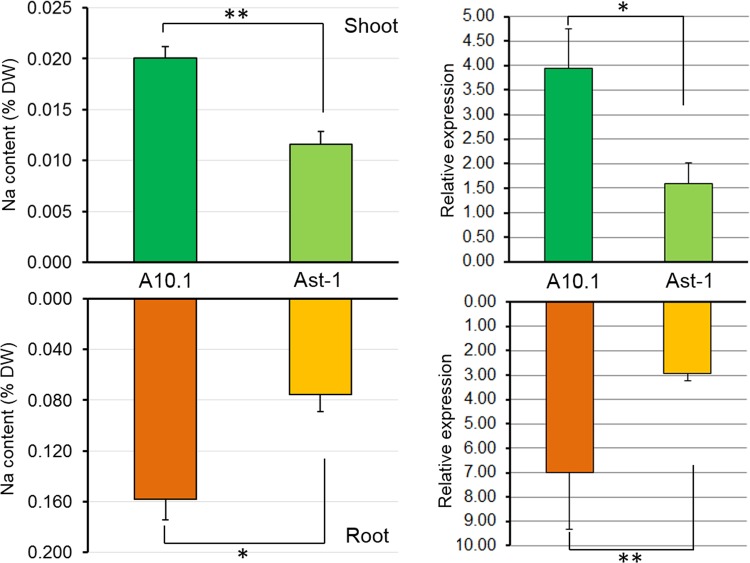
Soil salinity is a global environmental challenge for crop production. Understanding the uptake and transport properties of salt in plants is crucial to evaluate their potential for growth in high salinity soils and as a basis for engineering varieties with increased salt tolerance. Positron emission tomography (PET), traditionally used in medical and animal imaging applications for assessing and quantifying the dynamic bio-distribution of molecular species, has the potential to provide useful measurements of salt transport dynamics in an intact plant. Here we report on the feasibility of studying the dynamic transport of 22Na in millet using PET. Twenty-four green foxtail (Setaria viridis L. Beauv.) plants, 12 of each of two different accessions, were incubated in a growth solution containing 22Na+ ions and imaged at 5 time points over a 2-week period using a high-resolution small animal PET scanner. The reconstructed PET images showed clear evidence of sodium transport throughout the whole plant over time. Quantitative region-of-interest analysis of the PET data confirmed a strong correlation between total 22Na activity in the plants and time. Our results showed consistent salt transport dynamics within plants of the same variety and important differences between the accessions. These differences were corroborated by independent measurement of Na+ content and expression of the NHX transcript, a gene implicated in sodium transport. Our results demonstrate that PET can be used to quantitatively evaluate the transport of sodium in plants over time and, potentially, to discern differing salt-tolerance properties between plant varieties. In this paper, we also address the practical radiation safety aspects of working with 22Na in the context of plant imaging and describe a robust pipeline for handling and incubating plants. We conclude that PET is a promising and practical candidate technology to complement more traditional salt analysis methods and provide insights into systems-level salt transport mechanisms in intact plants.


Conflict of interest statement

The authors declare no competing interests.

Figures

Figure 1
Figure 1
Each plant was kept inside a 15 mL tube with the base removed (left and center). This tube was placed inside a larger (50 mL) tube containing the incubation solution (right).
Figure 2
Figure 2
(Left) Set of three plants reproducibly positioned in a foam holder for imaging. (Right) Set of three plants being imaged inside the small animal PET scanner.
Figure 3
Figure 3
Maximum intensity projection (MIP) PET images showing 22Na uptake in the Ast-1 (left panel) and A10.1 (right panel) accessions. Rows (top to bottom) correspond to the time after incubation, in days. Columns (left to right) correspond to plants 1 to 24 (12 in each accession). Note that plant 21 (from the A10.1 dataset) was removed from the study after the second time point and is therefore missing from rows 3, 4 and 5 in the right panel.
Figure 4
Figure 4
Co-registration of reconstructed PET images and physical plant structures in the shoot (sheath and leaf blades). This example shows a transverse slice through the center of three A10.1 plants imaged at t = 10 days (left), the same images overlaid with a registered photograph of the plants taken at the same time point (center), and the raw photograph (right).
Figure 5
Figure 5
22Na activity as a function of height along the stem. The red and blue curves correspond to the A10.1 and Ast1 accessions, respectively.
Figure 6
Figure 6
Dynamic sodium transport. The red and blue markers represent the A10.1 and Ast-1 accessions, respectively. Solid lines show the average trend for each accession. The shaded regions represent +/− 1 standard deviation. ** indicates high statistical significance (p < 0.01).
Figure 7
Figure 7
Na+ content (left) and NHX gene expression (right) of shoot (top) and roots (bottom) in S. viridis accessions A10.1 and Ast-1. The bar graphs on the left represent mean percentage (%) dry weight (DW) ± standard error (SE) of Na+ content after 10 d (n = 50). The bar graphs on the right represent mean relative expression ± SE of NHX transcripts after 10 d (n = 50). The statistical analysis used  the Student’s t-test; significant differences are indicated for p < 0.05 (*) and p < 0.01 (**).

References

    1. Rengasamy P. Soil processes affecting crop production in salt-affected soils. Func. Plant. Biol. 2010;37:613–20. doi: 10.1071/FP09249. - DOI
    1. Munns R, Tester M. Mechanisms of salinity tolerance. Ann. Rev. Plant. Biol. 2008;59:651–81. doi: 10.1146/annurev.arplant.59.032607.092911. - DOI - PubMed
    1. Blumwald E, Aharon GS, Apse MP. Sodium transport in plant cells. Biochem. Biophys. Acta. 2000;1465(1-2):140–51. doi: 10.1016/S0005-2736(00)00135-8. - DOI - PubMed
    1. Kovtun Y, Chiu WL, Tena G, Sheen J. Functional analysis of oxidative stress-activated mitogen-activated protein kinase cascade in plants. Proc Natl Acad Sci USA. 2000;25(6):2940–45. doi: 10.1073/pnas.97.6.2940. - DOI - PMC - PubMed
    1. Cheeseman JM. Pump-leak sodium fluxes in low salt corn root. J. Membr. Biol. 1982;70:157–64. doi: 10.1007/BF01870225. - DOI

Publication types