. 2020 Jan;122(2):221-232.
doi: 10.1038/s41416-019-0652-x. Epub 2019 Dec 10.

Metabolic response patterns in brain microdialysis fluids and serum during interstitial cisplatin treatment of high-grade glioma

Affiliations

Metabolic response patterns in brain microdialysis fluids and serum during interstitial cisplatin treatment of high-grade glioma

Benny Björkblom et al. Br J Cancer. 2020 Jan.

Abstract

Background: High-grade gliomas are associated with poor prognosis. Tumour heterogeneity and invasiveness create challenges for effective treatment and use of systemically administrated drugs. Furthermore, lack of functional predictive response-assays based on drug efficacy complicates evaluation of early treatment responses.

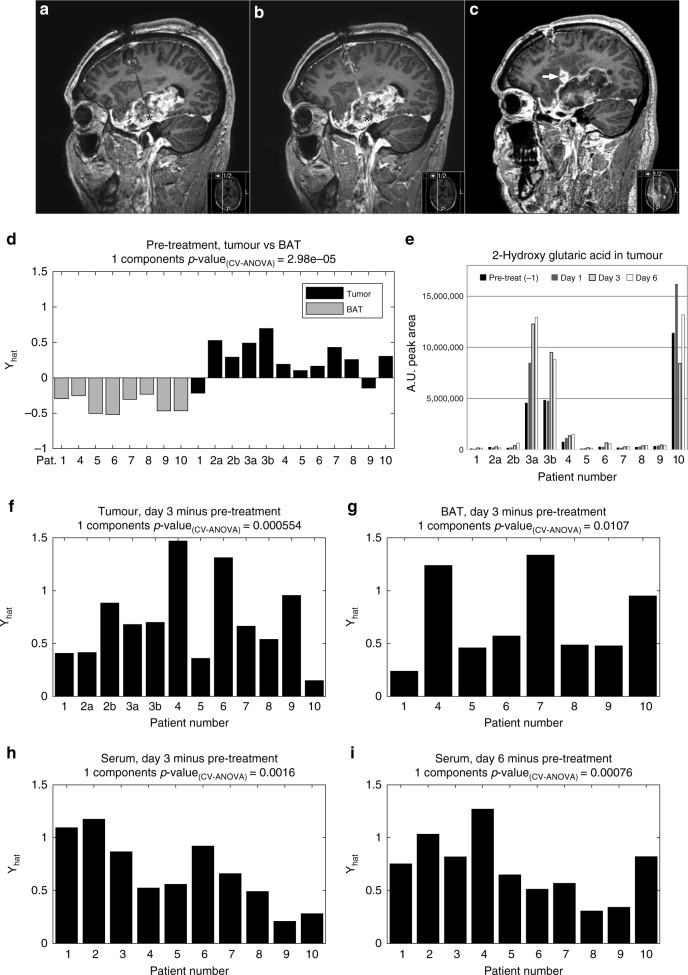
Methods: We used microdialysis to deliver cisplatin into the tumour and to monitor levels of metabolic compounds present in the tumour and non-malignant brain tissue adjacent to tumour, before and during treatment. In parallel, we collected serum samples and used multivariate statistics to analyse the metabolic effects.

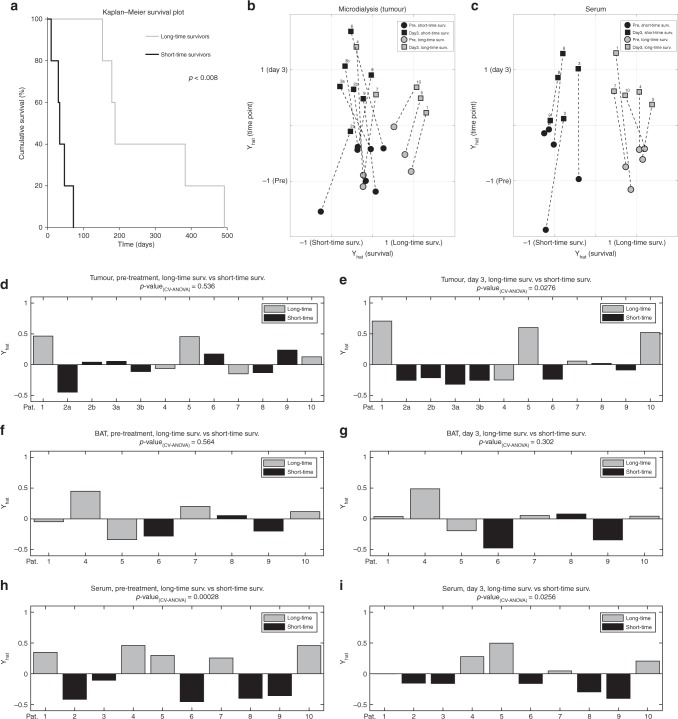
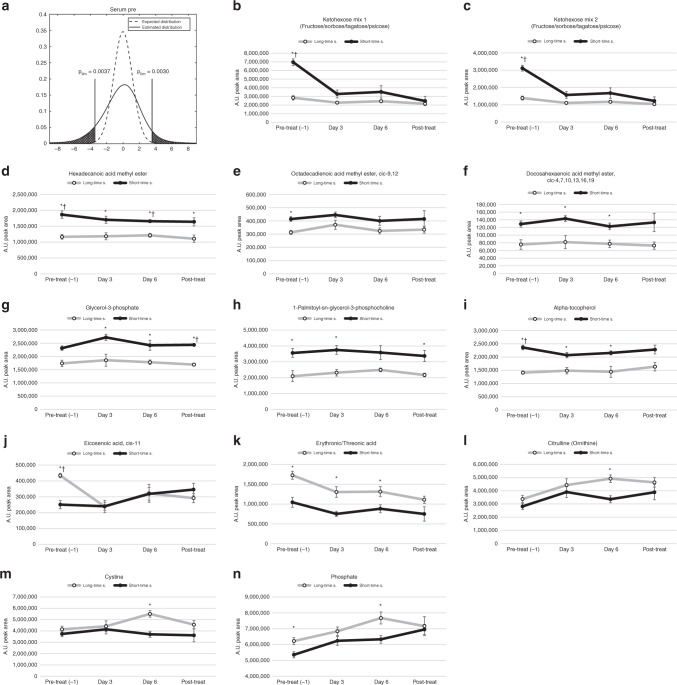
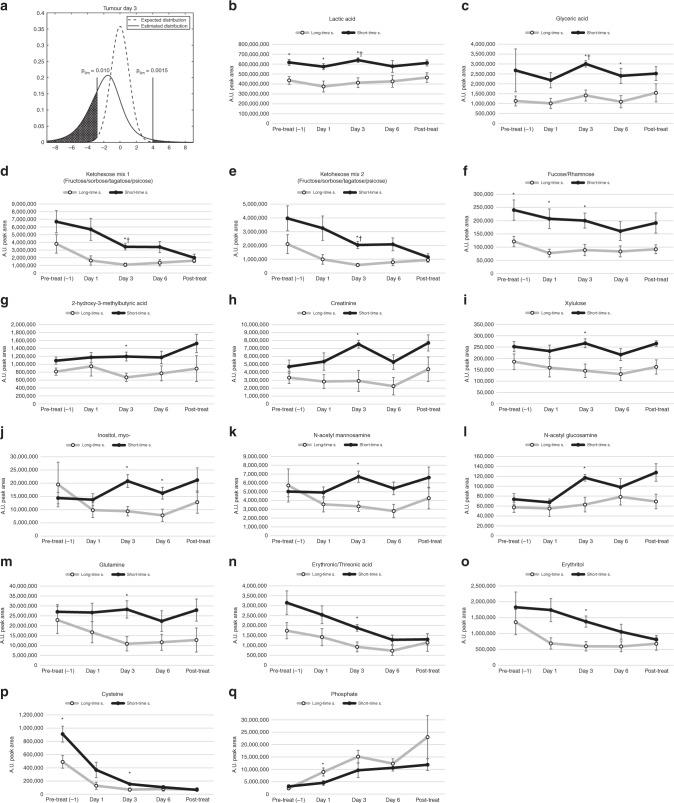
Results: We found distinct metabolic patterns in the extracellular fluids from tumour compared to non-malignant brain tissue, including high concentrations of a wide range of amino acids, amino acid derivatives and reduced levels of monosaccharides and purine nucleosides. We found that locoregional cisplatin delivery had a strong metabolic effect at the tumour site, resulting in substantial release of glutamic acid, phosphate, and spermidine and a reduction of cysteine levels. In addition, patients with long-time survival displayed different treatment response patterns in both tumour and serum. Longer survival was associated with low tumour levels of lactic acid, glyceric acid, ketoses, creatinine and cysteine. Patients with longer survival displayed lower serum levels of ketohexoses, fatty acid methyl esters, glycerol-3-phosphate and alpha-tocopherol, while elevated phosphate levels were seen in both tumour and serum during treatment.

Conclusion: We highlight distinct metabolic patterns associated with high-grade tumour metabolism, and responses to cytotoxic cisplatin treatment.


Conflict of interest statement

The authors declare no competing interests.

Figures

Fig. 1
Fig. 1
Contrast-enhanced MR-images of patient no. 5. a Before start of treatment. b After five days of cisplatin treatment. Black asterisk in A–B marks tip of microdialysis catheter. c One months after ten days of cisplatin treatment demonstrating widespread necrosis in the tumour area. White arrow in C marks inflammatory response at the catheter site. d Multivariate statistical OPLS-DA model comparing metabolite levels detected in microdialysis fluids from tumour and BAT. e Relative quantification of 2-hydroxy glutaric acid concentration in microdialysis fluids from the extracellular compartment of tumour tissue pre-treatment, and after one to 6 days of cisplatin treatment. For patient number 2 and 3, dialysate from two treatment catheters was available for analysis, denoted 2a, 2b, 3a and 3b. f, g Paired multivariate OPLS-EP models comparing metabolite levels detected in microdialysis fluids from tumour (f) and BAT (g) prior to treatment to levels after 3 days of cisplatin treatment. h, i Paired multivariate OPLS-EP models comparing metabolite levels detected in serum prior to treatment to levels after 3 days (h) or 6 days (i) of cisplatin treatment. Statistical significances for the cross-validated models are indicated by CV-ANOVA.
Fig. 2
Fig. 2
Visualisation of survival and treatment response for long-time and short-time survivors. a Kaplan-Meier survival plot for study participants divided into long-time survivors and short-time survivors. Statistical difference indicated with p-value using two-tailed t-test. b, c Scatter plots showing simultaneous modelling of long- vs. short-time survivors and pre-treatment vs. after 3 days of treatment, based on all identified metabolites, in tumour (b) and serum (c) using OPLS. Axis show estimate of survival-time (x-axis) and time point (y-axis). Data labels indicate: patient number 1 to 10, short-time survivors in black, long-time survivors in grey, pre-treatment with circle markers and three days of cisplatin treatment with square markers. Samples from the same patient are connected with a dashed line. di Cross-validated multivariate statistical OPLS-DA models comparing metabolite levels detected in long-time survivors vs. short-time survivors: In microdialysis fluids from tumour prior to treatment (d) and after three days of treatment (e). In microdialysis fluids from BAT prior to treatment (f) and after three days of treatment (g). In serum prior to treatment (h) and after three days of treatment (i). Statistical significances for the cross-validated models are indicated by CV-ANOVA.
Fig. 3
Fig. 3
Treatment response patterns for selected metabolites in serum of long-time and short-time survivors. a The dashed line indicates the expected t-value distribution if there were no significant differences. The solid line indicates estimated t-value distribution from comparisons of metabolite levels in short-time survivor vs. long-time survivor detected in serum prior to treatment. The limits indicate regions where the probability is more than 10 time higher in the estimated distribution. bq Metabolites detected in serum with suggestively different concentrations when comparing long-time survivors (○) to short-time survivors (●). Values on x-axes indicated sampling times; one day prior to treatment, after 1–6 days of treatment and after the treatment has ended. Values on y-axes show mean arbitrary units for quantified peak area ± SEM. *p < 0.05, bh FDR < 0.1.
Fig. 4
Fig. 4
Treatment response patterns for selected metabolites in microdialysate from tumour of long-time and short-time survivors. a The dashed line indicates the expected t-value distribution if there were no significant differences. The solid line indicates estimated t-value distribution from comparisons of metabolite levels in short-time survivor vs. long-time survivor detected in microdialysis fluids from tumours after 3 days of treatment. The limits indicate regions where the probability is more than 10 time higher in the estimated distribution. bq Metabolites detected in microdialysis fluids with suggestively different concentrations when comparing long-time survivors (○) to short-time survivors (●). Values on x-axes indicated sampling times; one day prior to treatment, after 1–6 days of treatment and after the treatment has ended. Values on y-axes show mean arbitrary units for quantified peak area ± SEM. *p < 0.05, bh FDR < 0.1.

References

    1. Delgado-Lopez PD, Corrales-Garcia EM. Survival in glioblastoma: a review on the impact of treatment modalities. Clin. Transl. Oncol. 2016;18:1062–1071. doi: 10.1007/s12094-016-1497-x. - DOI - PubMed
    1. Aiken R. Molecular neuro-oncology and the challenge of the blood-brain barrier. Semin. Oncol. 2014;41:438–445. doi: 10.1053/j.seminoncol.2014.06.005. - DOI - PubMed
    1. Andronesi OC, Loebel F, Bogner W, Marjanska M, Vander Heiden MG, Iafrate AJ, et al. Treatment response assessment in IDH-mutant glioma patients by noninvasive 3D functional spectroscopic mapping of 2-hydroxyglutarate. Clin. Cancer Res. 2016;22:1632–1641. doi: 10.1158/1078-0432.CCR-15-0656. - DOI - PMC - PubMed
    1. Khan MN, Sharma AM, Pitz M, Loewen SK, Quon H, Poulin A, et al. High-grade glioma management and response assessment-recent advances and current challenges. Curr. Oncol. 2016;23:e383–e391. doi: 10.3747/co.23.3082. - DOI - PMC - PubMed
    1. Reardon DA, Ballman KV, Buckner JC, Chang SM, Ellingson BM. Impact of imaging measurements on response assessment in glioblastoma clinical trials. Neuro Oncol. 2014;16(Suppl 7):vii24–vii35. doi: 10.1093/neuonc/nou286. - DOI - PMC - PubMed

Publication types

MeSH terms