Clinical Trial
. 2020 Jan;122(2):258-265.
doi: 10.1038/s41416-019-0665-5. Epub 2019 Dec 10.

Transcriptomic analysis of human primary breast cancer identifies fatty acid oxidation as a target for metformin

Affiliations
Clinical Trial

Transcriptomic analysis of human primary breast cancer identifies fatty acid oxidation as a target for metformin

Simon R Lord et al. Br J Cancer. 2020 Jan.

Abstract

Background: Epidemiological studies suggest that metformin may reduce the incidence of cancer in patients with diabetes and multiple late phase clinical trials assessing the potential of repurposing this drug are underway. Transcriptomic profiling of tumour samples is an excellent tool to understand drug bioactivity, identify candidate biomarkers and assess for mechanisms of resistance to therapy.

Methods: Thirty-six patients with untreated primary breast cancer were recruited to a window study and transcriptomic profiling of tumour samples carried out before and after metformin treatment.

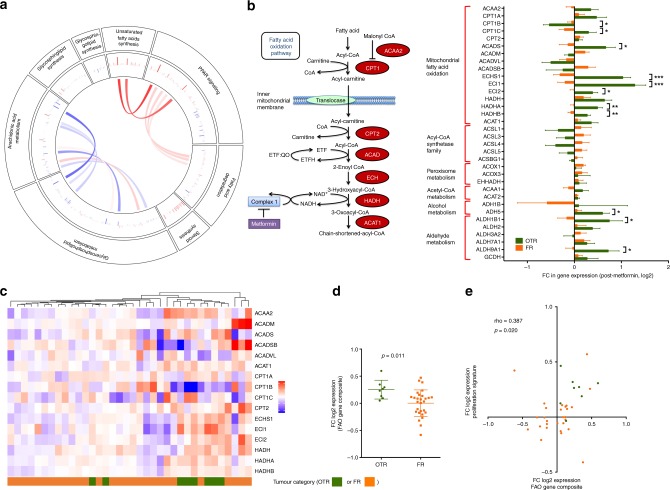
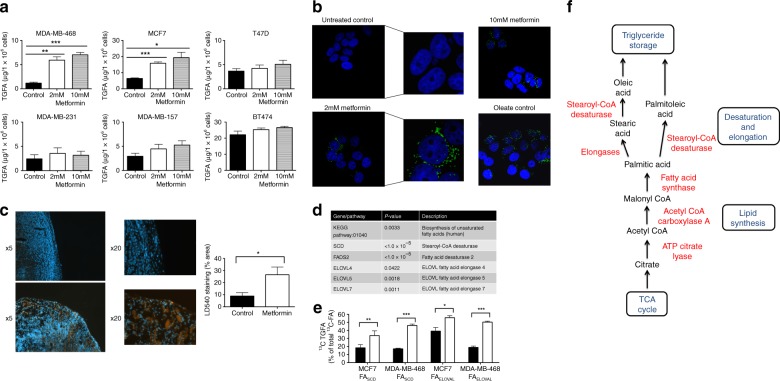
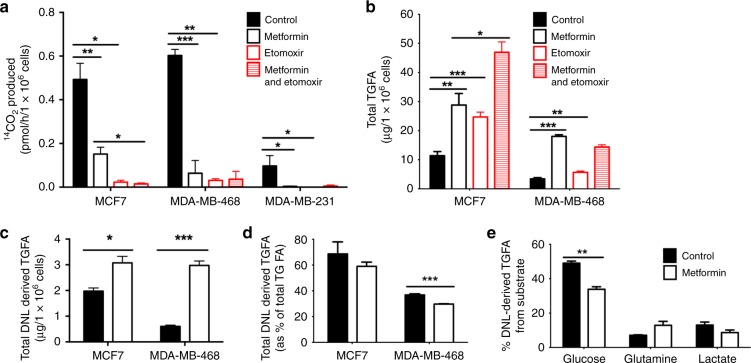
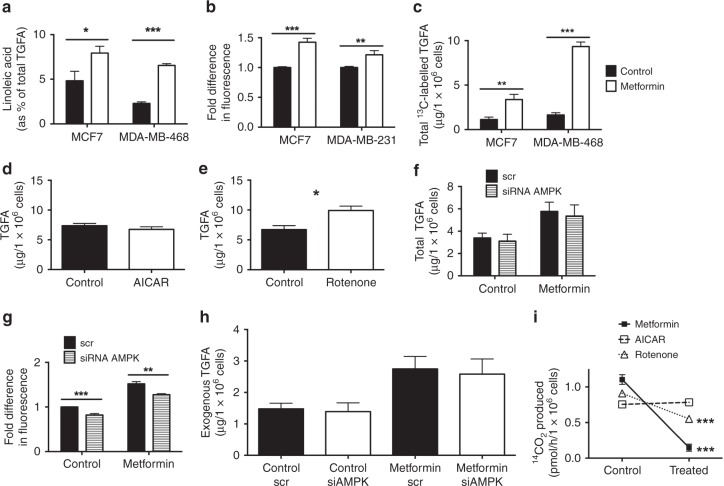
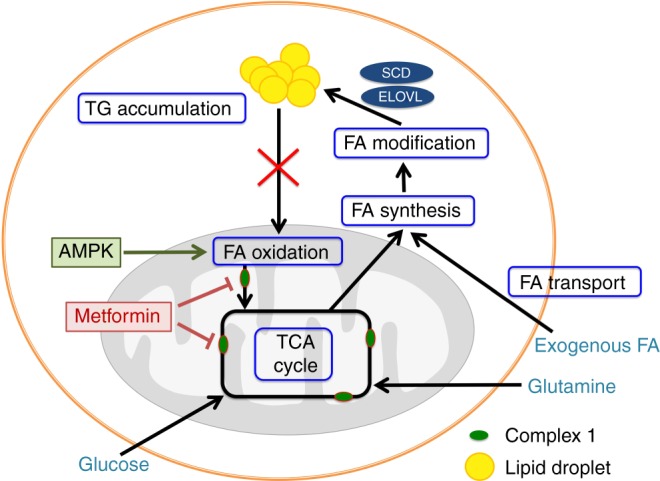
Results: Multiple genes that regulate fatty acid oxidation were upregulated at the transcriptomic level and there was a differential change in expression between two previously identified cohorts of patients with distinct metabolic responses. Increase in expression of a mitochondrial fatty oxidation gene composite signature correlated with change in a proliferation gene signature. In vitro assays showed that, in contrast to previous studies in models of normal cells, metformin reduces fatty acid oxidation with a subsequent accumulation of intracellular triglyceride, independent of AMPK activation.

Conclusions: We propose that metformin at clinical doses targets fatty acid oxidation in cancer cells with implications for patient selection and drug combinations.

Clinical trial registration: NCT01266486.


Conflict of interest statement

The authors declare no competing interests.

Figures

Fig. 1
Fig. 1
a Circos plot to show all lipid metabolism pathways in the KEGG database with significant changes in expression. The width of the outer circle shows the mean relative abundances for the secondary hierarchy. The bars in the innermost circle represent the mean relative abundances for genes encoding proteins within the individual pathways. The curved lines link genes that are shared among different pathways as indexed by KEGG Multiple lipid metabolism pathways that had significant changes in expression at the transcriptomic level. b Change in expression of genes involved in regulation of fatty acid degradation (all genes from KEGG:00071, does not include non-expressed genes in this KEGG pathway), unpaired t-test (n = 36). Data shown are mean ± SEM. *p < 0.05; **p < 0.01; ***p < 0.001. c Heatmap of differentially expressed genes from the fatty acid degradation pathway (KEGG:00071) but limited to key regulators of mitochondrial FAO. Each row represents a gene and each column represents a single patient (n = 36). Colours reflect the fold change for each gene post-metformin: Red = upregulation, Blue = downregulation. Samples were visually clustered using hierarchical clustering. OXPHOS transcriptional response group (OTR; eight patients) and FDG response group (FR; 28 patients) shown. d Scatter plot to show for the OXPHOS transcriptional response group (OTR) and FDG response group (FR) change in the composite FAO gene expression signature for the breast primary tumour (both post minus pre). Data shown are mean ± SEM, unpaired t-test. e Correlation between fold change in the proliferation metagene signature and change in the composite FAO gene expression signature. Spearman’s rank correlation coefficient and significance are shown.
Fig. 2
Fig. 2
a For each cell line: cells were treated with either 2 or 10 mM metformin vs. control (no metformin) for 48 h and TGFAs measured using gas chromatography (GC). Data are expressed as mean total TGFA (µg/4 × 106 cells) ± SEM (n = 3). b LD540 staining of lipid droplets (green) in MCF7 cells treated with 0, 2 and 10 mM metformin and control (MCF7 cells treated with 250 µM oleate). DAPI-stained nuclei are seen in blue. c LD540 staining of control and metformin-treated MDA-MB-468 xenografts. Image analysis quantification of the LD540 staining in the xenografts expressed as a percentage of the area staining for DAPI (n = 6, each group). d KEGG pathway and key genes relating to fatty acid modification with increased expression following metformin treatment in clinical study (all tumours; n = 36). e Effect of metformin on the SCD and ELOVL indices in MCF7 and MDA-MB-468 cells (n = 4–6). f Diagram to show initial desaturation and elongation steps for palmitic acid prior to storage triglyceride. Data shown are mean ± SEM. *p < 0.05; **p < 0.01; ***p < 0.001.
Fig. 3
Fig. 3
a Rate of oleate oxidation in MCF7, MDA-MB-468 and MDA-MB-231 cells after 48 h treatment with 2 mM metformin and/or 100 µM etomoxir (n = 3–4). b The effects of metformin (2 mM) and etomoxir (100 µM) on total TGFA accumulation in MCF7 and MDA-MB-468 cells (n = 4–6). c All six cell lines were treated with 2 mM metformin and/or 100μM etomoxir vs. control for 96 h in media supplemented with 25 mM glucose or with 20 mM galactose but no glucose and cell number measured (n = 6). d Accumulation of DNL-derived TGFA in MCF7 and MDA-MB-468 cells (n = 3). e Percentage of TGFA synthesised via DNL as estimated from 2H2O enrichment of fatty acid (n = 3). f Accumulation of TGFA in MCF7 cells derived from three different 13C-labelled substrates: glucose, glutamine and lactate (n = 3). Data shown are mean ± SEM. *P < 0.05; **P < 0.01; ***P < 0.001.
Fig. 4
Fig. 4
a Effect of 2 mM metformin on the levels of the essential fatty acid, linoleic acid, as a percentage of TG fatty acid in MCF7 and MDA-MB-468 cells (n = 3–7). b Effect of 2 mM metformin increased BODIPY C16 uptake in MCF7 and MDA-MB-231 cells (n = 3). c Effect of 2 mM metformin on 13C16-palmitate incorporation into TGFA in MCF7 cells (n = 5–6). d Effect of AICAR on triglyceride fatty acid accumulation in MCF7 cells (n = 3). e Effect of rotenone on triglyceride fatty acid accumulation in MCF7 cells (n = 3). f Effect of siRNA-mediated AMPK knockdown (siAMPK) on exogenous fatty acid accumulation after 48 h of treatment with 2 mM metformin in MCF7 cells (n = 3). g Effect of siAMPK on BODIPY-C16 uptake in control and 2 mM metformin-treated MCF7 cells (n = 3). h Effect of siAMPK on exogenous fatty acid accumulation after 48 h of treatment with 2 mM metformin in MCF7 cells (n = 3). i Effects of AICAR, rotenone and metformin on fatty acid oxidation in MCF7 cells (n = 3). Data shown are mean ± SEM. *P < 0.05; **P < 0.01; ***P < 0.001.
Fig. 5
Fig. 5
Model of effect of metformin on lipid metabolism on breast cancer cells. Triglyceride is synthesised from fatty acid derived from carbon sources including glucose and glutamine and also exogenous fatty acid, requiring modification by elongases and desaturases prior to storage in lipid droplets. Metformin inhibits complex 1 disrupting electron transfer required to catalyse the final dehydrogenation step of fatty acid oxidation resulting in the accumulation of triglyceride in lipid droplets. AMPK is known to be an activator of fatty acid oxidation and metformin’s predominant effects on lipid metabolism in breast cancer cells are via an AMPK-independent pathway and secondary to its more direct mitochondrial effect on Complex 1. FA fatty acid, TG triglyceride, TCA Cycle tricarboxylic acid cycle.

References

    1. Decensi A, Puntoni M, Goodwin P, Cazzaniga M, Gennari A, Bonanni B, et al. Metformin and cancer risk in diabetic patients: a systematic review and meta-analysis. Cancer Prev. Res. (Phila) 2010;3:1451–1461. doi: 10.1158/1940-6207.CAPR-10-0157. - DOI - PubMed
    1. Zakikhani M, Dowling R, Fantus IG, Sonenberg N, Pollak M. Metformin is an AMP kinase-dependent growth inhibitor for breast cancer cells. Cancer Res. 2006;66:10269–10273. doi: 10.1158/0008-5472.CAN-06-1500. - DOI - PubMed
    1. Owen MR, Doran E, Halestrap AP. Evidence that metformin exerts its anti-diabetic effects through inhibition of complex 1 of the mitochondrial respiratory chain. Biochem. J. 2000;348(Pt 3):607–614. doi: 10.1042/bj3480607. - DOI - PMC - PubMed
    1. Lord Simon R., Cheng Wei-Chen, Liu Dan, Gaude Edoardo, Haider Syed, Metcalf Tom, Patel Neel, Teoh Eugene J., Gleeson Fergus, Bradley Kevin, Wigfield Simon, Zois Christos, McGowan Daniel R., Ah-See Mei-Lin, Thompson Alastair M., Sharma Anand, Bidaut Luc, Pollak Michael, Roy Pankaj G., Karpe Fredrik, James Tim, English Ruth, Adams Rosie F., Campo Leticia, Ayers Lisa, Snell Cameron, Roxanis Ioannis, Frezza Christian, Fenwick John D., Buffa Francesca M., Harris Adrian L. Integrated Pharmacodynamic Analysis Identifies Two Metabolic Adaption Pathways to Metformin in Breast Cancer. Cell Metabolism. 2018;28(5):679-688.e4. doi: 10.1016/j.cmet.2018.08.021. - DOI - PMC - PubMed
    1. Liu, X., Romero, I. L., Litchfield, L. M., Lengyel, E. & Locasale, J. W. Metformin targets central carbon metabolism and reveals mitochondrial requirements in human cancers. Cell Metab. 24, 728–739 (2016). - PMC - PubMed

Publication types

MeSH terms

Associated data