. 2020 Feb;5(2):282-290.
doi: 10.1038/s41564-019-0627-y. Epub 2019 Dec 9.

Reactive oxygen species induce antibiotic tolerance during systemic Staphylococcus aureus infection

Affiliations

Reactive oxygen species induce antibiotic tolerance during systemic Staphylococcus aureus infection

Sarah E Rowe et al. Nat Microbiol. 2020 Feb.

Erratum in

Abstract

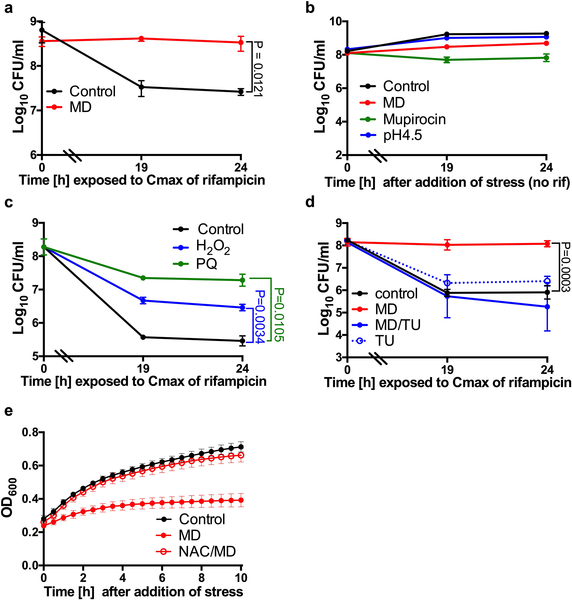
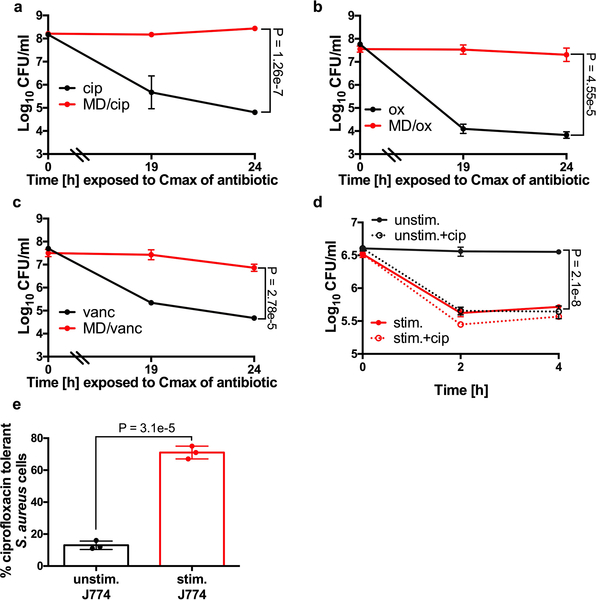
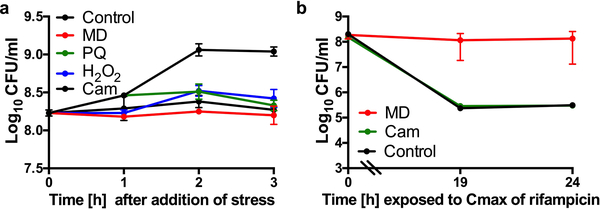
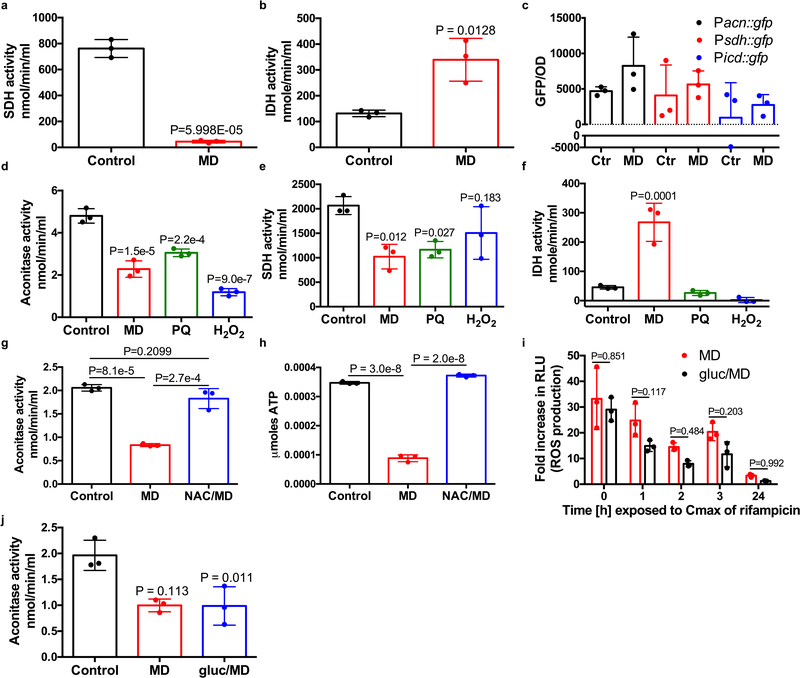
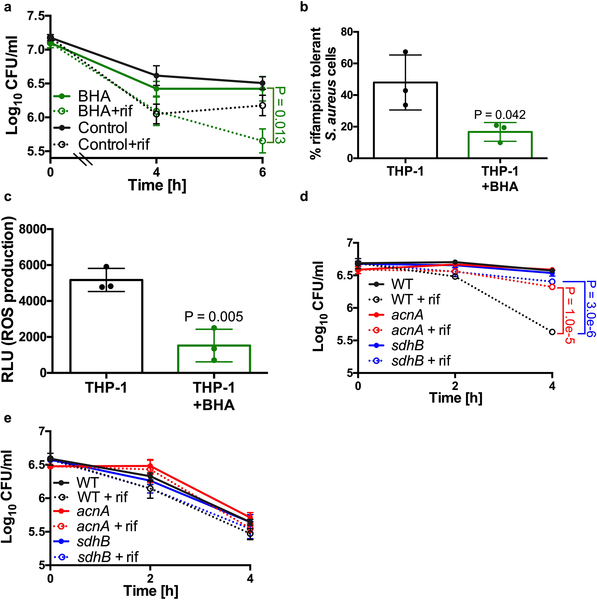
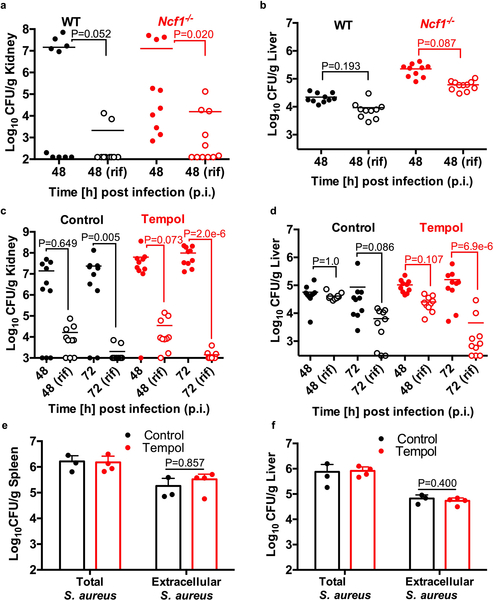
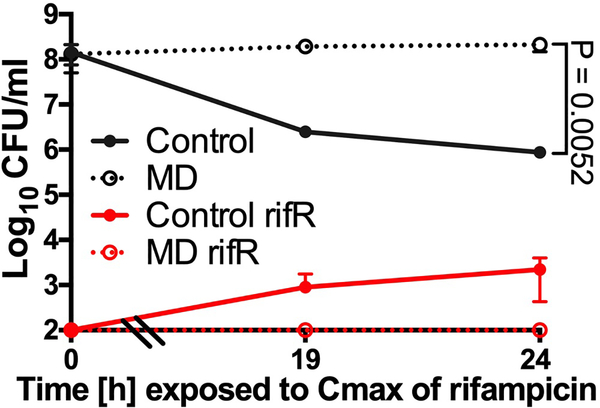
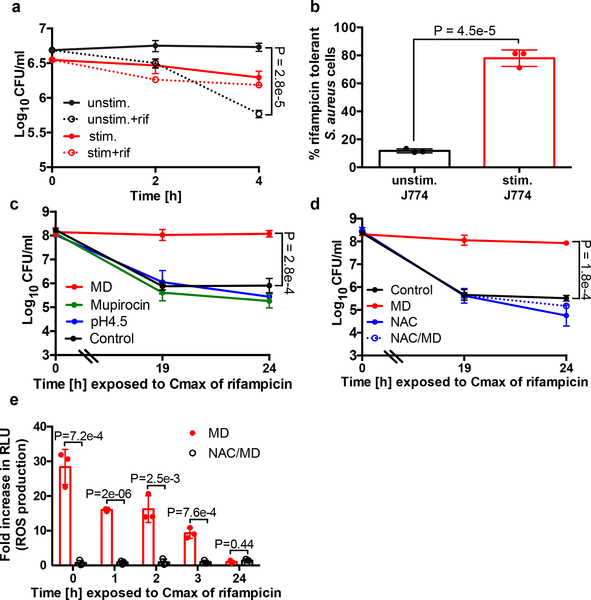
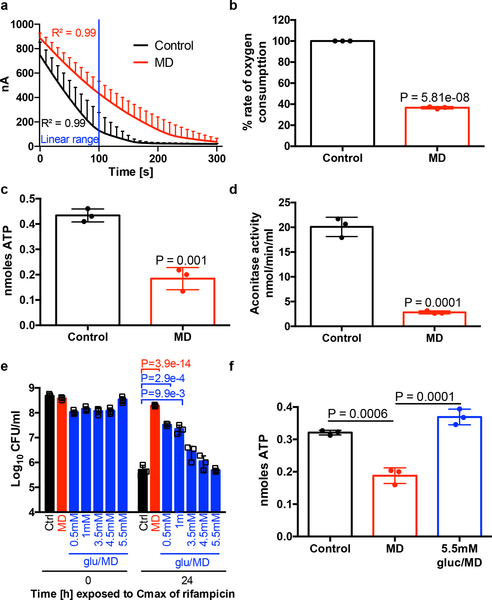
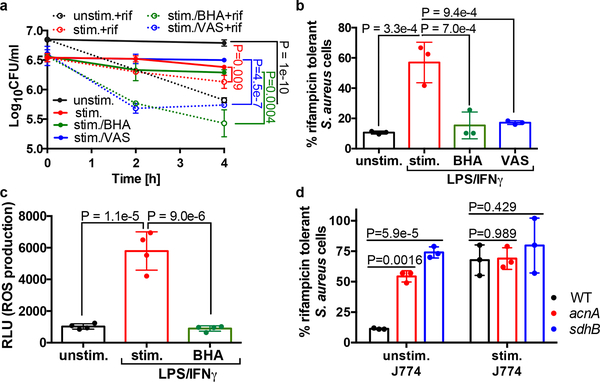
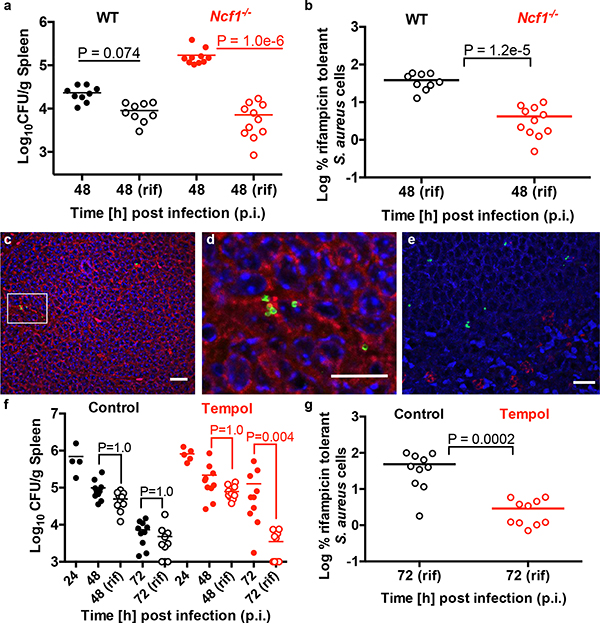
Staphylococcus aureus is a major human pathogen that causes an array of infections ranging from minor skin infections to more serious infections, including osteomyelitis, endocarditis, necrotizing pneumonia and sepsis1. These more serious infections usually arise from an initial bloodstream infection and are frequently recalcitrant to antibiotic treatment1. Phagocytosis by macrophages and neutrophils is the primary mechanism through which S. aureus infection is controlled by the immune system2. Macrophages have been shown to be a major reservoir of S. aureus in vivo3, but the role of macrophages in the induction of antibiotic tolerance has not been explored. Here, we show that macrophages not only fail to efficiently kill phagocytosed S. aureus, but also induce tolerance to multiple antibiotics. Reactive oxygen species generated by respiratory burst attack iron-sulfur cluster-containing proteins, including TCA-cycle enzymes, result in decreased respiration, lower ATP and increased antibiotic tolerance. We further show that respiratory burst induces antibiotic tolerance in the spleen during a murine systemic infection. These results suggest that a major component of the innate immune response is antagonistic to the bactericidal activities of antibiotics.


Conflict of interest statement

Competing interests

The authors declare no competing interests.

Figures

Extended Data Fig. 1:
Extended Data Fig. 1:. Induction of antibiotic tolerance by ROS.
(a) S. aureus strain COL or (b-e) HG003 was grown to mid-exponential phase in vitro and exposed to 80μM menadione (MD), 0.125μg/ml mupirocin, acidified media (pH4.5), 5mM paraquat (PQ), 120mM hydrogen peroxide (H2O2), 4mM N-acetyl cysteine (NAC) or 150mM thiourea (TU) for 20min and either (a, c-d) challenged with 10μg/ml rifampicin or (b) plated for cfu or (e) OD600 was recorded every 30min for 10h. (a-d) At indicated times, an aliquot was removed and plated on tryptic soy agar (TSA) to enumerate cfu. Averages of n=3 biologically independent samples. Error bars represent standard deviation. Statistical significance was determined using (a, c) Student’s t-test (unpaired, two-tailed) or (d) One-Way ANOVA with Dunnett’s multiple comparison test.
Extended Data Fig. 2:
Extended Data Fig. 2:. ROS induces multidrug tolerance in S. aureus.
HG003 was grown to exponential phase in vitro and exposed to 80μM menadione (MD) for 20min prior to challenge with (a) 2.34μg/ml ciprofloxacin (cip), (b) 50μg/ml oxacillin (ox) or (c) 50μg/ml vancomycin (vanc). (d) Survival of S. aureus cells after internalization by unstimulated J774 macrophages (unstim.) or macrophages that were stimulated overnight with LPS/IFNγ (stim.). 40μg/ml cip was added at Time 0 (dotted lines). At the indicated times, an aliquot was removed, washed and plated to enumerate survivors. (e) % Survival of S. aureus cells treated with ciprofloxacin for 4h compared to the untreated control (data extrapolated from d). Averages of n=3 biologically independent samples. Error bars represent standard deviation. Statistical significance was determined using (a-c, e) the Student’s t-test (unpaired, two-tailed) or (d) One-Way ANOVA with Sidak’s multiple comparison test.
Extended Data Fig. 3:
Extended Data Fig. 3:. Growth cessation is insufficient to induce tolerance to rifampicin.
S. aureus strain HG003 was grown to mid-exponential phase in vitro and exposed to 80μM menadione (MD), 5mM paraquat (PQ), 120mM hydrogen peroxide (H2O2) or 30μg/ml chloramphenicol (Cam) for 20min and either (a) plated for cfu or (b) challenged with 10μg/ml rifampicin. At indicated times, an aliquot was removed and plated on tryptic soy agar (TSA) to enumerate cfu. Averages of n=3 biologically independent samples. Error bars represent standard deviation.
Extended Data Fig. 4:
Extended Data Fig. 4:. ROS decreases S. aureus metabolic activity.
HG003 was grown to mid-exponential phase and treated with 80μM menadione (MD), 5mM paraquat (PQ), 120mM hydrogen peroxide (H2O2), 4mM N-acetyl cysteine (NAC) or 5.5mM glucose (gluc) for (a-f, j) 2h or (g-h) 0.5h and then assayed for (a, e) succinate dehydrogenase (SDH) activity, (b, f) isocitrate dehydrogenase (IDH) activity and (d, g, j) aconitase activity. (c) Transcriptional activity of acn, sdh and icd genes was determined using promoter-gfp reporters. (h) ATP was quantified using a BactiterGlo Cell Viability Assay. (i) At indicated times, ROS production was measured using L-012 luminescent probe and expressed as a fold-increase compared to the untreated control. RLU denotes relative luminescence units. Averages of n=3 biologically independent samples. Error bars represent standard deviation. Statistical significance was determined using (a-c) Student’s t-test (unpaired, two-tailed) or (d-e, j) One-Way ANOVA with Dunnett’s multiple comparison test, (f-h) One-Way ANOVA with Sidak’s multiple comparison test or (i) Two-Way ANOVA with Sidak’s multiple comparison test.
Extended Data Fig. 5:
Extended Data Fig. 5:. Macrophage-derived ROS induces antibiotic tolerance in S. aureus
(a-b) Survival of S. aureus strain HG003 after internalization by THP-1 macrophages. Where indicated, macrophages were pre-treated with 20μM butylated hydroxanisole (BHA) for 1h prior to the addition of bacteria. (a) 10μg/ml rifampicin (rif) was added at Time 0 (dotted lines). (b) % survival was determined by comparing survivors after 6h of rifampicin treatment to survivors of the corresponding untreated timepoint (extrapolated from a). (c) ROS production by THP-1 macrophages with or without BHA treatment was quantified using the luminescent probe L-012. RLU denotes relative luminescence units. (d-e) Survival of S. aureus strain HG003 (WT), HG003acnA::erm (acnA) and HG003sdhB::erm (sdhB) mutants after internalization by (d) unstimulated J774 macrophages or macrophages that were (e) pre-stimulated overnight with LPS/IFNγ. 10μg/ml rifampicin (rif) was added at Time 0 (dotted lines). Averages of n=3 biologically independent samples. Error bars represent standard deviation. Statistical significance was determined using (a, d-e) One-Way ANOVA with Sidak’s multiple comparison test or (b-c) Student’s t-test (unpaired, two-tailed).
Extended Data Fig. 6:
Extended Data Fig. 6:. Host derived-ROS induces antibiotic tolerance in a mouse model of sepsis.
Sepsis was induced by I.V. injection of S. aureus strain HG003 into (a-b) C57BL/6J wild type (WT) and Ncf1−/− mutant mice or (c-d) wild type mice treated with or without 25mM tempol. At 24h p.i., mice were treated daily with 25mg/kg rifampicin or the vehicle control. S. aureus cfu were enumerated from the kidney and liver at 48h p.i. or 72h p.i. The mean is indicated by a horizontal line and the limit of detection is indicated by the x-axis (a-d). (a-b) Wild type mice: vehicle/rifampicin n=9 animals, Ncf1−/− mice: vehicle n=10 / rifampicin n=11 animals. (c-d) control n=4 / tempol n=5 animals (at 24h p.i,) and control/tempol mice: vehicle/rifampicin n=10 animals (at 48h and 72h p.i.). (e-f) Extracellular bacterial numbers were enumerated in the spleen and liver of control (n=3 animals) and tempol treated (n=4 animals) mice at 24h p.i. prior to antibiotic challenge and error bars represent standard deviation. Statistical significance was determined using (a-d) Kruskal Wallis One-Way ANOVA with Dunn’s multiple comparison test or the (e-f) Mann-Whitney test.
Extended Data Fig. 7:
Extended Data Fig. 7:. Resistance does not contribute to menadione-induced antibiotic tolerance.
HG003 was grown to mid-exponential phase in vitro and exposed to 80μM menadione (MD) for 20min prior to addition of 10μg/ml rifampicin. At indicated times, an aliquot was removed and plated on tryptic soy agar (TSA) to enumerate survivors or (f) TSA containing 10μg/ml rifampicin to enumerate rifampicin resistant mutants (rifR). Averages of n=3 biologically independent samples. Error bars represent standard deviation. Statistical significance was determined using Student’s t-test (unpaired, two-tailed).
Extended Data Fig. 8:
Extended Data Fig. 8:. ROS does not inactivate rifampicin.
At indicated times the minimum inhibitory concentration (MIC) of rifampicin (rif) was determined following exposure to ROS in the in vitro antibiotic survival assays (Fig. 1c) and in tissue culture intracellular survival assays (Fig. 1a).
Fig. 1.
Fig. 1.. Induction of antibiotic tolerance by stimulated macrophages.
(a) Survival of S. aureus cells after internalization by unstimulated J774 macrophages (unstim.) or macrophages that were stimulated overnight with LPS/IFNγ (stim.). 10μg/ml rifampicin (rif) was added at Time 0 (dotted lines). (b) % Survival of S. aureus cells treated with rifampicin for 4h compared to the untreated control (extrapolated from a). (c-e) S. aureus strain HG003 was grown to mid-exponential phase in vitro and exposed to 80μM menadione (MD), 0.125μg/ml mupirocin, acidified media (pH4.5) or 4mM N-acetyl cysteine (NAC) for 20min prior to the addition of rifampicin at Time 0. At indicated times, an aliquot was removed, (c, d) washed in 1% NaCl and plated to enumerate survivors or (e) ROS production was measured using L-012 luminescent probe and expressed as a fold-increase compared to the untreated control. RLU denotes relative luminescence units. Averages of n=3 biologically independent samples. Error bars represent standard deviation. Statistical significance was determined using (a, c-d) One-Way ANOVA with Sidak’s multiple comparison test or (b, e) Student’s t-test (unpaired, two-tailed). See also Extended Data Fig. 1.
Fig. 2.
Fig. 2.. ROS decreases S. aureus metabolic activity.
(a-d) HG003 was grown to mid-exponential phase and treated with or without 80μM menadione (MD) for 2h. (a-b) Oxygen consumption was measured for 300s (nA denotes nanoamphere) and (b) the rate of oxygen consumption was calculated using the linear range (indicated by blue line in a), (c) intracellular ATP was measured using a BactiterGlo Cell Viability Assay, (d) aconitase activity was measured. (e-f) HG003 was grown to mid-exponential phase and exposed to MD and/or indicated concentrations of glucose. Cultures were either (e) challenged with 10μg/ml rifampicin and survivors were enumerated after 24h, (f) or ATP was quantified after 30min using a BactiterGlo Cell Viability Assay. Averages of n=3 biologically independent samples. Error bars represent standard deviation. Statistical significance was determined using (b-d) Student’s t-test (unpaired, two-tailed), (e) One-Way ANOVA with Dunnett’s multiple comparison test or (f) One-Way ANOVA with Sidak’s multiple comparison test. See also Extended Data Fig. 4.
Fig. 3.
Fig. 3.. Macrophage derived-ROS induces antibiotic tolerance in S. aureus.
(a-b, d) Survival of S. aureus strain HG003 (WT), HG003acnA::erm (acnA) and HG003sdhB::erm (sdhB) mutants following internalization by unstimulated J774 macrophages (unstim.) or macrophages that were pre-stimulated overnight with LPS/IFNγ (stim.). Where indicated, macrophages were treated with 20μM butylated hydroxanisole (BHA) or 10μM VAS2870 (VAS) for 1h prior to the addition of bacteria. (a) 10μg/ml rifampicin (rif) was added at Time 0 (dotted lines). (b, d) % survival was determined by comparing survivors after 4h (J774) of rifampicin treatment to survivors to the corresponding untreated timepoint. (c) ROS production by macrophages was quantified using the luminescent probe L-012. Where indicated stimulated macrophages were pre-treated with butylated hydroxanisole (BHA) prior to the addition of L-012. RLU denotes relative luminescence units. Averages of n=3 or (n=4 for c) biologically independent samples. Error bars represent standard deviation. Statistical significance was determined using (a-c) One-Way ANOVA with Sidak’s multiple comparison test or (d) Two-Way ANOVA with Tukey’s multiple comparison test. See also Extended Data Fig. 5.
Fig. 4.
Fig. 4.. Host derived ROS induce antibiotic tolerance in a mouse model of sepsis.
Sepsis was induced by I.V. injection of S. aureus strain HG003 into (a-b) C57BL/6J wild type (WT) and Ncf1−/− mutant mice or (f-g) WT mice treated with or without 25mM tempol. At 24h p.i., mice were treated daily with 25mg/kg rifampicin or the vehicle control. CFU were enumerated from the spleen at 24h, 48h or 72h p.i. The mean is indicated by a horizontal line. The limit of detection is indicated by the x-axis. (a-b) Wild type mice: vehicle/rifampicin n=9 animals, Ncf1−/− mice: vehicle n=10 / rifampicin n=11 animals. (f-g) control n=4 / tempol n=5 animals (at 24h p.i,) and control/tempol mice: vehicle/rifampicin n=10 animals (at 48h and 72h p.i.). Statistical significance was determined using (a, f) Kruskal Wallis One-Way ANOVA with Dunn’s multiple comparison test or (b, g) the Mann Whitney two-tailed test. Immunofluorescence microscopy of wild type mouse spleen at 48h p.i. S. aureus cells (green in c-e) are associated with F4/80 macrophage marker (red in c-d) and not Ly6G neutrophil marker (red in e). Scale bars represent 10μm, 5μm and 10μm in c, d and e, respectively. Microscopy results are representative of three independent experiments. See also Extended Data Fig. 6.

Similar articles

Cited by

References

    1. Lowy FD Staphylococcus aureus infections. N Engl J Med 339, 520–532, doi:10.1056/NEJM199808203390806 (1998). - DOI - PubMed
    1. Rogers DE Studies on bacteriemia. I. Mechanisms relating to the persistence of bacteriemia in rabbits following the intravenous injection of staphylococci. J Exp Med 103, 713–742 (1956). - PMC - PubMed
    1. Surewaard BG et al. Identification and treatment of the Staphylococcus aureus reservoir in vivo. J Exp Med 213, 1141–1151, doi:10.1084/jem.20160334 (2016). - DOI - PMC - PubMed
    1. Lehar SM et al. Novel antibody-antibiotic conjugate eliminates intracellular S. aureus. Nature 527, 323–328, doi:10.1038/nature16057 (2015). - DOI - PubMed
    1. Barcia-Macay M, Seral C, Mingeot-Leclercq MP, Tulkens PM & Van Bambeke F Pharmacodynamic evaluation of the intracellular activities of antibiotics against Staphylococcus aureus in a model of THP-1 macrophages. Antimicrob AgentsChemother 50, 841–851, doi:10.1128/AAC.50.3.841-851.2006 (2006). - DOI - PMC - PubMed

Publication types

MeSH terms