Review
. 2020 Jan;4(1):24-33.
doi: 10.1038/s41559-019-1060-6. Epub 2019 Dec 9.

Towards common ground in the biodiversity-disease debate

Affiliations
Review

Towards common ground in the biodiversity-disease debate

Jason R Rohr et al. Nat Ecol Evol. 2020 Jan.

Abstract

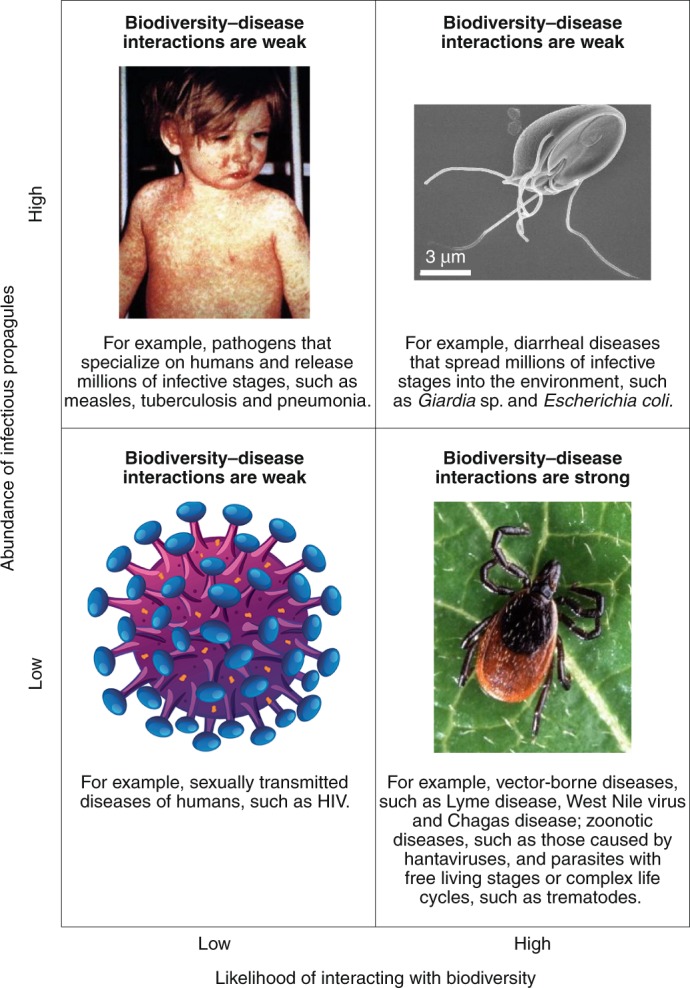
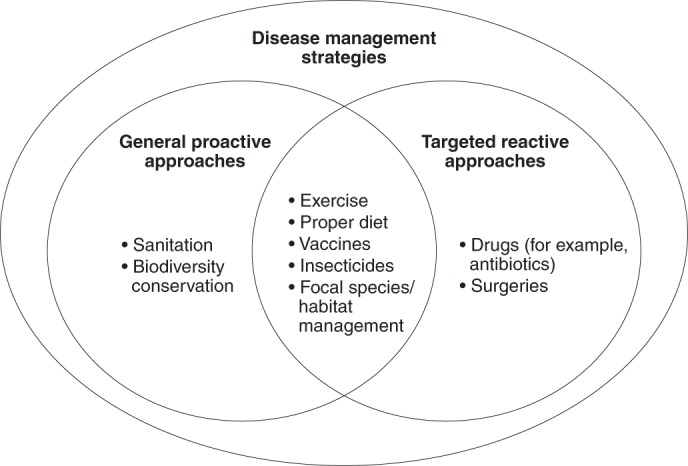
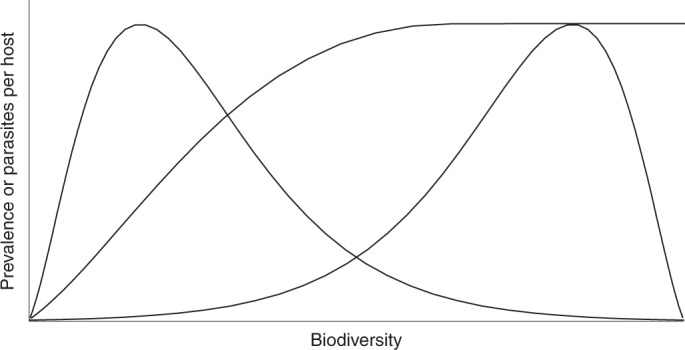
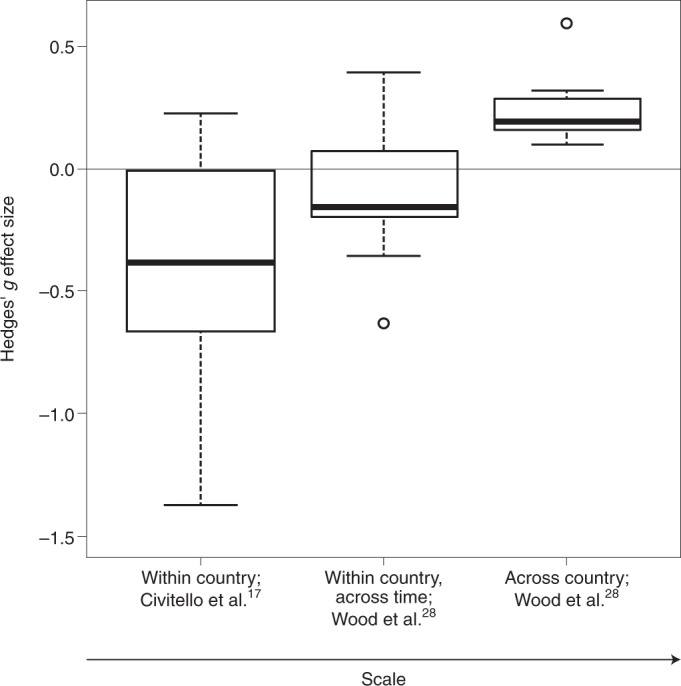
The disease ecology community has struggled to come to consensus on whether biodiversity reduces or increases infectious disease risk, a question that directly affects policy decisions for biodiversity conservation and public health. Here, we summarize the primary points of contention regarding biodiversity-disease relationships and suggest that vector-borne, generalist wildlife and zoonotic pathogens are the types of parasites most likely to be affected by changes to biodiversity. One synthesis on this topic revealed a positive correlation between biodiversity and human disease burden across countries, but as biodiversity changed over time within these countries, this correlation became weaker and more variable. Another synthesis-a meta-analysis of generally smaller-scale experimental and field studies-revealed a negative correlation between biodiversity and infectious diseases (a dilution effect) in various host taxa. These results raise the question of whether biodiversity-disease relationships are more negative at smaller spatial scales. If so, biodiversity conservation at the appropriate scales might prevent wildlife and zoonotic diseases from increasing in prevalence or becoming problematic (general proactive approaches). Further, protecting natural areas from human incursion should reduce zoonotic disease spillover. By contrast, for some infectious diseases, managing particular species or habitats and targeted biomedical approaches (targeted reactive approaches) might outperform biodiversity conservation as a tool for disease control. Importantly, biodiversity conservation and management need to be considered alongside other disease management options. These suggested guiding principles should provide common ground that can enhance scientific and policy clarity for those interested in simultaneously improving wildlife and human health.


Conflict of interest statement

The authors declare no competing interests.

Figures

Fig. 1
Fig. 1. The frequency of interactions with biodiversity and transmission potential are likely to influence whether a parasite will be weakly or strongly affected by biodiversity.
Transmission potential can be a product of releasing millions of infectious stages into the environment (high), or the number of blood meals a vector can take in its lifetime, or the number of sexual partners humans generally have in monogamous societies (low). When transmission potential is low, lost transmission events have a higher potential of reducing disease risk. However, to the extent that biodiversity regulates susceptible hosts and diverse microbiomes protect against infectious diseases (for example, refs. ,,), some of these expectations will need re-evaluation. Measles photo, CDC/NIP/Barbara Rice; Giardia lamblia, CDC/Janice Haney Carr; HIV image, Matthew Cole / Alamy Stock Vector; tick photo, Scott Bauer, USDA Agricultural Research Service.
Fig. 2
Fig. 2. Venn diagram depicting two primary disease management strategies, general proactive and targeted reactive approaches, and examples of each.
Most disease management strategies are either proactive or reactive but some can be both. If dilution occurs more frequently than amplification, we postulate that the value of general biodiversity conservation might be to prevent: (1) multi-host, zoonotic and wildlife diseases from becoming problematic; (2) diseases where specific key hosts are hard to manage; and (3) diseases where little is known about their ecology, because too little is known to hone any intervention to specific species. In contrast, when the key hosts are manageable, interventions might be targeted to specific species or habitats that are known to amplify or dilute disease, which might make the intervention more effective than general biodiversity conservation. To the extent that biodiversity regulates the density of susceptible hosts that might then pass directly transmitted pathogens amongst themselves or influences microbiota that protect against infectious diseases (for example, refs. ,,), some of these hypotheses will need re-evaluation. Although this figure is presented as a dichotomy, it does not imply that each option is equally probable.
Fig. 3
Fig. 3. Hypothetical relationships between biodiversity and disease risk.
The right-skewed distribution suggests that dilution might occur more frequently, but less intensely than amplification because the relationship is moderately negative over a greater portion of the biodiversity gradient than it is strongly positive. The left-skewed distribution suggests that amplification might occur more frequently but less intensely than dilution, because the relationship is moderately positive over a greater portion of the biodiversity gradient than it is strongly negative. An asymptotic distribution suggests that amplification becomes increasingly moderate with biodiversity. In addition to the shape of biodiversity–disease relationships, the frequency with which each biodiversity level occurs in the environment will also affect the likelihood and intensity of dilution and amplification. These hypothetical curves underscore the importance of documenting the shape of biodiversity–disease relationships, which has rarely been accomplished empirically.
Fig. 4
Fig. 4. Hedges’ g effect sizes.
Effect sizes are shown for the association between biodiversity and zoonotic parasites (plus typhoid, because Wood et al. suggest it is biodiversity-responsive) at the cross-country and within-country (through time) scales (median replicate size: 321,489 km2; n = 11) from Wood et al. and various smaller-scale studies (median replicate size: 1.5 km2; n = 12) compiled by Civitello et al.. Hedges’ g was provided by Civitello et al., whereas Wood et al. provided standardized regression coefficients. We converted the standardized regression coefficients to the Hedges’ g used in Civitello et al. by multiplying these coefficients by the sample size bias adjustment, N3N2.25×N2N0.5. To properly account for the lack of independence among multiple effect sizes within studies and for the same diseases in Civitello et al., we calculated a mean effect size for each study weighting by the inverse of the variance, and then used inverse variance weighting on those study-wise means to obtain a weighted mean for each disease (see Source Data Fig. 4 for data used to generate this figure). In the Wood et al. study, the cross-country coefficient is significantly greater than zero (z = 5.82, P < 0.001), whereas the within-country (over time) coefficient is negative but not significantly different from zero (z = –1.20, P = 0.116). However, the relationship between these mean coefficients and scale is significantly positive (F1,10 = 13.59, P = 0.0042), indicating that positive diversity–disease associations are more likely for among-country comparisons than for comparisons within a country, over time. Relative to Wood et al., smaller-scale studies compiled in Civitello et al. were more likely to find negative diversity–disease associations. However, other factors also differ between the Wood et al. and Civitello et al. studies so we cannot confidently attribute all of this difference to the effect of scale. The midline of each boxplot is the median, the lower and upper limits of the box are first and third quartiles, respectively, the whiskers extend to 1.5 times the interquartile range, and the circles are extreme data points. Note that one extreme Hedges’ g value from Civitello et al. at –4.92 (Leptospira spp.) is not shown but was used to calculate the median, quartiles and whiskers of the boxplot. Source data

References

    1. Cardinale BJ, et al. Biodiversity loss and its impact on humanity. Nature. 2012;486:59–67. - PubMed
    1. Rohr JR, Bernhardt ES, Cadotte MW, Clements WH. The ecology and economics of restoration: when, what, where, and how to restore ecosystems. Ecol. Soc. 2018;23:15.
    1. Dornelas M, et al. Assemblage time series reveal biodiversity change but not systematic loss. Science. 2014;344:296–299. - PubMed
    1. Elton, C. S. The Ecology of Invasions by Animals and Plants (Methuen Publishing, 1958).
    1. Van der Plank, J. E. Plant Diseases: Epidemics and Control (Academic Press, 1963).

Publication types