. 2020 Feb;17(2):167-174.
doi: 10.1038/s41592-019-0665-7. Epub 2019 Dec 9.

Directed evolution improves the catalytic efficiency of TEV protease

Affiliations

Directed evolution improves the catalytic efficiency of TEV protease

Mateo I Sanchez et al. Nat Methods. 2020 Feb.

Erratum in

Abstract

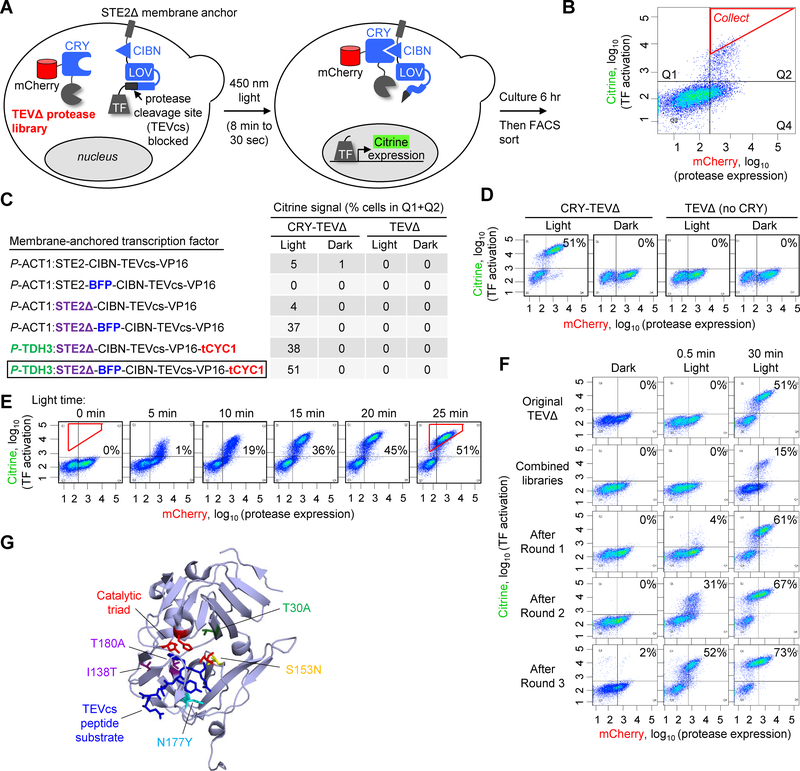
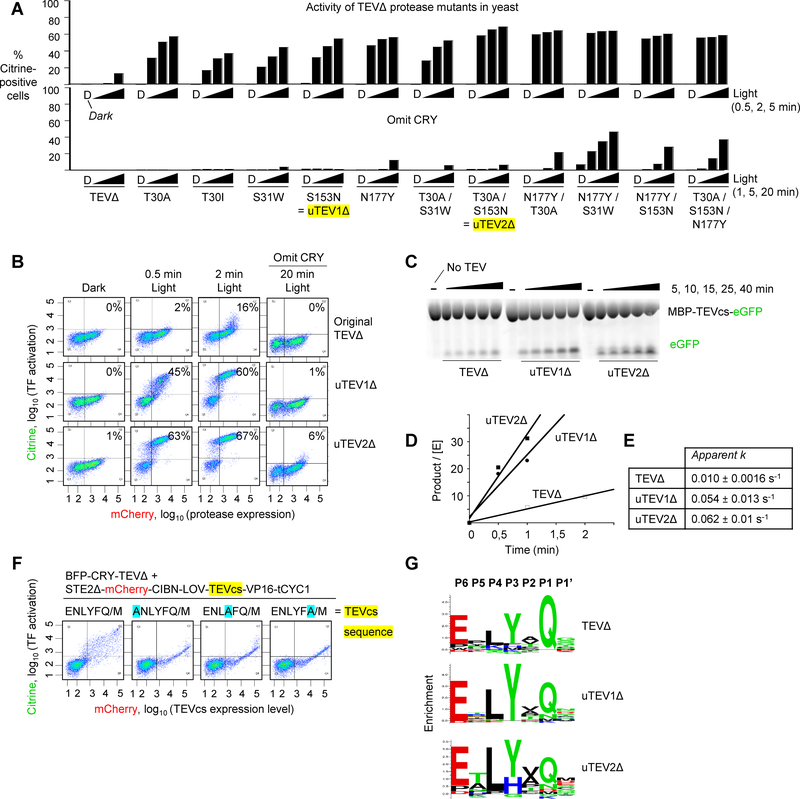
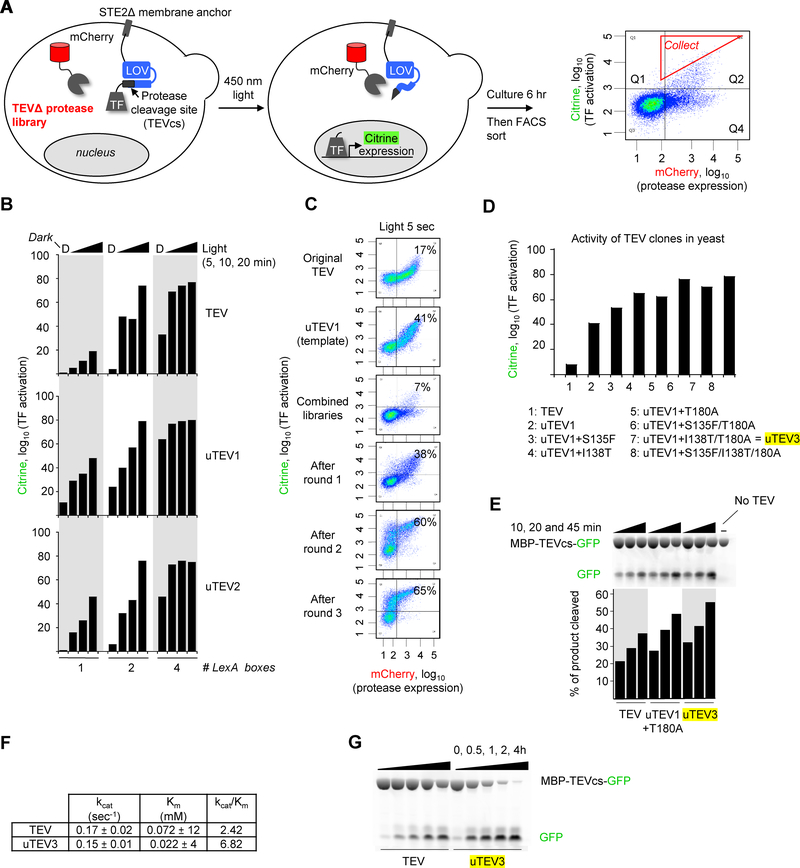
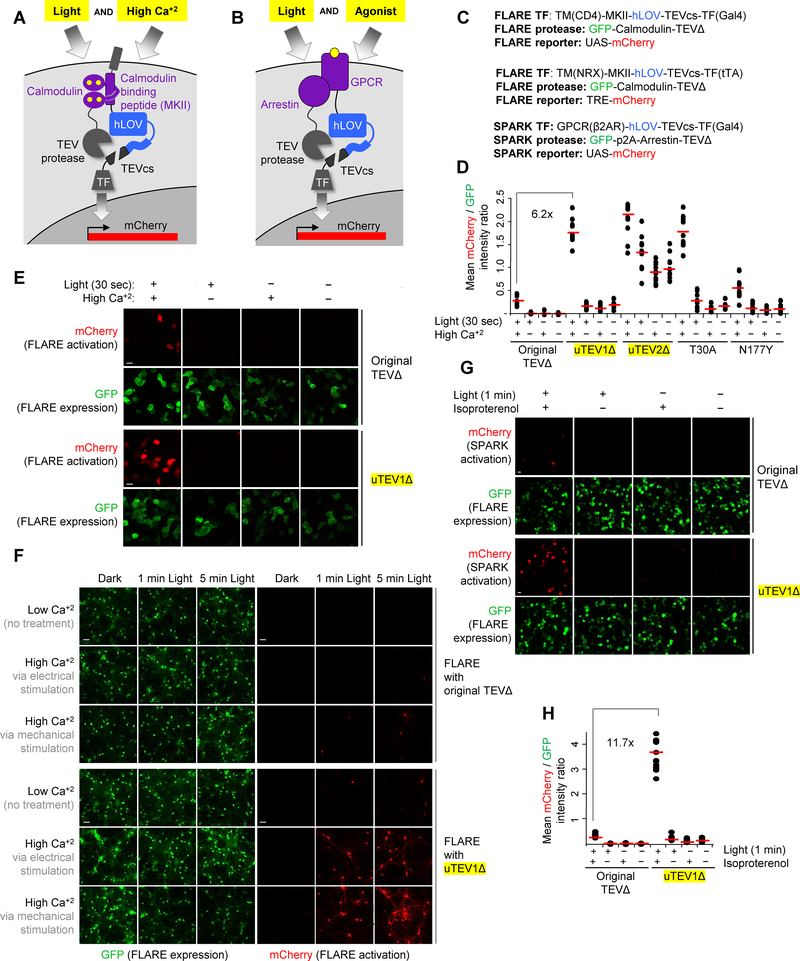
Tobacco etch virus protease (TEV) is one of the most widely used proteases in biotechnology because of its exquisite sequence specificity. A limitation, however, is its slow catalytic rate. We developed a generalizable yeast-based platform for directed evolution of protease catalytic properties. Protease activity is read out via proteolytic release of a membrane-anchored transcription factor, and we temporally regulate access to TEV's cleavage substrate using a photosensory LOV domain. By gradually decreasing light exposure time, we enriched faster variants of TEV over multiple rounds of selection. Our TEV-S153N mutant (uTEV1Δ), when incorporated into the calcium integrator FLARE, improved the signal/background ratio by 27-fold, and enabled recording of neuronal activity in culture with 60-s temporal resolution. Given the widespread use of TEV in biotechnology, both our evolved TEV mutants and the directed-evolution platform used to generate them could be beneficial across a wide range of applications.


Conflict of interest statement

COMPETING INTEREST

A.Y.T. and M.I.S have filed a patent application covering some aspects of this work.

Figures

Figure 1:
Figure 1:
Yeast platform for directed evolution of high-turnover, low-affinity proteases A. Schematic of evolution platform in the yeast cytosol. A library of truncated TEV protease (TEVΔ) variants is fused to CRY and mCherry. A transcription factor (TF) is tethered to the plasma membrane via a TEV cleavage site (TEVcs), a LOV domain, and CIBN. Upon exposure of cells to blue 450 nm light, the CRY-CIBN interaction brings the TEV protease into proximity of TEVcs, and the LOV domain changes conformation to expose TEVcs. Proteolysis releases the TF, which translocates to the nucleus and drives expression of the reporter gene Citrine. Selection stringency can be increased by reducing the irradiation time (allowing less time for TEV-catalyzed TF release). B. FACS analysis of yeast library 6 hours after 8-minute blue light exposure. A subpopulation of cells display Citrine fluorescence above background, indicating that they contain active TEV. mCherry is used to read out protease expression levels. The red gate was used to collect cells with the highest Citrine/mCherry intensity ratios. C. Optimization of membrane-anchored transcription factor component of the evolution platform. For each construct, FACS analysis was performed as shown in (B), 6 hours after 45-minute blue light exposure. Controls are shown with light omitted (columns 2 and 4) or CRY omitted (columns 3–4). Table values reflect the fraction of cells with high Citrine intensity, i.e., cells in the upper FACS quadrants Q1 and Q2 (quadrants are defined in (B)). D. FACS plots corresponding to the last row of the table in (C). All other FACS plots are shown in Supplementary Figure 1B. This experiment was performed twice with similar results. E. Citrine signal scales with light irradiation time. As the 450 nm light exposure time is increased from 0 min to 25 min, the resulting Citrine expression 6 hours later increases. Values in each plot reflect the percentage of cells within the red polygonal gate shown. This experiment was performed twice with similar results. F. FACS plots summarizing the progress of the selections. Re-amplified yeast pools were analyzed side by side under the three conditions shown (three columns). Values reflect the fraction of Citrine-positive cells, i.e. cells in upper quadrants Q1 and Q2. Additional FACS plots and summary graph in Supplementary Figure 2A. This experiment was performed once. G. Mutations enriched by the evolution, highlighted on a ribbon structure of wild-type TEV protease (PDB: 1LVM [24]) in complex with its peptide substrate (in dark blue). uTEV1Δ contains the mutation S153N, while uTEV2Δ has both S153N and T30A mutations. From our high-affinity TEV evolution (Figure 3), we also enriched the mutations I138T and T180A. (uTEV3 has three mutations: I138T, S153N, and T180A). The N177Y mutation is also highlighted because it arose during selections, although we rejected it because it increases affinity for TEVcs.
Figure 2:
Figure 2:
Characterization of evolved low-affinity proteases (uTEV1Δ and uTEV2Δ) in yeast and in vitro. A Comparison of evolved single, double, and triple TEVΔ mutants in yeast, with CRY present (top) or omitted (bottom; to test proximity-dependence of cleavage). Experiment was performed as in Figure 1A and FACS plots were quantified as in Figure 1C. For each clone, three irradiation times were tested (0.5, 2, and 5 min) in addition to the dark state (D). The two clones with the highest proximity-dependent activity are highlighted yellow. Additional timepoints and FACS plots shown in Supplementary Figure 3. B FACS plots for the two best clones in (A). Percentages show the fraction of Citrine-positive cells in Q1 + Q2. C Fluorescent gel measuring the kinetics of purified TEV proteases. The substrate protein MBP-TEVcs-GFP was incubated with the indicated TEV mutants (MBP = maltose binding protein; TEVcs = ENLYFQ/M). At various timepoints, the reaction was quenched, run on SDS-PAGE, and visualized by in-gel fluorescence. [MBP-TEVcs-GFP] was 360 μM and all proteases were at 750 nM. This experiment was performed independently three times with similar results. D Quantitation of protease reaction rates, using the fluorescent gel assay in (C). E Apparent rate constants based on initial velocity measurements in (D). Due to protein solubility limits, the maximum concentration of TEVcs was 360 μM (much lower than the expected Km). Therefore, the values likely represent lower bounds to the actual kcat. Three technical replicates were performed per condition. F Profiling protease sequence-specificity in yeast. Setup was the same as in Figure 1A, except the TEVcs sequence is randomized, and mCherry is fused to TEVcs rather than to TEV in order to quantify TEVcs expression level (schematic in Supplementary Figure 5A). The FACS plots show the cleavage extent for various TEVcs test substrates, 6 hours after 30-minute blue light irradiation. Forward slash indicates proteolysis site. Mutations at the −6, −3, and −1 positions of TEVcs greatly reduce cleavage by wild-type TEVΔ. This experiment was performed once. G Sequence specificity profiles of wild-type TEVΔ, uTEV1Δ, and uTEV2Δ obtained via sequencing of FACS-enriched TEVcs libraries (seven TEVcs libraries for each protease variant). FACS plots and sequencing data in Supplementary Figure 5C.
Figure 3:
Figure 3:
Yeast platform applied to the evolution of high-affinity proteases A. Selection scheme in yeast cytosol. A library of full-length TEV variants is expressed as a fusion to mCherry. The transcription factor (TF) is anchored to the plasma membrane via a protease-sensitive linker. FACS is used to enrich cells with high Citrine/mCherry intensity ratios. On the right is a FACS plot from the first round of evolution. The red gate shows the cells with high Citrine/mCherry intensity ratio that were collected by FACS. B. Tuning dynamic range of the evolution platform. By varying the number of LexA boxes in the promoter recognized by the LexA-VP16 TF, we modulated the sensitivity of the Citrine readout. More LexA boxes resulted in higher sensitivity, i.e., higher Citrine expression in response to short light exposure times. Corresponding FACS data is in Supplementary Figures 6. C. Results of selection. Selection was performed using the high-affinity TEVcs ENLYFQ/S. Percentages show fraction of Citrine-positive cells in Q1+Q2. Additional FACS plots and conditions are in Supplementary Figure 7A. D. Analysis of individual clones enriched by the selection. Activities were quantified in yeast by Citrine expression level, as in Figure 1F. Additional characterization in yeast in Supplementary Figure 8. E. Fluorescent gel assay measuring the kinetics of purified proteases. The protein substrate MBP-TEVcs-GFP (72 kDa, 28 μM, TEVcs = ENLYFQ/S) was incubated with the indicated proteases (all full-length, 125 nM) for 10, 20, or 45 min before SDS-PAGE and in-gel fluorescence detection of GFP. This experiment was performed once. F. Kinetic parameters for wild-type TEV and uTEV3 (containing the mutations I138T, S153N, and T180A), obtained via the fluorescence gel assay shown in (E). The MBP-TEVcs-GFP substrate concentration was varied from 7.5 to 320 μM to obtain the Km. Michaelis-Menten plots are in Supplementary Figure 4. Three technical replicates were performed per condition. G. uTEV3 is more efficient than wild-type TEV for affinity tag removal. MBP-TEVcs-GFP (72 kDa, 10 μM, TEVcs = ENLYFQ/S) was incubated with wild-type TEV or uTEV3 for 0–4 h. The product was analyzed by SDS-PAGE and in-gel fluorescence. This experiment was performed independently two times with similar results.
Figure 4:
Figure 4:
Characterization of evolved low-affinity TEVΔ proteases in mammalian cells and incorporation into FLARE and SPARK tools. A FLARE tool used to integrate cytosolic calcium activity. FLARE is a coincidence detector of blue light and high calcium, with gene expression as the readout [8]. High calcium drives intermolecular complexation between calmodulin and its binding peptide (MKII), which brings TEVΔ protease close to its peptide substrate TEVcs. Blue light is also required to uncage TEVcs. Released TF translocates to the nucleus and drives mCherry expression. B SPARK tool used to integrate GPCR activity. SPARK is a coincidence detector of light and GPCR activity, with gene expression as the readout. Activated GPCR recruits the effector beta-arrestin, which brings TEVΔ protease close to its peptide substrate TEVcs. Blue light is also required to uncage TEVcs. Released TF translocates to the nucleus and drives mCherry expression. C Genetic constructs used for FLARE and SPARK experiments. The first and third set are for HEK293T cells and the second set is for expression in neurons. hLOV is an improved LOV domain described in [11]. p2A is a self-cleaving peptide [36]. D Testing protease mutants using FLARE in HEK293T cells. The indicated protease was incorporated into FLARE as shown in (A) and (C). After transient transfection into HEK293T cells, cells were stimulated with 5 mM CaCl2 and ionomycin for 30 sec in the presence or absence of blue light. Eight hours later, mCherry was imaged. Dots indicate quantification of mCherry intensity relative to GFP signal across 10 fields of view per condition (n=10). Red lines indicates the mean of 10 FOVs (Supplementary Figure 11). For uTEV1Δ, the light/dark signal ratio is 15, and the high/low Ca+2 signal ratio is 12. This experiment was performed two times with similar results. E Sample confocal fluorescence images from the first 8 columns in (D). mCherry reflects FLARE turn-on. GFP reflects expression level of the FLARE tool (protease component). Scale bar, 20 μm. This experiment was performed independently three times with similar results. F uTEV1Δ improves FLARE performance in cultured neurons. Rat cortical neurons were transduced on day 12 with FLARE AAV1/2 viruses. 6 days later (at DIV18), we stimulated the neurons either electrically (3-s trains consisting of 32 1-ms 50 mA pulses at 20 Hz for a total of 1 or 5 min) or mechanically (via replacement of spent media with fresh media of identical composition). The light source was 467 nm, 60 mW/cm2, 10% duty cycle (0.5s light every 5s). 18 hours later, cells were imaged by confocal microscopy (Supplementary Figure 12). This experiment was replicated three times. G uTEV1Δ improves SPARK performance in HEK293T cells. SPARK constructs as shown in (C) containing either wild-type TEVΔ or uTEV1Δ were transiently expressed in HEK, and cells were stimulated with 10 μM isoproterenol for 1 min in the presence or absence of blue light. Nine hours later, mCherry was imaged. GFP reflects SPARK expression level. Scale bar, 10 μm. H Quantification of experiment in (G), Dots indicate quantification of mCherry intensity relative to GFP signal across 10 fields of view per condition (n=10). Red lines indicates the mean of 10 FOVs (Supplementary Figure 13). For uTEV1Δ, light/dark signal ratio is 22.1, and the +/−agonist signal ratio is 20.7. This experiment was performed two times with similar results.

References

    1. Liu Q et al. A Photoactivatable Botulinum Neurotoxin for Inducible Control of Neurotransmission. Neuron (2019). doi:10.1016/j.neuron.2019.01.002 - DOI - PMC - PubMed
    1. Smart AD et al. Engineering a light-activated caspase-3 for precise ablation of neurons in vivo. Proc. Natl. Acad. Sci. U. S. A 114, E8174–E8183 (2017). - PMC - PubMed
    1. Lin MZ, Glenn JS & Tsien RY A drug-controllable tag for visualizing newly synthesized proteins in cells and whole animals. Proc. Natl. Acad. Sci 105, 7744–7749 (2008). - PMC - PubMed
    1. Schuster BS et al. Controllable protein phase separation and modular recruitment to form responsive membraneless organelles. Nat. Commun 9, 2985 (2018). - PMC - PubMed
    1. Gao XJ, Chong LS, Kim MS & Elowitz MB Programmable protein circuits in living cells. Science 361, 1252–1258 (2018). - PMC - PubMed

Publication types