. 2020 Feb 3;217(2):e20180649.
doi: 10.1084/jem.20180649.

Loss of IL-10 signaling in macrophages limits bacterial killing driven by prostaglandin E2

Affiliations

Loss of IL-10 signaling in macrophages limits bacterial killing driven by prostaglandin E2

Subhankar Mukhopadhyay et al. J Exp Med. .

Abstract

Loss of IL-10 signaling in macrophages (Mφs) leads to inflammatory bowel disease (IBD). Induced pluripotent stem cells (iPSCs) were generated from an infantile-onset IBD patient lacking a functional IL10RB gene. Mφs differentiated from IL-10RB-/- iPSCs lacked IL-10RB mRNA expression, were unable to phosphorylate STAT3, and failed to reduce LPS induced inflammatory cytokines in the presence of exogenous IL-10. IL-10RB-/- Mφs exhibited a striking defect in their ability to kill Salmonella enterica serovar Typhimurium, which was rescuable after experimentally introducing functional copies of the IL10RB gene. Genes involved in synthesis and receptor pathways for eicosanoid prostaglandin E2 (PGE2) were more highly induced in IL-10RB-/- Mφs, and these Mφs produced higher amounts of PGE2 after LPS stimulation compared with controls. Furthermore, pharmacological inhibition of PGE2 synthesis and PGE2 receptor blockade enhanced bacterial killing in Mφs. These results identify a regulatory interaction between IL-10 and PGE2, dysregulation of which may drive aberrant Mφ activation and impaired host defense contributing to IBD pathogenesis.


Figures

Figure 1.
Figure 1.
IL-10RB−/− Mφs develop normally and exhibit a normal transcriptional signature. Mφs were differentiated from IL-10RB−/− (n = 3) and control iPSCs (n = 4). (A) Surface expression of CD14, CD16, and CD206 were assessed by flow cytometry. Representative histograms from three independent experiments show surface expression of antigen in control fpdj_3 (upper panel) and IL-10RB−/− (lower panel) Mφs. Blue lines indicate specific antibody staining, and red lines indicate staining by isotype-matched controls. (B) Average log2FPKM values for all expressed genes in IL-10RB−/− (n = 3) and control Mφs (n = 4) were evaluated by RNASeq and are presented in a scatter plot. (C) Relative mRNA expression of selected Mφ surface markers (CD68 and CSF1R) and transcription factors (MAFB and SPI1) in unstimulated WT (n = 4) and IL-10RB−/− (n = 3) Mφs are reported as normalized log2TPM values. (D) Genes that are significantly induced (red) or repressed (blue) after 6-h LPS stimulation in both WT (n = 4) and IL-10RB−/− (n = 3) Mφs are presented. Genes that show significantly different expression between control and IL-10RB−/− Mφs after LPS stimulation are shown in black. (E) Relative mRNA expression of selected known LPS-responsive costimulatory molecules (CD40 and CD80) and chemokine genes (CXCL2 and CXCL3) were compared between WT (n = 4) and IL-10RB−/− (n = 3) Mφs after LPS stimulation, and normalized log2TPM values are presented. Statistical significance in B–D was based on FDR <0.05 and fold-change >2. FPKM, fragment per kilobase million.
Figure S1.
Figure S1.
Patient-derived IL-10RB−/− iPSCs differentiate normally into three germ layers. IL-10RB−/− iPSCs were either maintained in pluripotency media or cultured in specific differentiation media promoting differentiation into three germ layers: endoderm, mesoderm, and neuroectoderm. Cells were stained with specific antibodies against markers for pluripotency (Nanog, Oct4, and SOX2), mesoderm (Brachyury, EOMES, MIXL1), neuroectoderm (Nestin, SOX1, and SOX2), and endoderm (SOX17, CXCR4, and GATA4) and costained with nuclear dye DAPI (not shown). The expression level of each antigen was analyzed in a Cellomics array scan; the scale bar (2 mm = 150 µm) is the same for all panels. Representative images showing immunofluorescense staining for each marker are shown in green. The percentage of positive cells for each antigen is shown in the corresponding bar diagram. Corresponding bar diagram represents percentage of positive cells for each antigen. Data are shown from at least triplicate wells are presented as means ± SD and are representative of at least two independent experiments.
Figure 2.
Figure 2.
IL-10RB−/− Mφs are unresponsive to IL-10. (A) RNASeq read depth across the IL-10RB gene body plotted for control fpdj_3 (blue) and IL-10RB−/− (red) Mφs (left panel), with IL10RB gene structure in the panel beneath each plot. The black box indicates the read count from exon 3. The right panel shows normalized read counts of each of the exons of the IL-10RB gene in WT (n = 4) and IL-10RB−/− (n = 3) Mφs. (B) The relative expressions of IL-10RA and IL-10RB mRNA were compared between WT (n = 3) and IL-10RB−/− (n = 3) Mφs and monocyte-derived Mφs (MDMs; n = 3) using gene-specific Taqman RT-qPCR probes. (C) IL-10RB−/− and control fpdj_3 Mφs were stimulated with 20 ng/ml of rhIL-10 or IL-6 for 15 min, and expression of phospho-STAT3 (pY705) was measured by flow cytometry after staining with a specific antibody. (D) IL-6 and TNF-α levels were measured by ELISA in supernatants of IL-10RB−/− and control kolf_2 Mφs (n = 3) prestimulated overnight with 20 ng/ml rhIL-10 or left unstimulated and then challenged with 2 ng/ml LPS for 6 h in the presence of IL-10. Data in all panels are representative of at least three independent experiments. Data in B and D are reported as means ± SD of at least triplicate wells of each condition. Two-way ANOVA with Tukey’s multiple comparisons test was used to assess statistical significance. ***, P < 0.001.
Figure S2.
Figure S2.
Cytokine production under IL-10 stimulation and S. Typhimurium infection. IL-6, IL-8, TNF-α, and IL-10 levels were measured in the supernatants of IL-10RB−/− (n = 3) and control kolf_2 Mφs (n = 3) prestimulated overnight with 20 ng/ml rhIL-10 or left unstimulated and then infected with S. Typhimurium (MOI 1) in the presence or absence of IL-10; after 1 h of incubation, cells were washed three times with PBS to remove extracellular bacteria, and fresh medium without antibiotics was added (IL-10 was kept in appropriate wells). After incubation at the indicated time points, 25 µl of medium was harvested and stored at −80°C for cytokine analysis and replaced with the same volume of medium for the subsequent time points. Concentrations of indicated cytokines in harvested supernatants were analyzed by a Luminex assay kit according to the manufacturer’s instructions. Data shown in all panels are from at least triplicate wells, are presented as means ± SD, and are representative of at least three independent experiments. Two-way ANOVA with Tukey’s multiple comparisons test was performed using GraphPad software to assess statistical significance. ***, P < 0.001; **, P < 0.01.
Figure 3.
Figure 3.
Loss of IL-10 signaling impairs S. Typhimurium killing in Mφs. (A) Bacterial survival measured by gentamicin protection assay and reported as CFU/ml in kolf_2 and IL-10RB−/− Mφs (n = 4) prestimulated with 20 ng/ml rhIL-10 or left unstimulated and infected with 10 MOI of S. Typhimurium SL1344 (pssaG:GFP); survival was measured at 5 h. (B) The time course of S. Typhimurium survival within kolf_2 and IL-10RB−/− Mφs (n = 4) in the presence or absence of IL-10 is shown. (C) A comparison of survival of S. Typhimurium between IL-10RA−/− and control kolf_2 Mφs in the presence or absence of IL-10 is presented at 5 h. (D) Comparison of S. Typhimurium survival/replication between IL-10RB−/− and IL-10RBcomp Mφs (n = 4). Data shown in all panels are from quadruplicate wells, are presented as means ± SD, and are representative of at least three independent experiments. Two-way ANOVA with Tukey’s multiple comparisons test was performed using GraphPad software to assess statistical significance. ***, P < 0.001.
Figure S3.
Figure S3.
IL-10 signaling blockade leads to reduced bacterial killing in Mφs. (A) Bacterial survival measured by gentamicin protection assay and reported as CFU/ml in fpdj_3 and IL-10RB−/− Mφs (n = 4) prestimulated with 20 ng/ml rhIL-10 or left unstimulated and infected with 10 MOI of S. Typhimurium SL1344 (pssaG:GFP); survival was measured at 5 h. (B) Time course of S. Typhimurium survival within fpdj_3 and IL-10RB−/− Mφs (n = 4) in the presence or absence of IL-10 is shown. (C) The survival of S. Typhimurium within fpdj_3 control Mφs in the presence or absence of blocking antibodies against IL-10, IL-10RA, and IL-10RB (n = 4) is presented as bar diagrams. (D and E) Initial uptake of S. Typhimurium between WT control kolf_2 Mφs and IL-10RA−/− Mφs (n = 4; D) and between IL-10RB−/− and IL-10RBcomp Mφs (n = 4; E) were compared at 1-h incubation with bacteria before adding gentamicin. Data shown in all panels are from at least quadruplicate wells, are presented as means ± SD, and are representative of at least three independent experiments. Two-way ANOVA with Tukey’s multiple comparisons test was performed using GraphPad software to assess statistical significance. ***, P < 0.001.
Figure S4.
Figure S4.
Experimental deletion of IL-10RA leads to an IL-10 unresponsive phenotype, and genetic complementation of IL-10RB−/− rescues the IL-10 unresponsive phenotype. (A) IL-6 and TNF-α levels were measured by ELISA in supernatants of IL-10RA−/− and control kolf_2 Mφs (n = 3) prestimulated overnight with 20 ng/ml rhIL-10 or left unstimulated and then challenged with 2 ng/ml LPS for 6 h in the presence of IL-10. (B) IL-6 and TNF-α levels were measured by ELISA in supernatants of IL-10RB−/− and IL-10RBcomp Mφs (n = 3) prestimulated overnight with 20 ng/ml rhIL-10 or left unstimulated and then challenged with 2 ng/ml LPS for 6 h in the presence of IL-10. Data shown in all panels are from at least triplicate wells, are presented as means ± SD, and are representative of at least three independent experiments. Two-way ANOVA with Tukey’s multiple comparisons test was performed using GraphPad software to assess statistical significance. ***, P < 0.001.
Figure 4.
Figure 4.
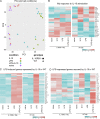
IL-10 selectively inhibits the LPS-mediated transcriptional response in Mφs. (A) PC analysis (PCA) was performed on all expressed genes in control Mφs (n = 4) and IL-10RB−/− Mφs (n = 3) stimulated with either 20 ng/ml rhIL-10 (overnight) or 2 ng/ml LPS for 6 h, or IL-10 prestimulation followed by a 6-h LPS stimulation (in the presence of IL-10). (B) Heat maps showing average gene expression levels of ∼25 genes significantly deregulated after IL-10 stimulation in control Mφs (n = 4) but not regulated in IL-10RB−/− Mφs (n = 3; Table S3). (C) Heat maps showing expression levels of selected LPS-induced genes that are down-regulated in the IL-10 plus LPS condition in control Mφs but remained unchanged in IL-10RB−/− Mφs (IL-10–repressed genes). (D) Heat maps showing expression levels of selected LPS-repressed genes whose expression was significantly reversed in IL-10 plus LPS treatment in control Mφs but not in IL-10RB−/− Mφs (IL-10–rescued genes). Only the top most significant genes are presented in C and D (full lists of affected genes are presented in Tables S4 and S5, respectively). Statistical significance in B–D was based on FDR <0.05 and fold-change >2.
Figure S5.
Figure S5.
Pathways and transcription factor enrichment analyses of LPS-responsive genes. Differentially expressed genes between unstimulated and LPS-stimulated conditions were calculated from the average gene expression values from IL-10RB−/− (n = 3) and control Mφs (n = 4) using DESeq analysis, based on FDR <0.05 and fold-change >2. (A) Pathway enrichment analysis, transcription factor (TF) target gene enrichment analysis, and Gene Ontology term enrichment analysis were performed using corresponding InnateDB analysis tools on all genes that were significantly up-regulated after LPS treatment. The top 15 terms for each analysis are shown based on the P value ranking. (B) The same enrichment analysis performed on all genes significantly down-regulated after LPS stimulation in both Mφs and the top 15 terms for each analysis are shown based on the P value ranking. (C) Pathway enrichment analysis and transcription factor target gene enrichment analysis performed on LPS-inducible genes that are significantly repressed in the IL-10 plus LPS condition. (D) Pathway enrichment analysis and transcription factor target gene enrichment analysis on LPS down-regulated genes that are rescued in the IL-10 plus LPS treatment condition in control Mφs but not in IL-10RB−/− Mφs using the same criteria.
Figure 5.
Figure 5.
Overlap between IL-10–regulated genes and IBD GWAS candidate genes. (A) Venn diagram between IL-10–regulated genes (red; includes genes deregulated by IL-10 treatment alone and IL-10–repressed/rescued genes in LPS-stimulated WT control Mφs but unchanged in IL-10RB−/− Mφs) and all the previously described prioritized gene candidates identified in IBD GWAS (green). (B) Number of IBD GWAS risk loci containing genes up-regulated in various treatment conditions (solid black circles), in comparison to null distributions generated from gene lists matched for Mφ expression level and gene length (represented by diamonds showing the region where 95% of null simulations fall). DE, differentially expressed. (C) The 21 overlapping genes identified in A were used as input for a network analysis in InnateDB with default settings to identify all the genes that are functionally connected with these 21 (not shown). In this larger network, all genes that are significantly deregulated in control Mφs after combined IL-10 plus LPS stimulation relative to LPS stimulation were identified and represented as a subnetwork using the Cytoscape visualization tool. The red and blue colors represent up- and down-regulation, respectively, of genes after combined IL-10 plus LPS treatment compared with LPS stimulation alone. The increase in intensity for each color represents relative levels of up- or down-regulation compared with LPS stimulation alone. The input IBD candidate genes are shown as diamonds, and their network connections are shown as circles.
Figure 6.
Figure 6.
Loss of IL-10 signaling leads to overexpression of genes involved in the PGE2 pathway. (A) A simplified schematic diagram of the arachidonic acid pathway from the Kyoto Encyclopedia of Genes and Genomes database showing key steps in the generation of different classes of eicosanoids with a specific focus on the PGE2 synthesis pathway and its receptors. (B) Heat map showing average expression values of genes involved in PGE2 synthesis and its receptors (lower panel) and key rate-limiting genes involved in the synthesis of other eicosanoids (upper panel) in IL-10RB−/− (n = 3) and control Mφs (n = 4) after different treatments. (C) Relative mRNA expression for genes involved in PGE2 synthesis (PTGS2 and PTGES) and PGE2 receptors (PTGER2 and PTGER4) between IL-10RA−/− Mφs and isogenic control kolf_2 Mφs with or without LPS stimulation analyzed by RT-qPCR. Data from at least triplicate wells of each condition are presented as means ± SD and are representative of at least three independent experiments. Two-way ANOVA with Tukey’s multiple comparisons test was used to assess statistical significance. *, P < 0.05; **, P < 0.01; ***, P < 0.001.
Figure 7.
Figure 7.
Excessive PGE2 production limits antimicrobial capacity of IL-10RB−/− Mφs. (A) PGE2 levels measured by ELISA in supernatants from IL-10RB−/− and control kolf_2 Mφs (n = 4) prestimulated overnight with 20 ng/ml rhIL-10 or unstimulated (Unstim) and further stimulated with 2 ng/ml LPS for 6 h in the presence or absence of IL-10 as appropriate. (B and C) Bacterial survival measured at a 5-h time point by gentamicin protection assay and reported as CFU × 103/ml in IL-10RA−/− Mφs (n = 4) compared with isogenic control kolf_2 Mφs (n = 4; B) and in IL-10RBcomp Mφs (n = 4) compared with IL-10RB−/− Mφs (n = 4; C) prestimulated for 2 h with COX2 inhibitors aspirin (10 µM) or indomethacin (10 µM) or left unstimulated and then infected with 10 MOI of S. Typhimurium SL1344 (pssaG:GFP) in the presence or absence of COX2 inhibitors. (D and E) Bacterial survival as in B and C in IL-10RA−/− Mφs (n = 4) compared with isogenic control kolf_2 Mφs (n = 4; D) and in IL-10RBcomp Mφs (n = 4) compared with IL-10RB−/− Mφs (n = 4; E) stimulated with 20 nM EP2, EP4, and EP2 plus EP4 antagonists or left unstimulated. In these experiments, inhibitors were added after initial bacterial uptake. Data shown in all panels are from at least quadruplicate wells, are presented as means ± SD, and are representative of at least three independent experiments. Two-way ANOVA with Tukey’s multiple comparisons test was performed using GraphPad software to assess statistical significance. ***, P < 0.001; *, P < 0.05.

Similar articles

Cited by

References

    1. Agard M., Asakrah S., and Morici L.A.. 2013. PGE(2) suppression of innate immunity during mucosal bacterial infection. Front. Cell. Infect. Microbiol. 3:45 10.3389/fcimb.2013.00045 - DOI - PMC - PubMed
    1. Agu C.A., Soares F.A., Alderton A., Patel M., Ansari R., Patel S., Forrest S., Yang F., Lineham J., Vallier L., and Kirton C.M.. 2015. Successful generation of human induced pluripotent stem cell lines from blood samples held at room temperature for up to 48 hr. Stem Cell Reports. 5:660–671. 10.1016/j.stemcr.2015.08.012 - DOI - PMC - PubMed
    1. Alasoo K., Martinez F.O., Hale C., Gordon S., Powrie F., Dougan G., Mukhopadhyay S., and Gaffney D.J.. 2015. Transcriptional profiling of macrophages derived from monocytes and iPS cells identifies a conserved response to LPS and novel alternative transcription. Sci. Rep. 5:12524 10.1038/srep12524 - DOI - PMC - PubMed
    1. Alvarez Y., Municio C., Alonso S., Sánchez Crespo M., and Fernández N.. 2009. The induction of IL-10 by zymosan in dendritic cells depends on CREB activation by the coactivators CREB-binding protein and TORC2 and autocrine PGE2. J. Immunol. 183:1471–1479. 10.4049/jimmunol.0900312 - DOI - PubMed
    1. Arai Y., Arihiro S., Matsuura T., Kato T., Matsuoka M., Saruta M., Mitsunaga M., Matsuura M., Fujiwara M., Okayasu I., et al. . 2014. Prostaglandin E-major urinary metabolite as a reliable surrogate marker for mucosal inflammation in ulcerative colitis. Inflamm. Bowel Dis. 20:1208–1216. 10.1097/MIB.0000000000000062 - DOI - PubMed

Publication types

MeSH terms