

Pretreatment HIV drug resistance spread within transmission clusters in Mexico City
- PMID: 31819984
- PMCID: PMC7021100
- DOI: 10.1093/jac/dkz502
Pretreatment HIV drug resistance spread within transmission clusters in Mexico City
Abstract
Background: Pretreatment HIV drug resistance (HIVDR) to NNRTIs has consistently increased in Mexico City during the last decade.
Objectives: To infer the HIV genetic transmission network in Mexico City to describe the dynamics of the local HIV epidemic and spread of HIVDR.
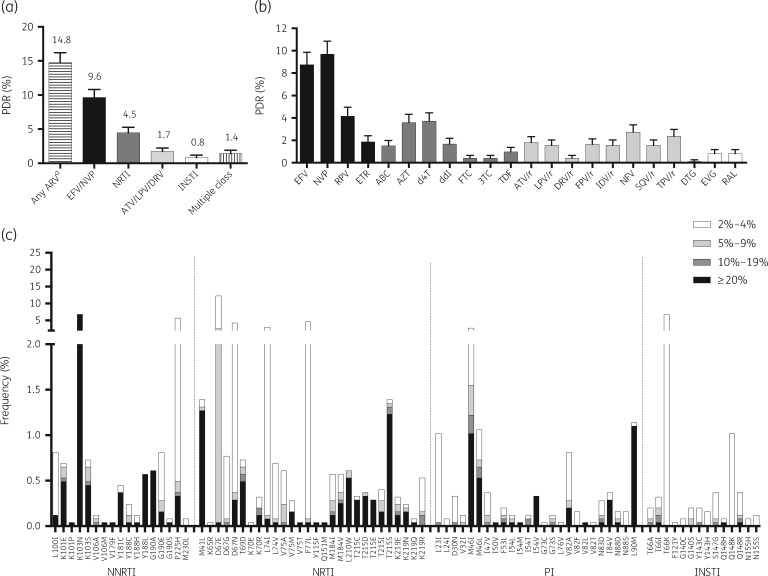
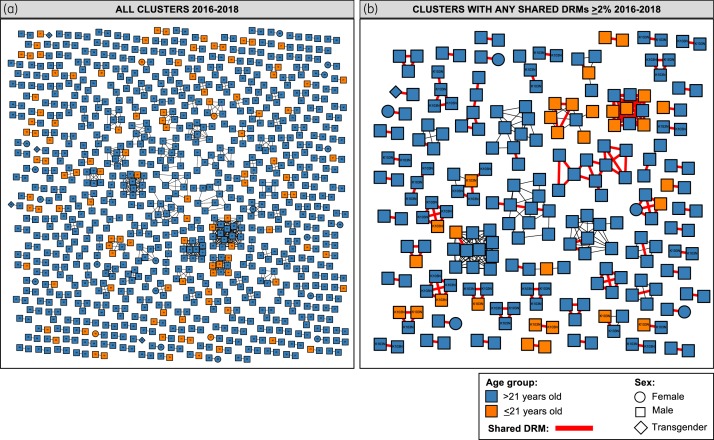
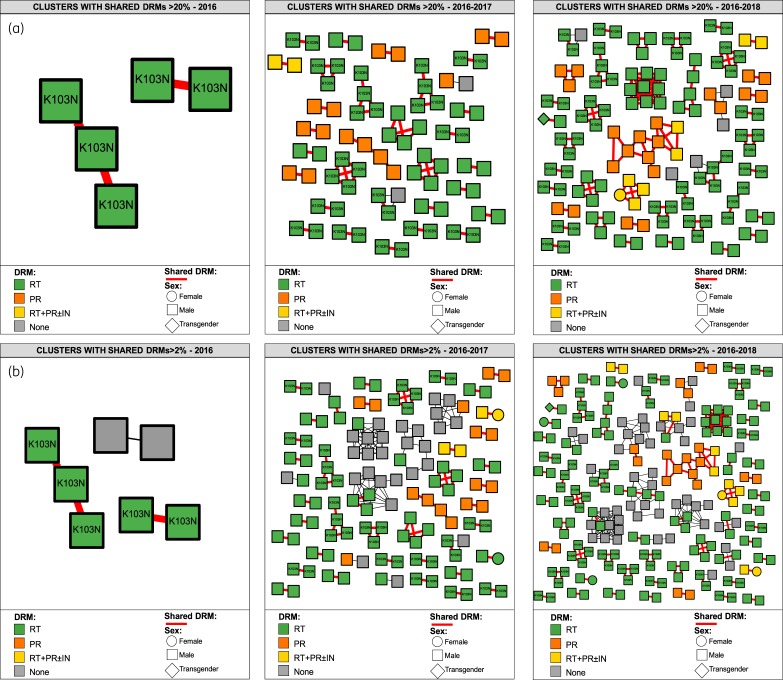
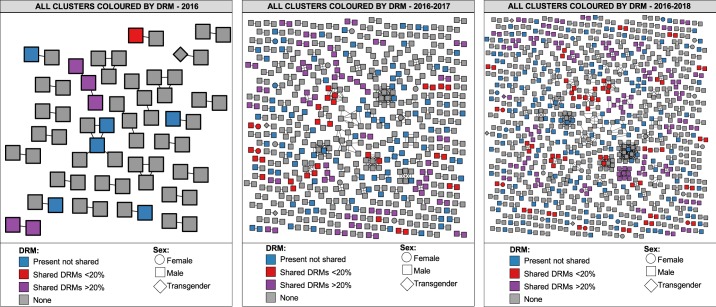
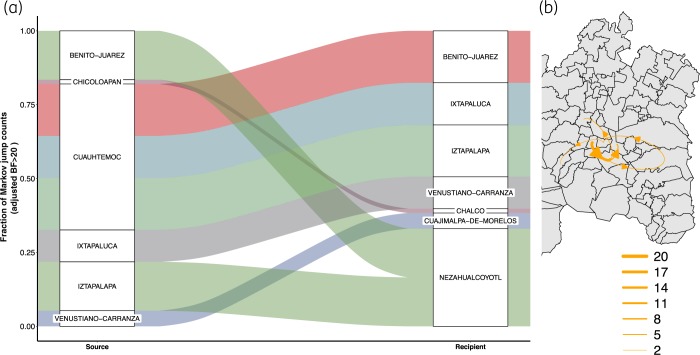
Patients and methods: HIV pol sequences were obtained by next-generation sequencing from 2447 individuals before initiation of ART at the largest HIV clinic in Mexico City (April 2016 to June 2018). Pretreatment HIVDR was estimated using the Stanford algorithm at a Sanger-like threshold (≥20%). Genetic networks were inferred with HIV-TRACE, establishing putative transmission links with genetic distances <1.5%. We examined demographic associations among linked individuals with shared drug resistance mutations (DRMs) using a ≥ 2% threshold to include low-frequency variants.
Results: Pretreatment HIVDR reached 14.8% (95% CI 13.4%-16.2%) in the cohort overall and 9.6% (8.5%-10.8%) to NNRTIs. Putative links with at least one other sequence were found for 963/2447 (39%) sequences, forming 326 clusters (2-20 individuals). The inferred network was assortative by age and municipality (P < 0.001). Clustering individuals were younger [adjusted OR (aOR) per year = 0.96, 95% CI 0.95-0.97, P < 0.001] and less likely to include women (aOR = 0.46, 95% CI 0.28-0.75, P = 0.002). Among clustering individuals, 175/963 (18%) shared DRMs (involving 66 clusters), of which 66/175 (38%) shared K103N/S (24 clusters). Eight municipalities (out of 75) harboured 65% of persons sharing DRMs. Among all persons sharing DRMs, those sharing K103N were younger (aOR = 0.93, 95% CI 0.88-0.98, P = 0.003).
Conclusions: Our analyses suggest age- and geographically associated transmission of DRMs within the HIV genetic network in Mexico City, warranting continuous monitoring and focused interventions.
© The Author(s) 2019. Published by Oxford University Press on behalf of the British Society for Antimicrobial Chemotherapy.
Figures
Similar articles
-
Characteristics and growth of the genetic HIV transmission network of Mexico City during 2020.J Int AIDS Soc. 2021 Nov;24(11):e25836. doi: 10.1002/jia2.25836. J Int AIDS Soc. 2021. PMID: 34762774 Free PMC article.
-
HIV-1 drug resistance before initiation or re-initiation of first-line ART in eight regions of Mexico: a sub-nationally representative survey.J Antimicrob Chemother. 2019 Apr 1;74(4):1044-1055. doi: 10.1093/jac/dky512. J Antimicrob Chemother. 2019. PMID: 30597094 Free PMC article.
-
Protease and gag diversity and drug resistance mutations among treatment-naive Mexican people living with HIV.BMC Infect Dis. 2022 May 10;22(1):447. doi: 10.1186/s12879-022-07446-8. BMC Infect Dis. 2022. PMID: 35538426 Free PMC article.
-
Pretreatment HIV-drug resistance in Mexico and its impact on the effectiveness of first-line antiretroviral therapy: a nationally representative 2015 WHO survey.Lancet HIV. 2016 Dec;3(12):e579-e591. doi: 10.1016/S2352-3018(16)30119-9. Epub 2016 Sep 14. Lancet HIV. 2016. PMID: 27658867
-
Prevalence of acquired and transmitted HIV drug resistance in Iran: a systematic review and meta-analysis.BMC Infect Dis. 2024 Jan 2;24(1):29. doi: 10.1186/s12879-023-08916-3. BMC Infect Dis. 2024. PMID: 38166733 Free PMC article.
Cited by
-
High Level of Pretreatment and Acquired Human Immunodeficiency Virus Drug Resistance in El Salvador: A Nationally Representative Survey, 2018-2019.Open Forum Infect Dis. 2022 Nov 3;9(11):ofac580. doi: 10.1093/ofid/ofac580. eCollection 2022 Nov. Open Forum Infect Dis. 2022. PMID: 36438615 Free PMC article.
-
Pretreatment HIV Drug Resistance and the Molecular Transmission Network Among HIV-Positive Individuals in China in 2022: Multicenter Observational Study.JMIR Public Health Surveill. 2023 Nov 17;9:e50894. doi: 10.2196/50894. JMIR Public Health Surveill. 2023. PMID: 37976080 Free PMC article.
-
Characteristics and growth of the genetic HIV transmission network of Mexico City during 2020.J Int AIDS Soc. 2021 Nov;24(11):e25836. doi: 10.1002/jia2.25836. J Int AIDS Soc. 2021. PMID: 34762774 Free PMC article.
-
HIV-1 drug resistance and genetic transmission network among newly diagnosed people living with HIV/AIDS in Ningbo, China between 2018 and 2021.Virol J. 2023 Oct 13;20(1):233. doi: 10.1186/s12985-023-02193-x. Virol J. 2023. PMID: 37833806 Free PMC article.
-
HIV Pretreatment Drug Resistance Trends in Mexico City, 2017-2020.Pathogens. 2021 Dec 8;10(12):1587. doi: 10.3390/pathogens10121587. Pathogens. 2021. PMID: 34959542 Free PMC article.
References
-
- Garcia-Morales C, Tapia-Trejo D, Quiroz-Morales VS. et al. HIV pretreatment drug resistance trends in three geographic areas of Mexico. J Antimicrob Chemother 2017; 72: 3149–58. - PubMed
-
- Avila-Rios S, Garcia-Morales C, Matias-Florentino M. et al. Pretreatment HIV-drug resistance in Mexico and its impact on the effectiveness of first-line antiretroviral therapy: a nationally representative 2015 WHO survey. Lancet HIV 2016; 3: e579–91. - PubMed
-
- WHO. HIV Drug Resistance Report 2019. https://www.who.int/hiv/pub/drugresistance/hivdr-report-2019/en/.
-
- WHO. Global Action Plan on HIV Drug Resistance 2017. –2021. http://www.who.int/hiv/pub/drugresistance/hivdr-action-plan-2017-2021/en/.
-
- WHO. Guidelines on the Public Health Response to Pretreatment HIV Drug Resistance. 2017. http://www.who.int/hiv/pub/guidelines/hivdr-guidelines-2017/en/.
