Review
. 2020 Feb;42(1):57-80.
doi: 10.1007/s11357-019-00142-7. Epub 2019 Dec 9.

Direct electrophysiological evidence that spreading depolarization-induced spreading depression is the pathophysiological correlate of the migraine aura and a review of the spreading depolarization continuum of acute neuronal mass injury

Affiliations
Review

Direct electrophysiological evidence that spreading depolarization-induced spreading depression is the pathophysiological correlate of the migraine aura and a review of the spreading depolarization continuum of acute neuronal mass injury

Sebastian Major et al. Geroscience. 2020 Feb.

Abstract

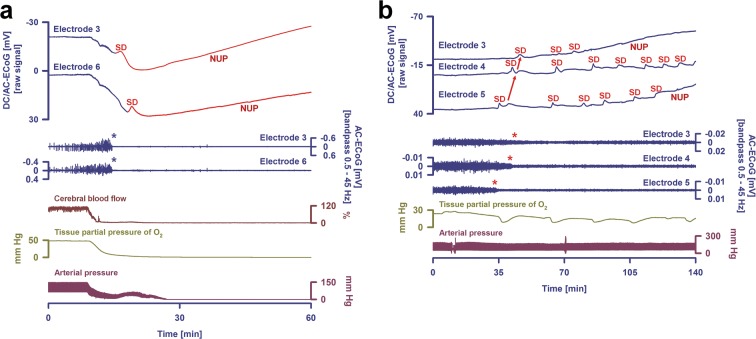
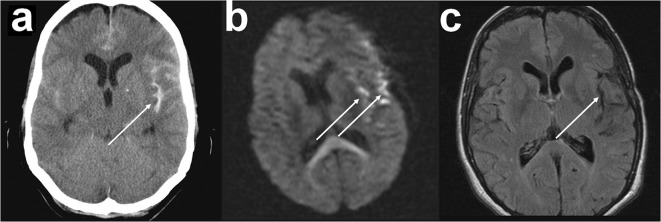
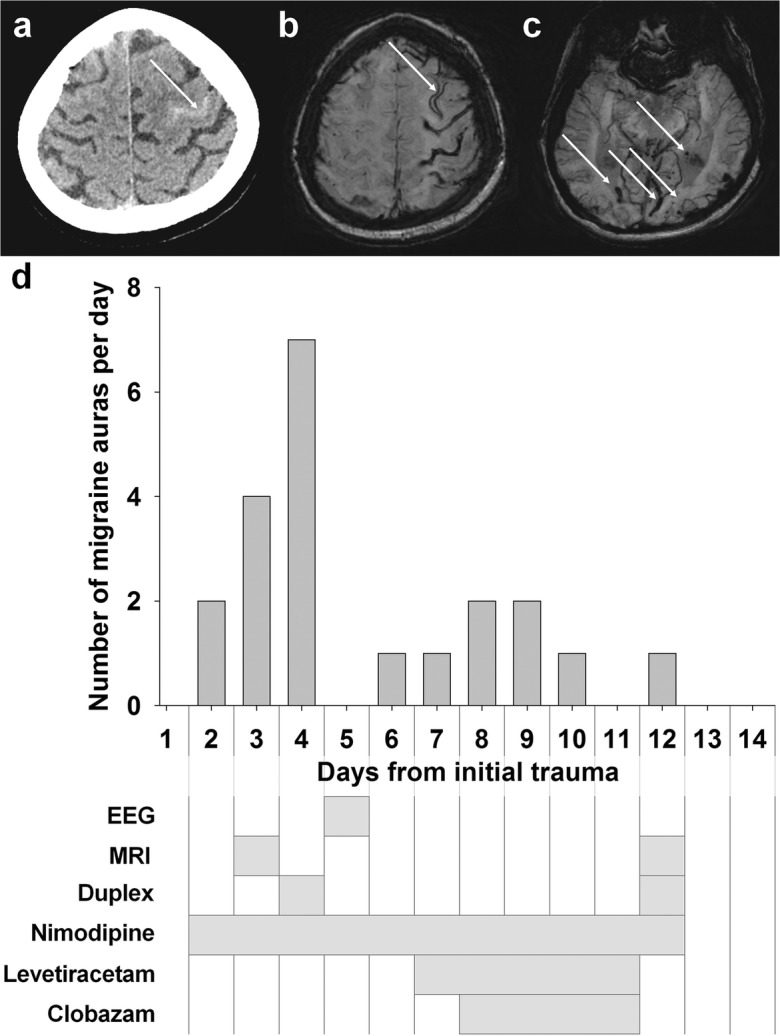
Spreading depolarization is observed as a large negative shift of the direct current potential, swelling of neuronal somas, and dendritic beading in the brain's gray matter and represents a state of a potentially reversible mass injury. Its hallmark is the abrupt, massive ion translocation between intraneuronal and extracellular compartment that causes water uptake (= cytotoxic edema) and massive glutamate release. Dependent on the tissue's energy status, spreading depolarization can co-occur with different depression or silencing patterns of spontaneous activity. In adequately supplied tissue, spreading depolarization induces spreading depression of activity. In severely ischemic tissue, nonspreading depression of activity precedes spreading depolarization. The depression pattern determines the neurological deficit which is either spreading such as in migraine aura or migraine stroke or nonspreading such as in transient ischemic attack or typical stroke. Although a clinical distinction between spreading and nonspreading focal neurological deficits is useful because they are associated with different probabilities of permanent damage, it is important to note that spreading depolarization, the neuronal injury potential, occurs in all of these conditions. Here, we first review the scientific basis of the continuum of spreading depolarizations. Second, we highlight the transition zone of the continuum from reversibility to irreversibility using clinical cases of aneurysmal subarachnoid hemorrhage and cerebral amyloid angiopathy. These illustrate how modern neuroimaging and neuromonitoring technologies increasingly bridge the gap between basic sciences and clinic. For example, we provide direct electrophysiological evidence for the first time that spreading depolarization-induced spreading depression is the pathophysiological correlate of the migraine aura.

Keywords: Cerebral amyloid angiopathy; Delayed cerebral ischemia; Migraine aura; Spreading depression; Subarachnoid hemorrhage.


Figures

Fig. 1
Fig. 1
Terminal spreading depolarization (SD) (= injury depolarization) during the dying process of the human brain after circulatory arrest (a) and a cluster of injury depolarizations during the development of a focal ischemic stroke after aneurysmal subarachnoid hemorrhage (aSAH) (b). a The two top traces show raw direct current (DC) (f 0–45 Hz) recordings from two subdural electrodes (6-contact Wyler recording strip, Ad-Tech Medical, Racine, WI, USA; BrainAmp amplifier, BrainProducts GmbH, Munich, Germany), the two middle traces show the changes in spontaneous brain activity at the same electrodes (f 0.5–45 Hz), and the three bottom traces show the changes in regional cerebral blood flow (rCBF) (opto-electrode strip and Periflux 4001 for laser Doppler flowmetry, Perimed AB, Järfälla, Sweden (Dreier et al. ; Drenckhahn et al. 2016)), tissue partial pressure of oxygen (Licox CC1P1, Integra Lifesciences Corporation, Plainsboro, NJ, USA) (Bosche et al. ; Dreier et al. ; Stuart et al. 2010)), and arterial blood pressure (radial artery catheter). The case has been previously published (patient 2 in Dreier et al. (2018b)). During the dying process in the wake of circulatory arrest, the first DC change was a very slow, homogeneous DC positivity that coincided with the progressive decline in arterial pressure, rCBF, and tissue partial pressure of oxygen. It has been recently suggested that this DC positivity results from interferences of chemicals with the platinum/iridium electrodes (Dreier et al. 2019). Nonspreading depression of spontaneous brain activity (middle traces, cf. blue asterisks) rendered the brain isoelectric within ~ 340 s after onset of the decline in mean arterial pressure or, respectively, 220 s after rCBF had fallen to 20% of baseline. The terminal injury depolarization (top traces) started 53 s after the spontaneous brain activity had fully ceased. In the figure, the terminal event is first seen at electrode 3 (transition from dark blue to red DC traces) from where it spread to electrode 6. The initial component of the terminal event is the injury depolarization component, whereas the late component is called the negative ultraslow potential (NUP). The negative ultraslow potential is experimentally defined by three properties: (i) that it is preceded by the initial injury depolarization component, (ii) that the ion shifts and cell edema do not fully recover during this extremely long DC negativity, and (iii) the death of neurons (Dreier ; Luckl et al. 2018). b A cluster of increasingly long-lasting injury depolarizations in a patient with aSAH who developed a delayed ischemic stroke (Luckl et al. 2018). The traces are similar to a. The case has been previously published (patient 4 in Luckl et al. (2018)). The initial injury depolarization had a short-lasting DC shift (top traces) at the three recording sites and caused a spreading depression of spontaneous activity (middle traces, red asterisks). Thereafter, the activity remained completely and persistently depressed, i.e., isoelectric. Development of isoelectricity occurs progressively as a consequence of injury depolarizations, as evidenced by DC shifts propagating between the different electrodes (red arrows). Injury depolarizations in electrically inactive tissue are termed isoelectric spreading depolarizations. Isoelectric spreading depolarizations indicate that there is energy deprivation in the tissue at or near the recording site (Dreier et al. ; Hartings et al. 2017a). All injury depolarizations following the first one are isoelectric spreading depolarizations in this figure. Note that injury depolarizations of decreasing amplitude occurred superimposed on a negative ultraslow potential, best seen at electrodes 3 and 5. The negative ultraslow potential suggests that neurons are dying. It thus marks the penumbra core conversion in ischemic tissue (Higuchi et al. 2002). Accordingly, the patient developed a delayed ischemic infarct at the recording site (Luckl et al. 2018). Each injury depolarization is associated with a sharp decrease of the tissue partial pressure of oxygen. This results (i) from the injury depolarization-induced increase in the cerebral metabolic rate of oxygen due to sodium pump activation (Haglund and Schwartzkroin ; LaManna and Rosenthal ; Piilgaard and Lauritzen 2009) in combination with (ii) an rCBF decrease due to the inverse hemodynamic response to the injury depolarization (Dreier ; Dreier et al. 2009)
Fig. 2
Fig. 2
Normal and inverse hemodynamic responses to spreading depolarizations (SD) (= injury depolarizations) after aneurysmal subarachnoid hemorrhage (aSAH). a The two top traces show raw direct current (DC) (f 0–45 Hz) recordings from two subdural electrodes, traces 3 and 4 show the changes in spontaneous brain activity at the same electrodes (f 0.5–45 Hz), traces 5 and 6 show the changes in regional cerebral blood flow (rCBF) (laser-Doppler flowmetry), and traces 7 and 8 show the changes in low-frequency vascular fluctuations (= rCBF fluctuations in the frequency range between f 0.05–0.1 Hz). Two injury depolarizations are observed in the DC recordings as large negative DC shifts. The injury depolarizations cause spreading depression of the spontaneous activity (red asterisks in traces 3 and 4). They propagate in a through otherwise relatively normal tissue. Accordingly, they lead to predominantly hyperemic responses (= normal hemodynamic response to the injury depolarization, red asterisks in traces 5 and 6). Low-frequency vascular fluctuations, detectable by laser Doppler flowmetry and functional MRI, are determined by the brain’s resting neuronal activity. Injury depolarizations are associated with a depolarization block of the resting activity, recorded electrophysiologically as spreading depression of spontaneous electrocorticographic (ECoG) activity. Accordingly, injury depolarizations not only lead to spreading depression of the spontaneous activity but also to spreading suppression of low-frequency vascular fluctuations (Dreier et al. 2009) (red asterisks in traces 7 and 8). b The traces are similar to a, but more electrodes and optodes are shown. Two injury depolarizations are observed in the DC recordings as large negative DC shifts. When the neurovascular coupling process is disturbed, an injury depolarization can induce severe vasoconstriction instead of vasodilatation leading to a local perfusion deficit (= spreading ischemia). This delays the neuronal and astroglial repolarization and perpetuates the injury (= inverse hemodynamic response to the injury depolarization, red asterisks in traces 9-12) (Dreier et al. ; Dreier et al. 2009). The repolarization phases of the negative DC shifts are only slightly less steep in b than in a. However, the injury depolarization-induced spreading depressions of spontaneous activity (red asterisks in traces 5-8) and spreading suppressions of low-frequency vascular fluctuations (red asterisks in traces 13-16) are clearly longer in b than in a indicating that the tissue requires more time for recovery when the injury depolarizations trigger spreading ischemias
Fig. 3
Fig. 3
Neuroimaging of illustrative case 1 (migraine aura after aneurysmal subarachnoid hemorrhage (aSAH)). a Initial computed tomography (CT) scan showing an aSAH with blood accumulation in the Sylvian fissure due to rupture of a left middle cerebral artery aneurysm. b Diffusion-weighted magnetic resonance imaging (DW-MRI) on day 15 after aSAH demonstrating diffusion restrictions typical of delayed cerebral ischemia at the cortical surface and around the Sylvian fissure (Dreier et al. ; Weidauer et al. 2008) (arrows). The assessment is slightly reduced by motion artifacts. c Fluid-attenuated inversion recovery (FLAIR)-weighted MRI 7 months after aSAH with cortical atrophy in the area of the left Sylvian fissure
Fig. 4
Fig. 4
Spreading depolarization (= injury depolarization)-induced spreading depression of activity during a migraine aura on day 11 after aneurysmal subarachnoid hemorrhage (aSAH) (illustrative case 1). a The five top traces show raw direct current (DC) (f 0–45 Hz) recordings from subdural electrodes 2–6, traces 6–10 show the changes in spontaneous brain activity at the same electrodes (f 0.5–45 Hz), trace 11 shows the tissue partial pressure of oxygen, and trace 12 the intracranial pressure. During the routine restart of the recording system on day 11, the patient developed typical symptoms of a motor migraine aura. In parallel, an injury depolarization-induced spreading depression of activity was recorded in more frontal areas of the cortex. It is likely that electrode 6 would have recorded a negative DC shift similar to electrodes 3–5, if the recording had restarted earlier because the activity was depressed at electrode 6 at the onset of the recording and gradually recovered thereafter. Moreover, practically all other injury depolarizations in this patient involved electrode 6. b Projection of electrodes 1–6 of the subdural, collinear recording strip on the left brain cortex of the patient. The electrodes were obtained from a postoperative computed tomography (CT) scan by simple thresholding as previously described (Milakara et al. 2017). The surface of the isolated electrodes was geometrically reconstructed by MATLAB’s (MathWorks Inc., Natick, MA, USA) isosurface function. The cortical reconstruction was performed with FreeSurfer (Martinos Center for Biomedical Imaging, Charlestown, MA, USA, http://surfer.nmr.mgh.harvard.edu/) from the magnetic resonance imaging (MRI) scan on day 15. To superimpose the electrodes on the geometric mesh representing the cortical surface, the CT scan including the electrodes was rigidly co-registered to the MRI scan reoriented and resampled with FreeSurfer. The arrows indicate the direction of the spread of the injury depolarization. c The primary motor cortex is located in the precentral gyrus and handles signals coming from the premotor area of the frontal lobes. The motor homunculus represents a map of areas in the primary motor cortex dedicated to motor processing for different anatomical divisions of the body. The subdural electrode strip that recorded the injury depolarization-induced spreading depression of brain activity was not located directly on the motor cortex affected by the migraine aura, but it is plausible that it spread not only towards the frontal pole along the recording strip but also upwards along the primary motor cortex (arrow)
Fig. 5
Fig. 5
Repeated migraine auras after traumatic subarachnoid hemorrhage (tSAH) in the left central sulcus in a patient with probable cerebral amyloid angiopathy (illustrative case 2). a Initial computed tomography (CT) on day 2 showing localized acute cortical tSAH within the central sulcus adjacent to the hand knob (arrow). b The susceptibility-weighted magnetic resonance imaging (MRI) on day 12 demonstrates widespread left frontoparietal superficial hemosiderosis. No visible signal changes were seen in the parenchyma adjacent to the tSAH (not shown). c The susceptibility-weighted minimum intensity projection reveals numerous juxtacortical microbleeds and smaller lobar hemorrhagic residua typical of cerebral amyloid angiopathy. d Time course of the occurrence of migraine auras and the medical treatment as well as time points of the diagnostic tests after the sulcal hemorrhage

Similar articles

Cited by

References

    1. Aiba I, Shuttleworth CW. Sustained NMDA receptor activation by spreading depolarizations can initiate excitotoxic injury in metabolically compromised neurons. J Physiol. 2012;590:5877–5893. doi: 10.1113/jphysiol.2012.234476. - DOI - PMC - PubMed
    1. Aitken PG, Tombaugh GC, Turner DA, Somjen GG. Similar propagation of SD and hypoxic SD-like depolarization in rat hippocampus recorded optically and electrically. J Neurophysiol. 1998;80:1514–1521. - PubMed
    1. Akcali D, Sayin A, Sara Y, Bolay H. Does single cortical spreading depression elicit pain behaviour in freely moving rats? Cephalalgia. 2010;30:1195–1206. doi: 10.1177/0333102409360828. - DOI - PubMed
    1. Allen NJ, Rossi DJ, Attwell D. Sequential release of GABA by exocytosis and reversed uptake leads to neuronal swelling in simulated ischemia of hippocampal slices. J Neurosci. 2004;24:3837–3849. doi: 10.1523/JNEUROSCI.5539-03.2004. - DOI - PMC - PubMed
    1. Arboix A, Garcia-Eroles L, Massons J, Oliveres M, Targa C. Acute stroke in very old people: clinical features and predictors of in-hospital mortality. J Am Geriatr Soc. 2000;48:36–41. doi: 10.1111/j.1532-5415.2000.tb03026.x. - DOI - PubMed

Publication types