. 2020 Jan 6;219(1):e201902088.
doi: 10.1083/jcb.201902088.

A pair of E3 ubiquitin ligases compete to regulate filopodial dynamics and axon guidance

Affiliations

A pair of E3 ubiquitin ligases compete to regulate filopodial dynamics and axon guidance

Nicholas P Boyer et al. J Cell Biol. .

Abstract

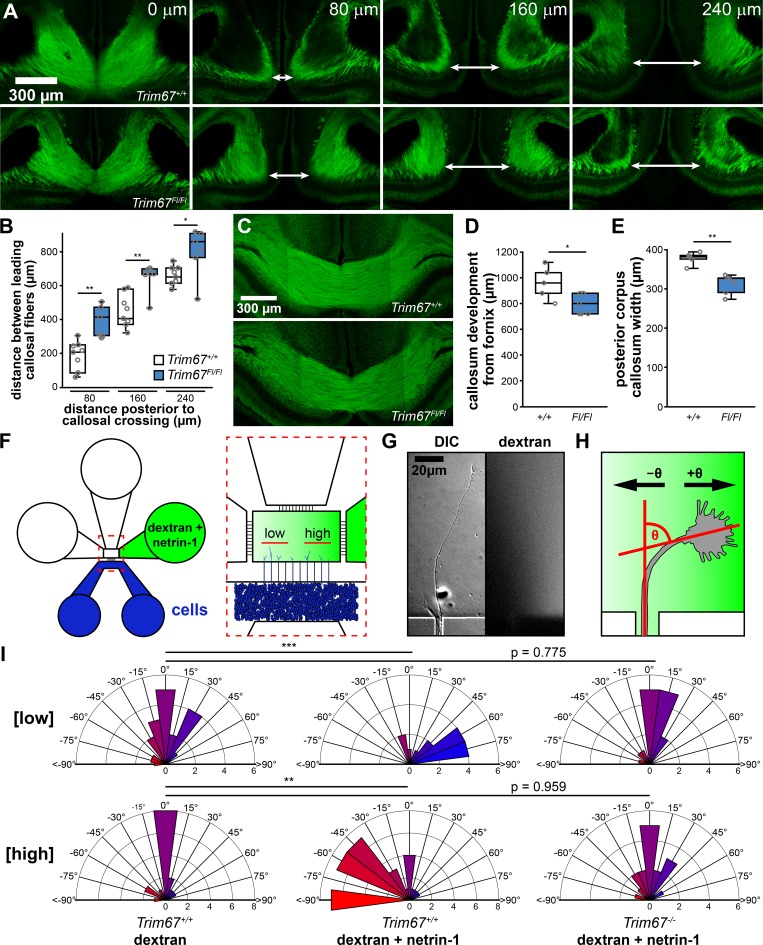
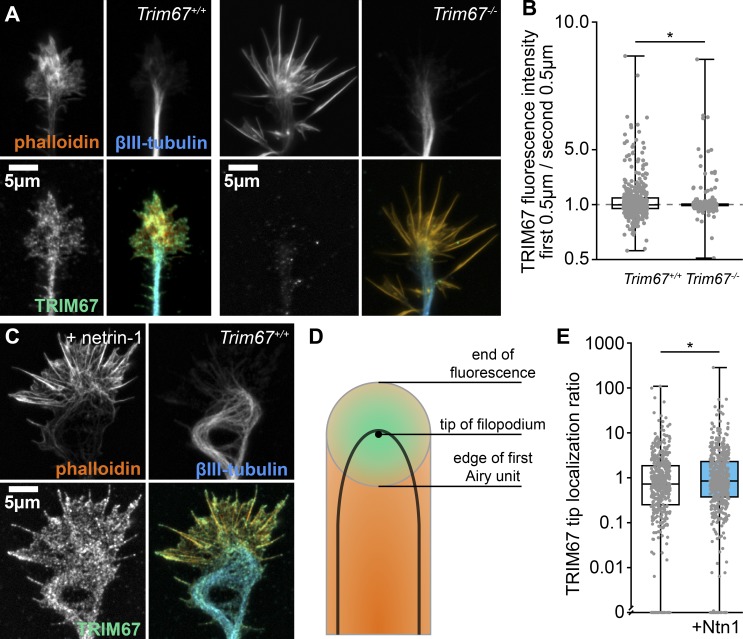
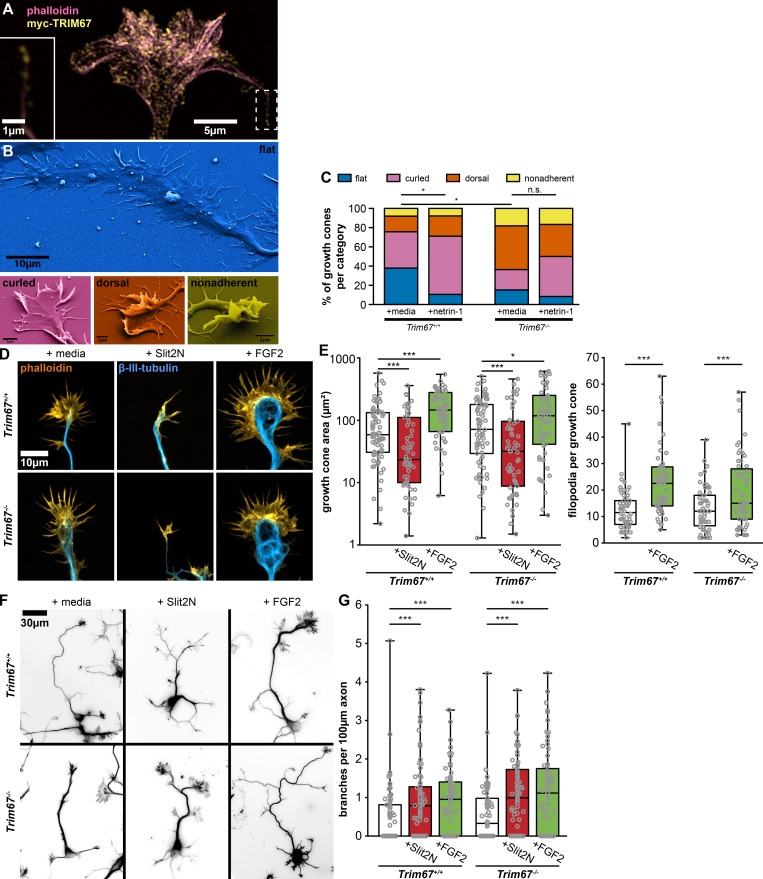
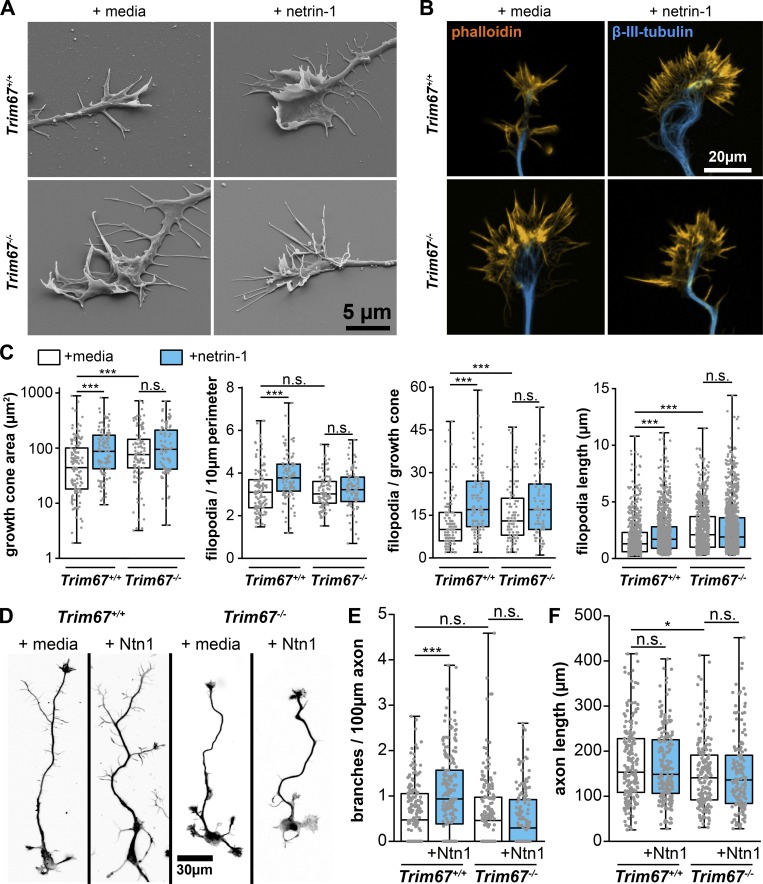
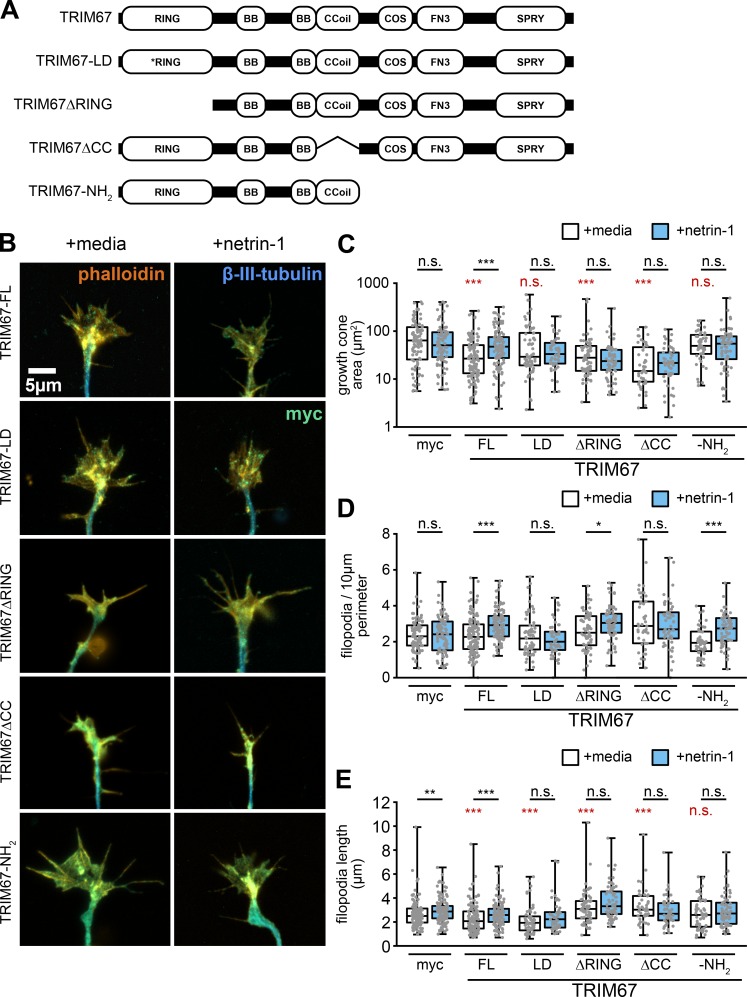
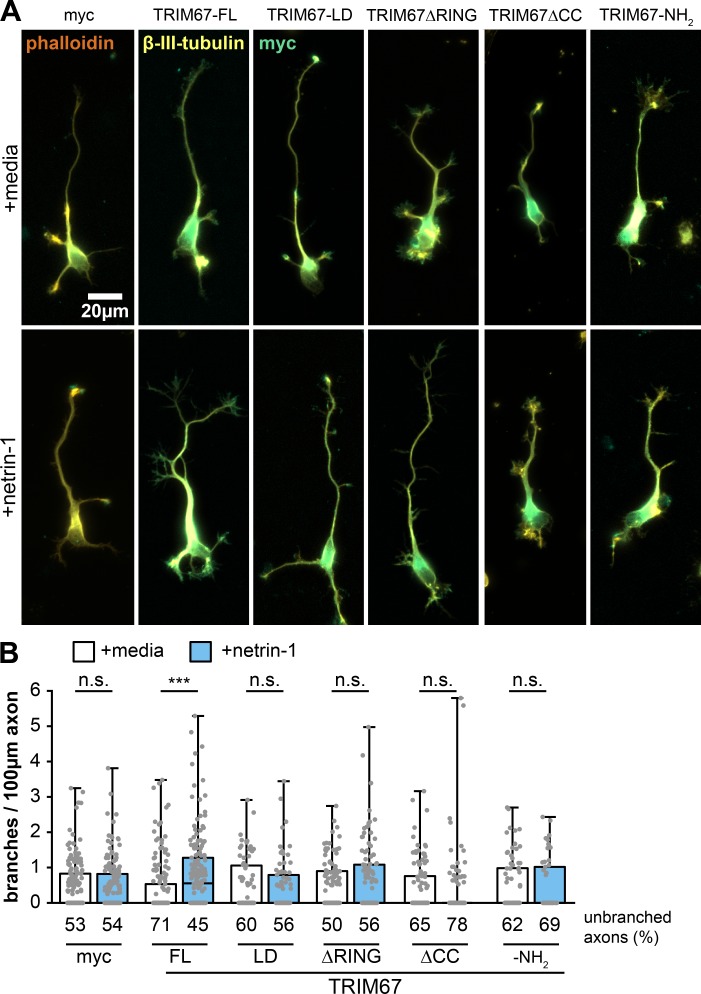
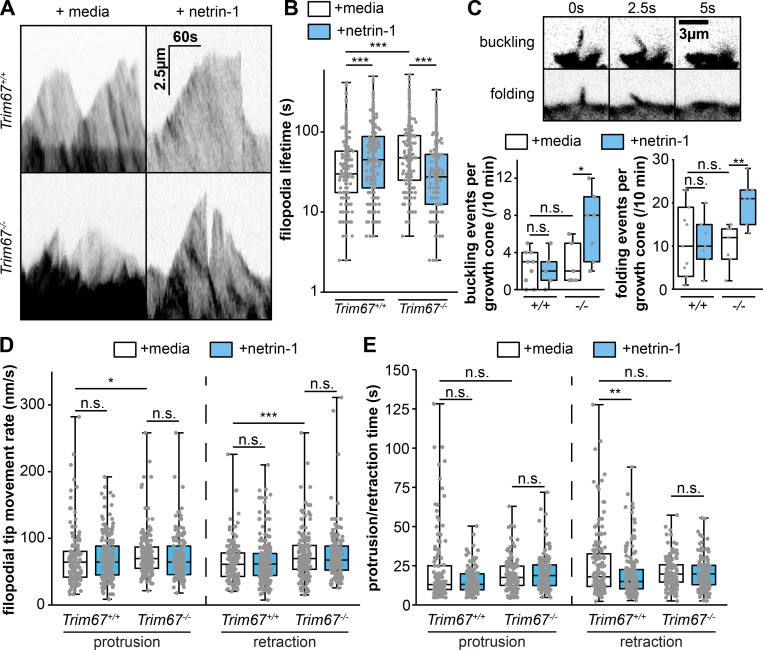
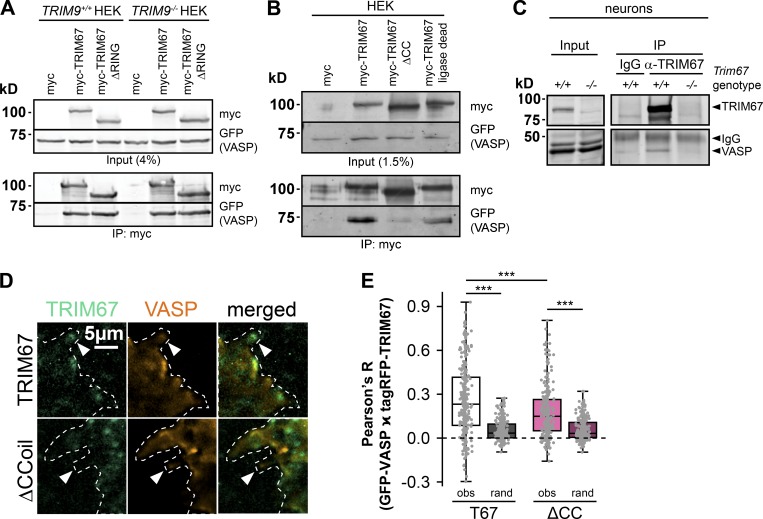
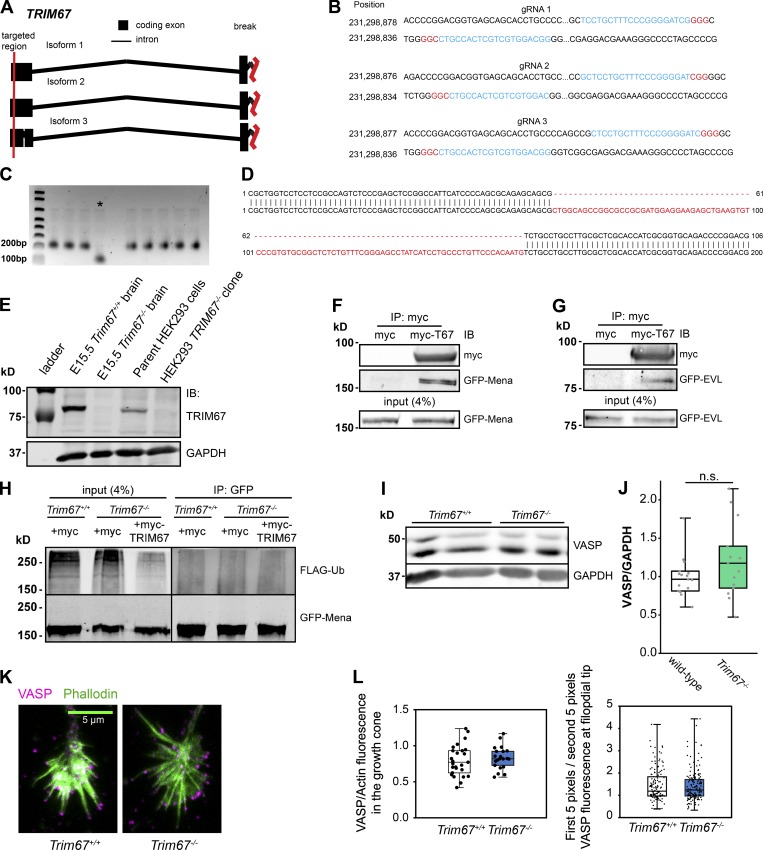
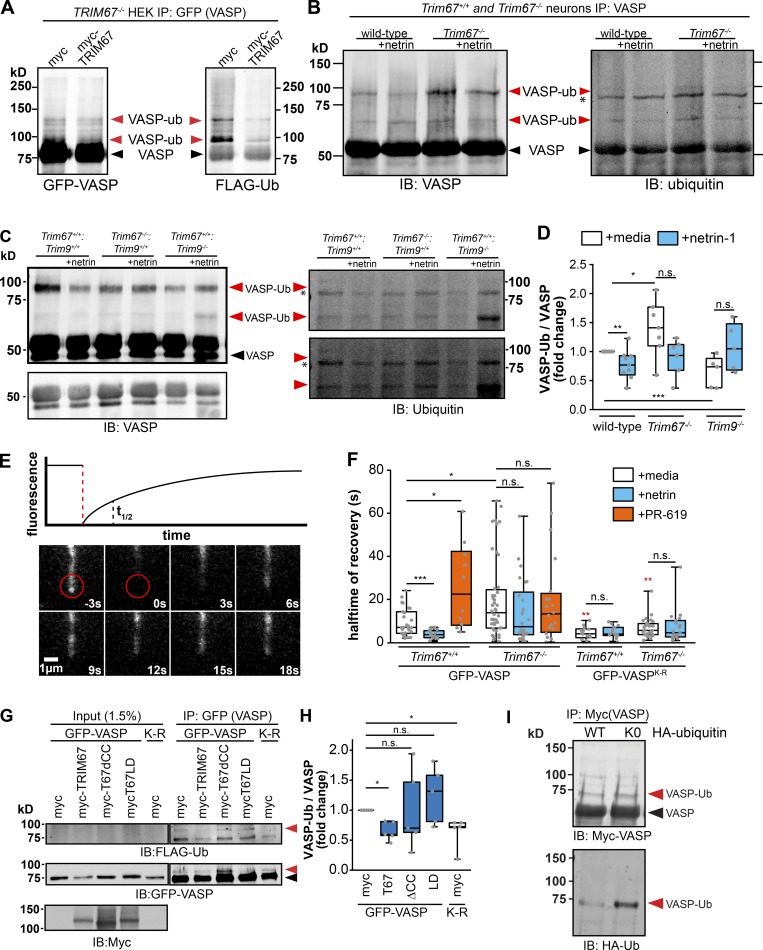
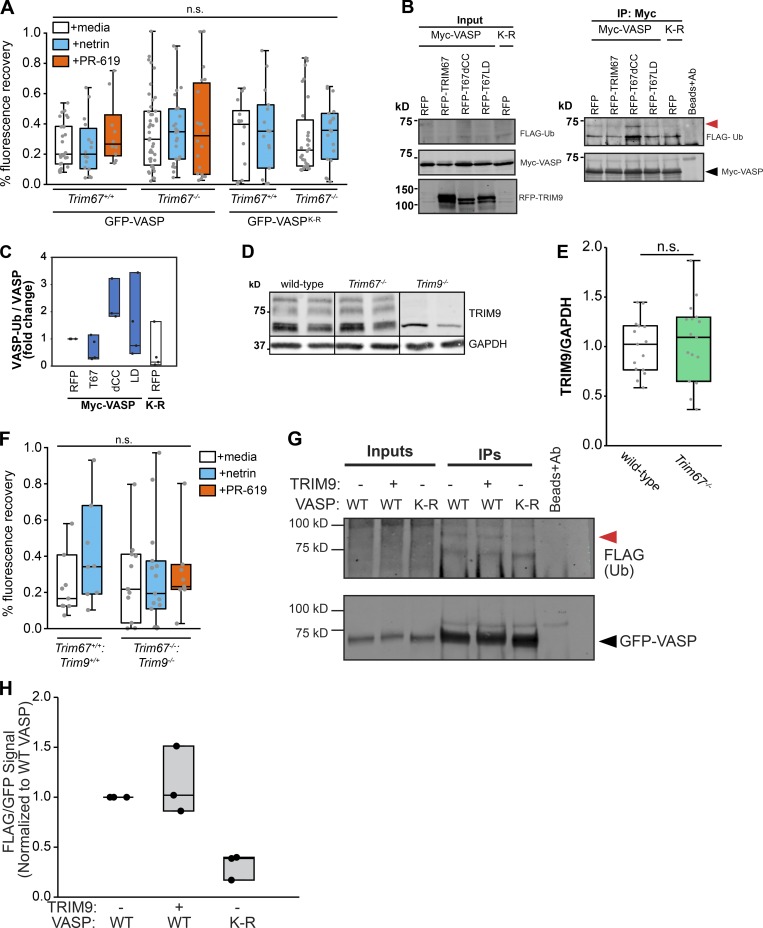
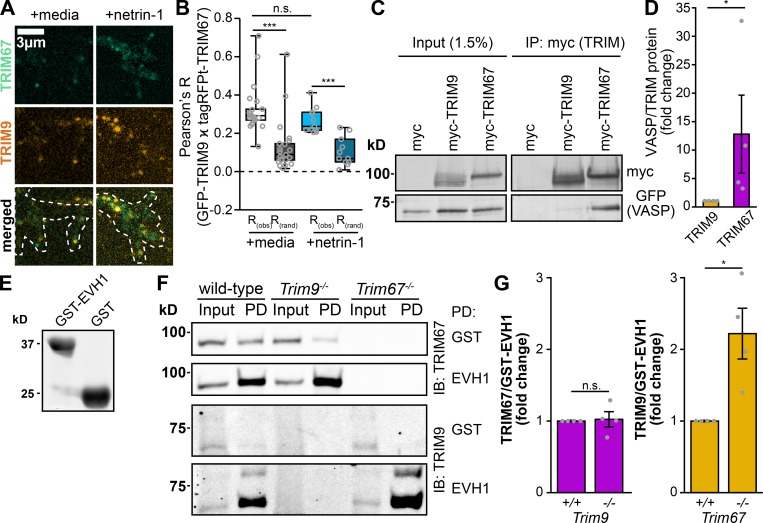
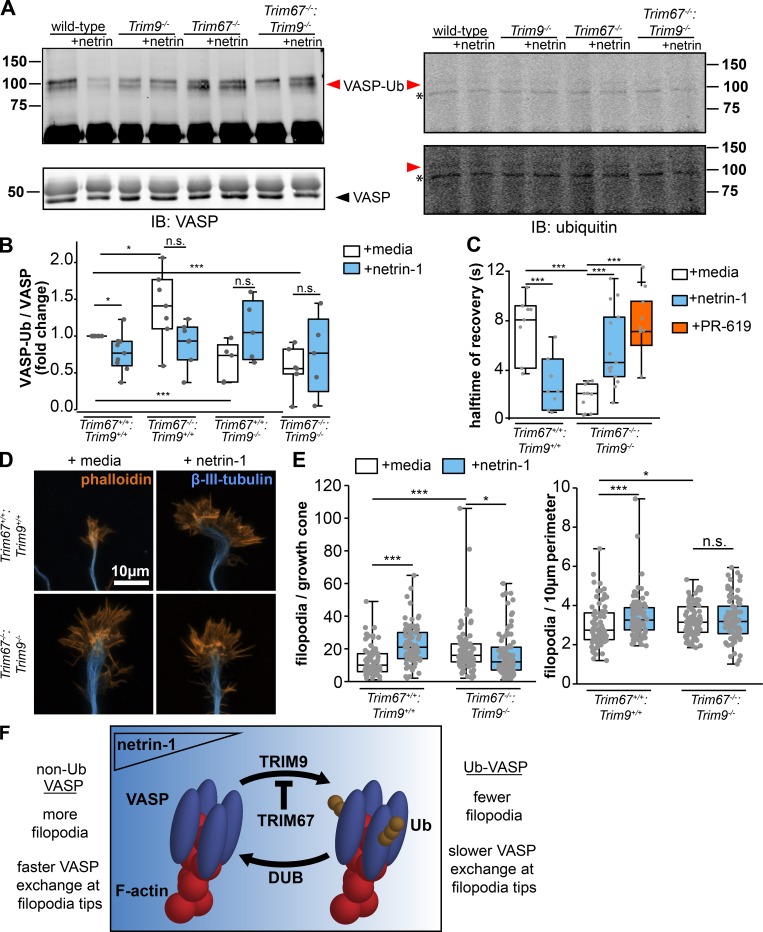
Appropriate axon guidance is necessary to form accurate neuronal connections. Axon guidance cues that stimulate cytoskeletal reorganization within the growth cone direct axon navigation. Filopodia at the growth cone periphery have long been considered sensors for axon guidance cues, yet how they respond to extracellular cues remains ill defined. Our previous work found that the filopodial actin polymerase VASP and consequently filopodial stability are negatively regulated via nondegradative TRIM9-dependent ubiquitination. Appropriate VASP ubiquitination and deubiquitination are required for axon turning in response to the guidance cue netrin-1. Here we show that the TRIM9-related protein TRIM67 outcompetes TRIM9 for interacting with VASP and antagonizes TRIM9-dependent VASP ubiquitination. The surprising antagonistic roles of two closely related E3 ubiquitin ligases are required for netrin-1-dependent filopodial responses, axon turning and branching, and fiber tract formation. We suggest a novel model in which coordinated regulation of VASP ubiquitination by a pair of interfering ligases is a critical element of VASP dynamics, filopodial stability, and axon guidance.


Figures

Figure 1.
Figure 1.
Trim67 is required for axonal development and guidance in vivo and in vitro. (A) Confocal micrographs of serial coronal sections of GFP in the corpus callosum of murine brains fixed at P0 from Trim67+/+:Nex-Cre:Tau-Lox-STOP-Lox-GFP and Trim67Fl/Fl:Nex-Cre:Tau-Lox-STOP-Lox-GFP littermates. Arrows demarcate leading fibers of the corpus callosum in sections 80, 160, and 240 µm posterior to the final connection of the callosum. (B) Individual data points and box plots of the distance between leading fibers of the corpus callosum at P0. n (animals) = 8 Trim67+/+:Nex-Cre:Tau-Lox-STOP-Lox-GFP, 6 Trim67Fl/Fl:Nex-Cre:Tau-Lox-STOP-Lox-GFP. (C) Confocal micrographs of coronal sections of the corpus callosum at P4, 160 µm anterior to the final connection of the callosum. (D and E) Quantification of the extent of callosal development expressed as individual data points and box plots of the distance from the fornix to the separation of the callosal leading fibers (D) and callosal width at the midline eight sections posterior to the fornix at P4 (E). n (animals) = 5 +/+, 6 Fl/Fl. (F) Schematic of microfluidic axon guidance chambers. (G) Example axon extending from a microgroove into the axon guidance chamber, and fluorescent dextran used to visualize the gradient. (H) Diagram depicting axon turning angle measured between a line bisecting the axonal growth cone and a line overlapping and parallel to the axon as it exits microgroove. (I) Rose plots of embryonic cortical neuron axon turning angles in a gradient of fluorescent dextran or dextran + netrin-1. Low concentration denotes the four microgrooves furthest from the gradient source, while the four microgrooves closest to the source are denoted high concentration (Taylor et al., 2015). Positive turning angles represent axon turning toward the netrin-1 source; negative angles represent axon turning away from the source. Three experiments per genotype/treatment condition. n (axons) = 20 +/+ low [dextran], 17 +/+ high [dextran], 23 +/+ low [netrin], 43 +/+ high [netrin], 15 −/− low [netrin], 17 −/− high [netrin]. *, P < 0.05; **, P < 0.01. Box plots are minimum, Q1, Q2, Q3, maximum.
Figure 2.
Figure 2.
TRIM67 localization to filopodia tips is enhanced by netrin-1. (A) Immunocytochemistry (ICC) of filamentous actin (phalloidin), β-III-tubulin, and TRIM67 in axonal growth cones of primary neurons isolated from Trim67+/+ and Trim67−/− embryonic cortices. (B) Individual data points and box plots of TRIM67 fluorescence intensity in the first 0.5 µm from the tip of the filopodium to the next 0.5 µm. Three experiments per genotype. n (filopodia) = 463 +/+, 440 −/−. (C) ICC of an axonal growth cone from a Trim67+/+ cortex treated with netrin-1. (D) Diagram showing the Airy disk of a fluorescent protein at the tip of a filopodium (green) and fluorescence of a protein along the filopodium (orange). (E) Individual data points and box-and-whisker plots of tip proximity of TRIM67 in filopodia, quantified as the fluorescence ratio of the center to the edge of the first Airy unit. Three experiments per genotype. n (filopodia) = 444 media, 535 netrin. *, P < 0.05. Data in E are presented on a logarithmic scale due to the presence of large values that obscure the population center, with an axis break to allow display of measures of 0. Box plots are minimum, Q1, Q2, Q3, maximum.
Figure S1.
Figure S1.
TRIM67 growth cone response to morphogens. (A) SIM image of myc-TRIM67 and filamentous actin in an axonal growth cone. TRIM67 localizes to the tip of a filopodium (inset, same area as dashed box). (B) Examples of growth cone morphological categories as identified by scanning electron microscopy. (C) Quantification of growth cone morphology distributions of Trim67+/+ and Trim67−/− cortical neurons treated with media or netrin-1. Distributions are compared by Fisher’s exact test. n (cultures) = 3. n (cells) = 37 +/+ media, 38 +/+ netrin, 33 −/− media, 36 −/− netrin. (D) Examples of cortical embryonic axonal growth cones treated with media, Slit2N, or FGF2. (E) Individual data points and box-and-whisker plots showing the data spread in the interquartile range (box) and minimum and maximum (whiskers) of growth cone area and filopodia per growth cone following 40 min of treatment with the indicated guidance cues. n (cultures) = 3. n (cells) = 76 +/+ media, 56 +/+ Slit2N, 56 +/+ FGF2, 76 −/− media, 57 −/− Slit2N, 57 −/− FGF2. (F) Inverted images of neurons combining staining of both filamentous actin (phalloidin) and β-III-tubulin, treated for 24 h with media, Slit2N, or FGF2. (G) Individual data points and box-and-whisker plots showing the data spread in the interquartile range (box) and minimum and maximum (whiskers) of axon branching in response to the indicated guidance cues. n (cultures) = 3. n (cells) = 78 +/+ media, 79 +/+ Slit2N, 71 +/+ FGF2, 73 −/− media, 76 −/− Slit2N, 76 −/− FGF2. *, P < 0.05; ***, P < 0.005; n.s., not significant. Box plots are minimum, Q1, Q2, Q3, maximum.
Figure 3.
Figure 3.
TRIM67 is required for axon and growth cone responses to netrin-1. (A) Scanning electron micrographs of axonal growth cones from embryonic Trim67+/+ and Trim67−/− cortices treated with sham media or media containing netrin-1 for 40 min after 2 d in vitro. (B) Fluorescent micrographs of growth cones from primary neuronal cultures stained for filamentous actin (phalloidin) and β-III-tubulin. (C) Individual data points and box plots of growth cone responses after acute netrin-1 treatment (40 min), including increase in growth cone area, filopodial density, filopodia number, and filopodia length. Three experiments per genotype/treatment. n (cells) = 127 +/+ media, 103 +/+ netrin, 98 −/− media, 83 −/− netrin. For filopodia length, n (filopodia) = 729 +/+ media, 956 +/+ netrin, 786 −/− media, 1,076 −/− netrin. (D) Fluorescent micrographs of neurons cultured for 3 d in vitro including a final 24 h with addition of media or netrin-1, shown as the combined fluorescence of staining for both filamentous actin (phalloidin) and β-III-tubulin. (E and F) Individual data points and box plots of axon branching per 100-µm axon length (E) and of total axon length (F). Six experiments per genotype/treatment. n (cells) = 188 +/+ media, 186 +/+ netrin, 178 −/− media, 156 −/− netrin. *, P < 0.05; ***, P < 0.005; n.s., P > 0.05. Box plots are minimum, Q1, Q2, Q3, maximum.
Figure S2.
Figure S2.
Multiple domains of TRIM67 are required to fully rescue growth cone response to netrin-1. (A) TRIM67 constructs used in structure–function assays. The RING domain of TRIM proteins contain zinc binding pockets necessary for E3 ubiquitin ligation activity and can mediate oligomerization of TRIM proteins (Freemont, 1993; Koliopoulos et al., 2016; Meroni and Diez-Roux, 2005); we therefore made both a RING-deletion construct (TRIM67ΔRING) and one containing mutations at cysteines 7 and 10 to abolish zinc binding in the RING domain and thus any ligase activity (TRIM67-LD). The coiled-coil (CC) domains of TRIM proteins mediate homo- and heterodimerization with other members of the same TRIM class (Sanchez et al., 2014; Short et al., 2002). In our previous investigation of TRIM9, the CC domain also interacted with the filopodial tip-localized actin polymerase VASP (Menon et al., 2015); therefore, we generated a construct of TRIM67 lacking the coiled-coil domain (TRIM67ΔCC). Finally, we generated a construct possessing only the three N-terminal tripartite motif domains (TRIM67-N). All constructs possessed an N-terminal myc tag. (B) ICC of Trim67−/− growth cones stained for actin, β-III-tubulin, and the indicated myc-TRIM67 construct, showing expression and distribution of each construct. (C–E) Individual data points and box-and-whisker plots showing the data spread in the interquartile range (box) and minimum and maximum (whiskers) of growth cone area (C), filopodial density (n [cells] = 96 myc media, 88 myc netrin, 121 TRIM67 media, 114 TRIM67 netrin, 65 LD media, 52 LD netrin, 68 ΔRING media, 68 ΔRING netrin, 45 ΔCC media, 52 ΔCC netrin, 52 NH2 media, 65 NH2 netrin; D), and filopodia length in neurons expressing each rescue construct (E). All statistical comparisons in red are to myc-expressing, untreated growth cones. n (cells) = 128 myc media, 118 myc netrin, 121 TRIM67 media, 119 TRIM67 netrin, 64 LD media, 50 LD netrin, 68 ΔRING media, 68 ΔRING netrin, 45 ΔCC media, 50 ΔCC netrin, 52 NH2 media, 64 NH2 netrin. n (cultures) = 3. *, P < 0.05; ***, P < 0.005. Box plots are minimum, Q1, Q2, Q3, maximum.
Figure S3.
Figure S3.
All domains of TRIM67 are required to rescue netrin-dependent axon branching. (A) ICC of Trim67−/− neurons expressing indicated myc-tagged TRIM67 constructs, stained for myc (green), filamentous actin (phalloidin, red) and β-III-tubulin (yellow). (B) Individual data points and box-and-whisker plots showing the data spread in the interquartile range (box) and minimum and maximum (whiskers) of axon branches per 100-µm axon length. Percentage of neurons with unbranched axons is shown below the x-axis. Note that the percentage of unbranched axons causes many conditions to have a median branching value at 0. All statistical comparisons in red are to myc-expressing, untreated neurons. n (cultures) = 3. n (cells) = 169 myc media, 177 myc netrin, 173 TRIM67 media, 166 TRIM67 netrin, 80 LD media, 77 LD netrin, 108 ΔRING media, 111 ΔRING netrin, 113 ΔCC media, 116 ΔCC netrin, 76 NH2 media, 51 NH2 netrin. ***, P < 0.005. Box plots are minimum, Q1, Q2, Q3, maximum.
Figure 4.
Figure 4.
TRIM67 regulates filopodial growth and dynamics. (A) Kymographs of filopodia from cultured primary embryonic cortical neurons expressing mCherry. (B) Individual data points and box plots of filopodial lifetime. n (filopodia) = 293 +/+ media, 278 +/+ netrin, 257 −/− media, 226 −/− netrin. (C) Fluorescent micrographs and quantification of filopodial buckling and folding events during the course of 10-min time-lapse of axonal growth cones. (D and E) Individual data points and box-and-whisker plots of rate of filopodial tip protrusions and retractions (D) and duration of individual filopodial protrusion and retraction periods (E) following media sham or netrin treatment. n (events) = protrusion: 142 +/+ media, 193 +/+ netrin, 171 −/− media, 136 −/− netrin; retraction: 151 +/+ media, 226 +/+ netrin, 174 −/− media, 151 −/− netrin. Three experiments per genotype/treatment for all panels. *, P < 0.05; **, P < 0.01; ***, P < 0.005; n.s., P > 0.05. Box plots are minimum, Q1, Q2, Q3, maximum.
Figure 5.
Figure 5.
TRIM67 interacts and localizes with VASP. (A) Coimmunoprecipitation assays from TRIM9+/+ or TRIM9−/− HEK293 cells transfected with GFP-VASP and myc or myc-tagged TRIM67 constructs demonstrate an interaction between TRIM67 and VASP that is independent of TRIM9. (B) Coimmunoprecipitation assays from TRIM67−/− HEK293 cells transfected with the indicated TRIM67 and VASP constructs, showing requirement for the TRIM67 coiled-coil domain for the TRIM67:VASP interaction. (C) Immunoprecipitation of endogenous TRIM67 from cultured embryonic cortical neurons, showing coprecipitation of endogenous VASP. (D) Colocalization between GFP-VASP and tagRFP-tagged constructs of TRIM67 in murine embryonic cortical neurons. (E) Individual data points and box plots of the colocalization between VASP and TRIM67 (obs) in filopodia compared with Fay-randomized controls (rand). Three experiments per TRIM67 construct. n (filopodia) = 281 T67, 270 ΔCC. ***, P < 0.005. Box plots are minimum, Q1, Q2, Q3, maximum.
Figure S4.
Figure S4.
TRIM67 interacts with all members of the Ena/VASP family and does not regulate VASP protein levels. (A–E) Generation of TRIM67−/− HEK293 cell lines. (A) CRISPR gRNA were designed to target the first exon in all known isoforms of TRIM67. Red vertical lines indicate the regions targeted by the gRNAs. (B) A set of three designed gRNAs (blue) targeting exon 1 of TRIM67. Two complementary gRNAs per set were used with nickase-Cas9 to reduce off target effect potential. The NGG sequence is highlighted in red. (C) PCR of genomic DNA from WT cells (lane 1) and multiple clones indicates a deletion of ∼100 bp in CRISPR clone 3, which is denoted by the asterisk. (D) Sequencing of HEK293 CRISPR clone 3 (top strand) shows a deletion of 94 base pairs in exon 1 of TRIM67. (E) Immunoblot (IB) for TRIM67 and GAPDH in E15.5 murine brain lysate, Trim67−/− murine brain lysate, HEK293 lysates, and CRISPR-Cas9 clone 3 TRIM67−/− HEK293 lysates. (F) Coimmunoprecipitation assay from TRIM67−/− HEK293T cells transfected with GFP-Mena and myc or myc-TRIM67. (G) Similar coimmunoprecipitation with GFP-EVL. (H) Immunoprecipitation of GFP-tagged Mena from denatured TRIM67−/− HEK293T cell lysate coexpressing FLAG-Ub and indicated myc or myc-TRIM67 reveals no heavy molecular weight Mena+ bands or change in ubiquitin levels among conditions. (I) Representative Western blot of VASP in embryonic cortical lysate from two animals of each indicated genotype. (J) Individual data points and box-and-whisker plots showing the data spread in the interquartile range (box) and min and max (whiskers) of VASP protein levels measured by Western blotting of embryonic cortical lysates, normalized to GAPDH. n (embryos) = 16 +/+, 14 −/−. (K) Maximum-projection immunofluorescence images demonstrating VASP abundance and localization in Trim67+/+ and Trim67−/− cortical neurons cultured 2 d in vitro. (L) Individual data points and box-and-whisker plots showing the data spread in the interquartile range (box) and minimum and maximum (whiskers) of total VASP fluorescence from three individual experiments, normalized to phalloidin fluorescence in the growth cone (left; n [cells] = 27 +/+, 21 −/−) and VASP localization to the filopodial tip (right; n [filopodia] = 140 +/+, 169 −/−). Box plots are minimum, Q1, Q2, Q3, maximum.
Figure 6.
Figure 6.
TRIM67 inhibits the ubiquitination and dynamics of the actin polymerase VASP. (A) Western blot of GFP-VASP immunoprecipitated from denatured TRIM67−/− HEK293 cells expressing myc or MycTRIM67, showing GFP+ bands that comigrate and colabel with ubiquitin (VASP-Ub, red arrowheads), which are heavier than unmodified GFP-VASP (black arrowheads). (B and C) Western blot of VASP immunoprecipitated from denatured cultured embryonic cortical lysate, showing bands that comigrate and colabel with ubiquitin (VASP-Ub, red arrowheads), which migrate at an apparent heavier molecular weight than unmodified VASP (black arrowhead). Asterisk (*) by ubiquitin immunoblot (IB) marks a nonspecific ubiquitin band in all lanes. We note that the endogenous ubiquitinated species are more difficult to detect than ubiquitination of overexpressed and tagged proteins, potentially due to lower protein expression and antibody quality. As recognized in the field, endogenous ubiquitination of proteins is notoriously difficult to detect, particularly when the substrate is not modified by multiple ubiquitins (poly-ubiquitinated). Further, acquiring sufficient material from timed pregnant litters of multiple genotypes is limiting. We thus provide two examples of endogenous ubiquitination assays and multiple intensity exposures to better highlight the bands of interest. (D) Individual data points and box plots of VASP-Ub relative to total VASP levels, normalized to untreated WT of each experiment. Bars are averages of five to seven experiments. n (cultures) = 9 +/+, 5 Trim9−/−, 7 Trim67−/−. (E) Diagram of a fluorescence recovery curve following photobleaching of GFP-VASP at the tip of a filopodium with a representation of the halftime of recovery (t1/2), alongside an image montage of the FRAP of GFP-VASP in a transfected embryonic cortical neuron. (F) Quantification of the FRAP t1/2 of GFP-VASP or GFP-VASPK-R in embryonic cortical neurons treated with netrin-1 or the deubiquitinase inhibitor PR-619. Statistical comparisons in red are with respect to the GFP-VASP FRAP t1/2 in untreated cells of the same genotype. Three to five experiments per genotype/treatment. n (cells) = GFP-VASP: 27 +/+ media, 16 +/+ netrin, 10 +/+ PR-619, 28 −/− media, 26 −/− netrin, 20 −/− PR-619; GFP-VASP(K-R): 14 +/+ media, 15 +/+ netrin, 28 −/− media, 19 −/− netrin. (G) Ubiquitination-precipitation assays of GFP-VASP expressed in HEK293T cells lacking TRIM67 expressing indicated myc-TRIM67 constructs, along with FLAG-ubiquitin. A VASP band that comigrates with FLAG-Ub (red arrowhead) appears heavier than unmodified VASP (black arrowhead). (H) Individual data points and box plots of VASP-Ub (FLAG signal relative to total GFP-VASP) normalized to the myc control condition. n (cultures) = 5 for all conditions. (I) Western blot of Myc-VASP immunoprecipitated from denatured HEK293 cells expressing HA-ubiquitin (WT) or HA-ubiquitin knockout (K0), showing a single predominant Myc+ species that comigrates and colabels with HA-ubiquitin (VASP-Ub, red arrowheads), which is heavier than unmodified Myc-VASP (black arrowhead). *, P < 0.05; **, P < 0.01; ***, P < 0.005; n.s., P > 0.05. Box plots are minimum, Q1, Q2, Q3, maximum.
Figure S5.
Figure S5.
TRIM67 regulates ubiquitination of VASP. (A) Percentage recovery of fluorescence (mobile fraction) in FRAP assays reported in Fig. 6. Three to five experiments per genotype/treatment. n (cells) = GFP-VASP: 27 +/+ media, 16 +/+ netrin, 10 +/+ PR-619, 28 −/− media, 26 −/− netrin, 20 −/− PR-619; GFP-VASP(K-R): 14 +/+ media, 15 +/+ netrin, 28 −/− media, 19 −/− netrin. (B) Ubiquitination-precipitation assays of Myc-VASP expressed in HEK293T cells lacking TRIM67 expressing indicated tagRFP-TRIM67 constructs, along with FLAG-ubiquitin. A FLAG-Ub migrates at a heavier molecular weight (red arrowhead) than unmodified VASP (black arrowhead). (C) Individual data points and box-and-whisker plots showing the data spread in the interquartile range (box) and minimum and maximum (whiskers) of VASP-Ub, quantified from FLAG signal relative to total Myc-VASP, normalized to the RFP control condition. Four experiments/cultures per construct. (D) Representative Western blot of TRIM9 in embryonic cortical lysate from two animals of each indicated genotype. Bottom band in Trim9−/− lysate is a nonspecific band. (E) TRIM9 expression from embryonic cortical lysates. n (embryos) = 15 +/+, 16 −/−. (F) Percentage recovery of fluorescence in FRAP assays reported in Fig. 8. Three experiments per genotype/treatment. n (cells) = 8 +/+ media, 8 +/+ netrin, 12 −/− media, 15 −/− netrin, 8 −/− PR-619. (G) Ubiquitination-precipitation assays of GFP-VASP expressed in HEK293T cells lacking TRIM67 expressing MycTRIM9 where indicated, along with FLAG-ubiquitin. A FLAG-Ub migrates at a heavier molecular weight (red arrowhead) than unmodified VASP (black arrowhead). (H) Quantification of VASP-Ub, quantified from FLAG signal relative to total GFP-VASP, normalized to the WT control condition. Three experiments/cultures per condition. Box plots are minimum, Q1, Q2, Q3, maximum.
Figure 7.
Figure 7.
TRIM67 colocalizes with TRIM9 and inhibits the TRIM9:VASP interaction. (A) Colocalization of GFP-TRIM9 and tagRFP-tagged TRIM67 in embryonic cortical neurons. (B) Quantification of colocalization between TRIM9 and TRIM67 (obs) compared with Fay-randomized controls (rand). Three experiments per treatment. n (cells) = 22 media, 11 netrin. (C) Coimmunoprecipitation of myc-tagged TRIM9 or TRIM67 from HEK293 cells showing coprecipitated GFP-VASP. (D) Quantification and individual data points of coprecipitated GFP-VASP relative to myc-tagged TRIM protein normalized to the VASP/TRIM67 ratio of each experiment. n (cultures) = 4 per genotype. Error bars denote SEM. (E) Coomassie-stained gel of recombinant GST or GST-EVH1 domain of VASP, used for pulldowns in F. (F) Pulldowns (PD) from embryonic mouse cortical lysate using either GST or GST-EVH1 domain of VASP, probed for endogenous TRIM67 and TRIM9. IB, immunoblot. (G) Quantification and individual data points of TRIM proteins precipitated by GST-EVH1 from lysates of indicated genotypes, normalized to WT levels. n (cultures) = 4 per condition. Error bars denote SEM. Data are presented as bar charts in D and G, as these datasets contain fewer than the five samples required to produce a box plot without interpolation. *, P < 0.05; ***, P < 0.005; n.s., P > 0.05. Box plots are minimum, Q1, Q2, Q3, maximum.
Figure 8.
Figure 8.
TRIM67 antagonizes TRIM9 in the regulation of VASP and filopodia. (A) Western blot of endogenous VASP immunoprecipitated from denatured cultured embryonic cortical lysate of indicated genotypes, showing VASP+ bands that comigrate and colabel with ubiquitin (VASP-Ub, red arrowheads) and run at a heavier apparent molecular weight than unmodified VASP (black arrowhead). Asterisk (*) by ubiquitin immunoblot (IB) marks a nonspecific ubiquitin band in all lanes. A low-intensity (top) and higher-intensity (bottom) scan of anti-ubiquitin blots are included to better reveal bands of interest. (B) Individual data points and box plots of VASP ubiquitination; n (cultures) = 9 +/+ media, 9 +/+ netrin, 7 Trim67−/− media, 7 Trim67−/− netrin, 5 Trim9−/− media, 5 Trim9−/− netrin, 7 Trim67−/−:Trim9−/− media, 5 Trim67−/−:Trim9−/− netrin. (C) Individual data points and box plots of FRAP halftime (t1/2) of GFP-VASP at filopodia tips in embryonic cortical neurons of indicated genotypes treated with netrin-1 or PR-619. Three experiments per condition. n (cells) = 8 +/+ media, 8 +/+ netrin, 10 −/− media, 14 −/− netrin, 8 −/− PR-619. (D) Fluorescent micrographs of growth cones of cortical neurons cultured from Trim67+/+:Trim9+/+ or Trim67−/−:Trim9−/− embryos, treated with either netrin-1 or a media sham. (E) Individual data points and box plots of filopodia number per growth cone and numerical density in embryonic cortical neurons isolated from brains of indicated genotypes. Three experiments per genotype/treatment. n (cells) = 82 +/+ media, 88 +/+ netrin, 93 −/− media, 92 −/− netrin. (F) Working model: VASP is ubiquitinated by TRIM9, resulting in decreased stability of filopodia on axonal growth cones. This ubiquitination is antagonized by TRIM67. We hypothesize that VASP ubiquitination and the resultant short-lived filopodia allow for efficient filopodial exploration of the extracellular environment. Consequently, when a filopodia encounters netrin, TRIM67 is recruited to filopodia tips, where it antagonizes VASP ubiquitination and increases filopodial lifetime, before axon turning. *, P < 0.05; ***, P < 0.005; n.s., P > 0.05. Box plots are minimum, Q1, Q2, Q3, maximum.

References

    1. Applewhite D.A., Barzik M., Kojima S., Svitkina T.M., Gertler F.B., and Borisy G.G.. 2007. Ena/VASP proteins have an anti-capping independent function in filopodia formation. Mol. Biol. Cell. 18:2579–2591. 10.1091/mbc.e06-11-0990 - DOI - PMC - PubMed
    1. Baker C.R., Hanson-Smith V., and Johnson A.D.. 2013. Following gene duplication, paralog interference constrains transcriptional circuit evolution. Science. 342:104–108. 10.1126/science.1240810 - DOI - PMC - PubMed
    1. Bin J.M., Han D., Lai Wing Sun K., Croteau L.-P., Dumontier E., Cloutier J.-F., Kania A., and Kennedy T.E.. 2015. Complete Loss of Netrin-1 Results in Embryonic Lethality and Severe Axon Guidance Defects without Increased Neural Cell Death. Cell Reports. 12:1099–1106. 10.1016/j.celrep.2015.07.028 - DOI - PubMed
    1. Boyer N.P., and Gupton S.L.. 2018. Revisiting Netrin-1: One Who Guides (Axons). Front. Cell. Neurosci. 12:221 10.3389/fncel.2018.00221 - DOI - PMC - PubMed
    1. Boyer N.P., Monkiewicz C., Menon S., Moy S.S., and Gupton S.L.. 2018. Mammalian TRIM67 functions in brain development and behavior. eNeuro. 5:ENEURO.0186-18.2018. 10.1523/ENEURO.0186-18.2018 - DOI - PMC - PubMed

Publication types

MeSH terms