. 2020 Jan 6;219(1):e201812098.
doi: 10.1083/jcb.201812098.

SNX27-retromer assembly recycles MT1-MMP to invadopodia and promotes breast cancer metastasis

Affiliations

SNX27-retromer assembly recycles MT1-MMP to invadopodia and promotes breast cancer metastasis

Priyanka Sharma et al. J Cell Biol. .

Abstract

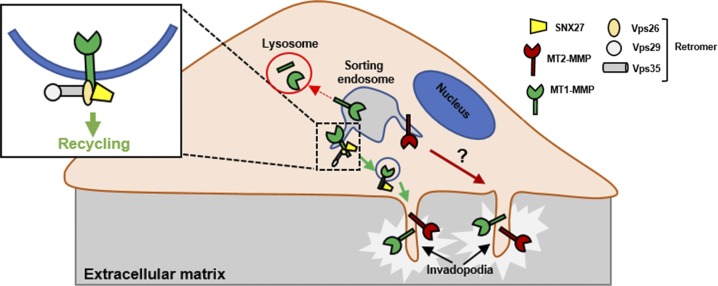
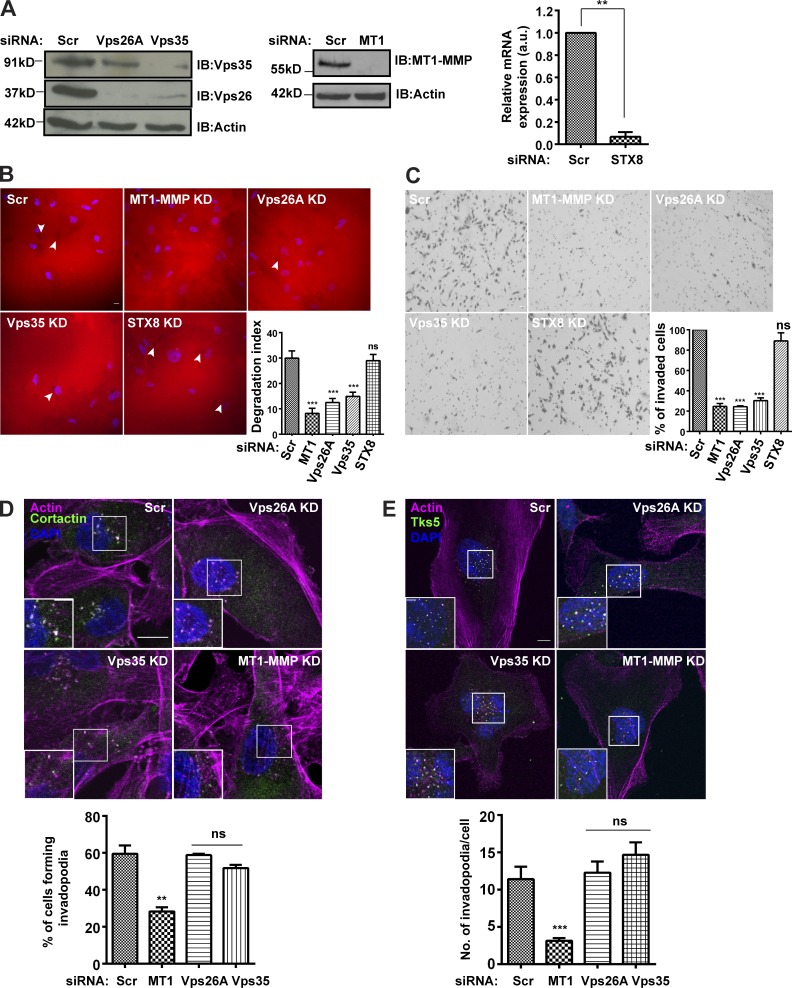
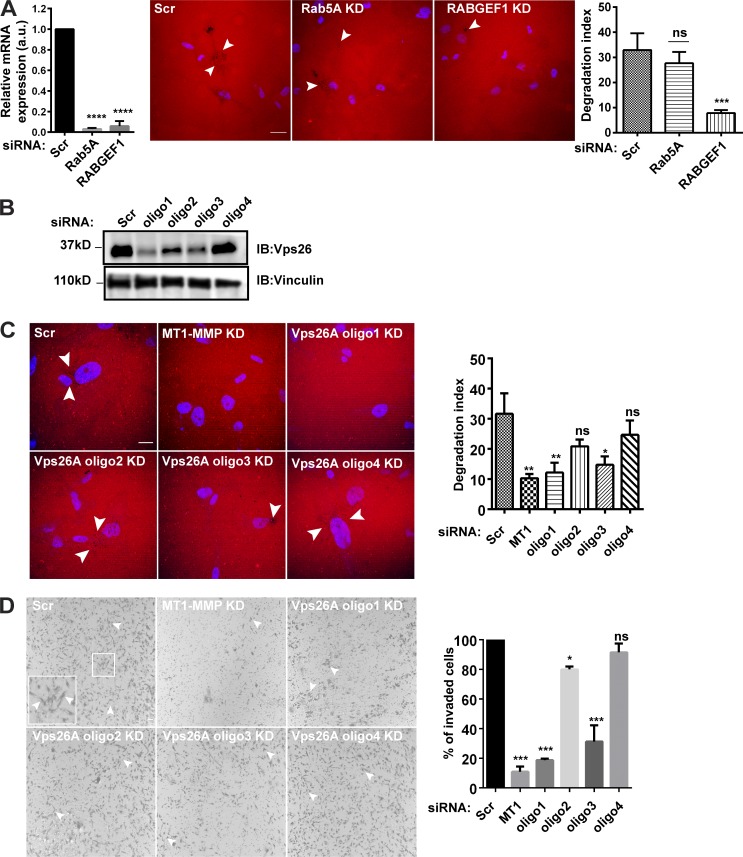
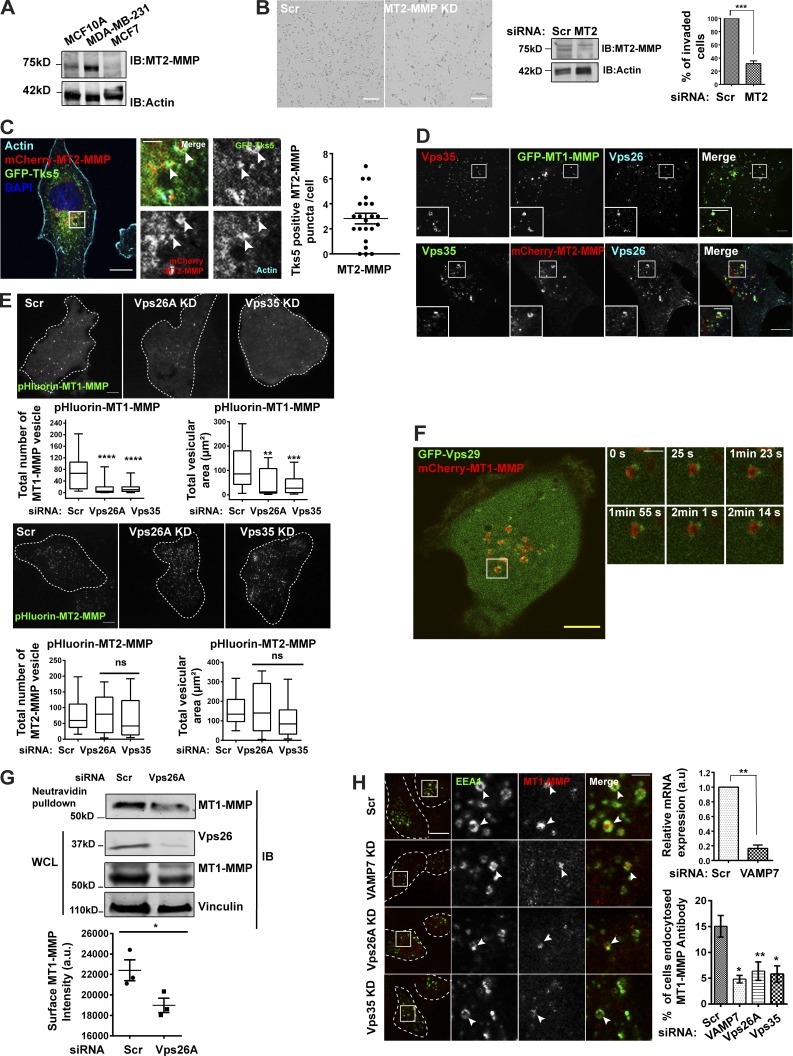
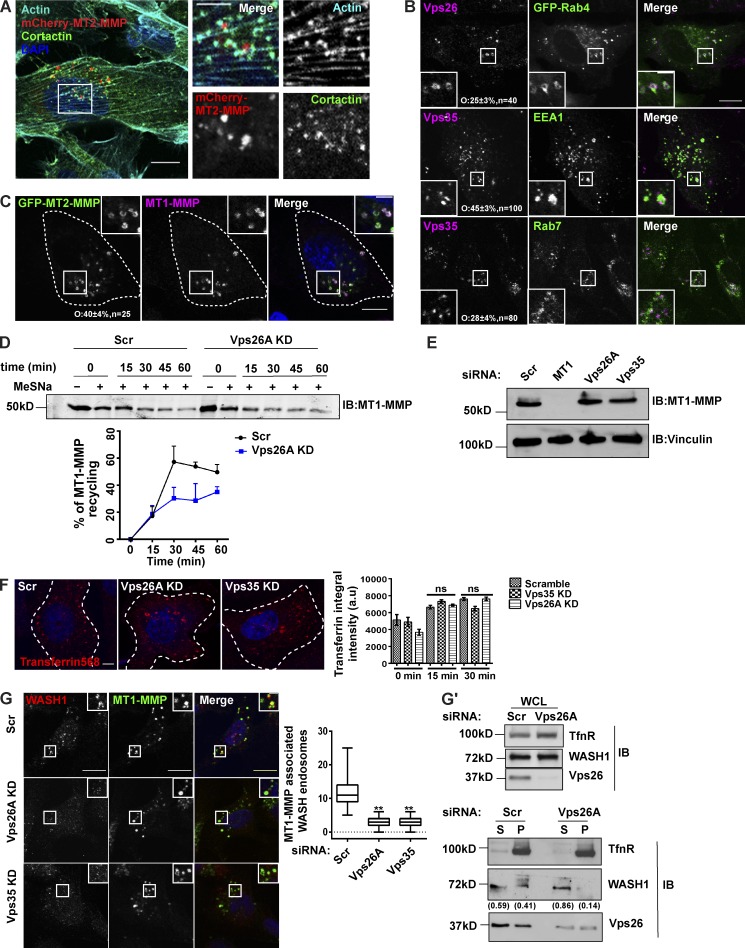
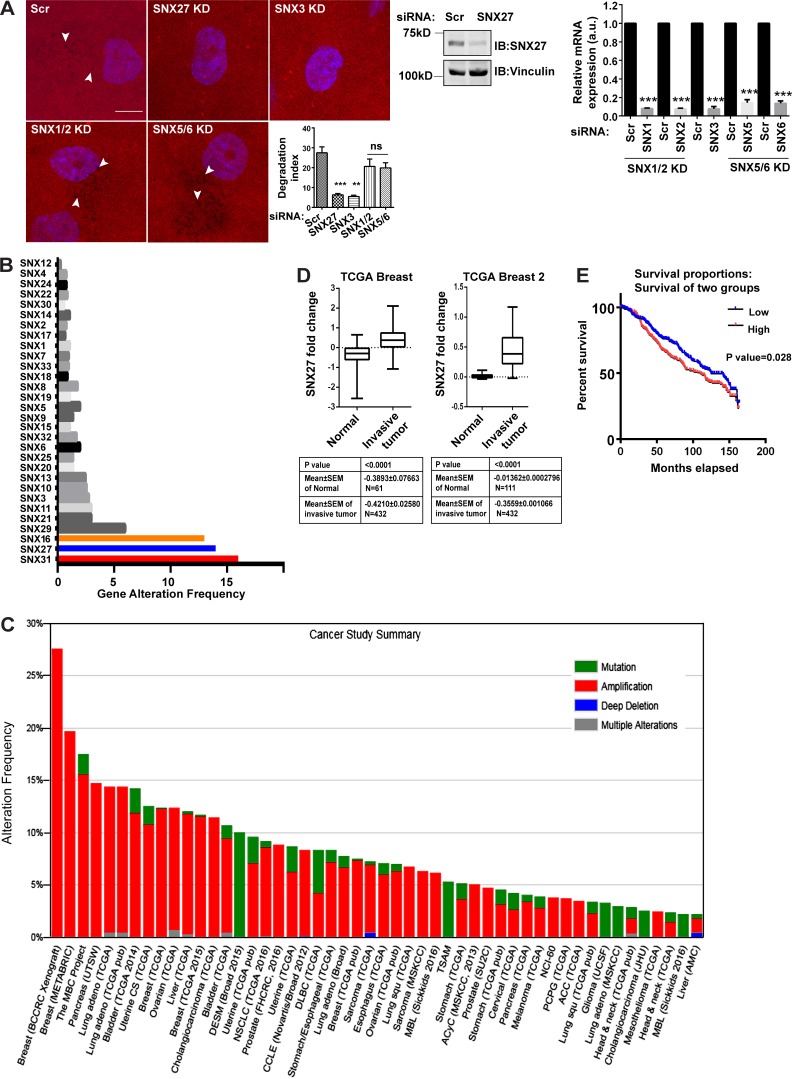
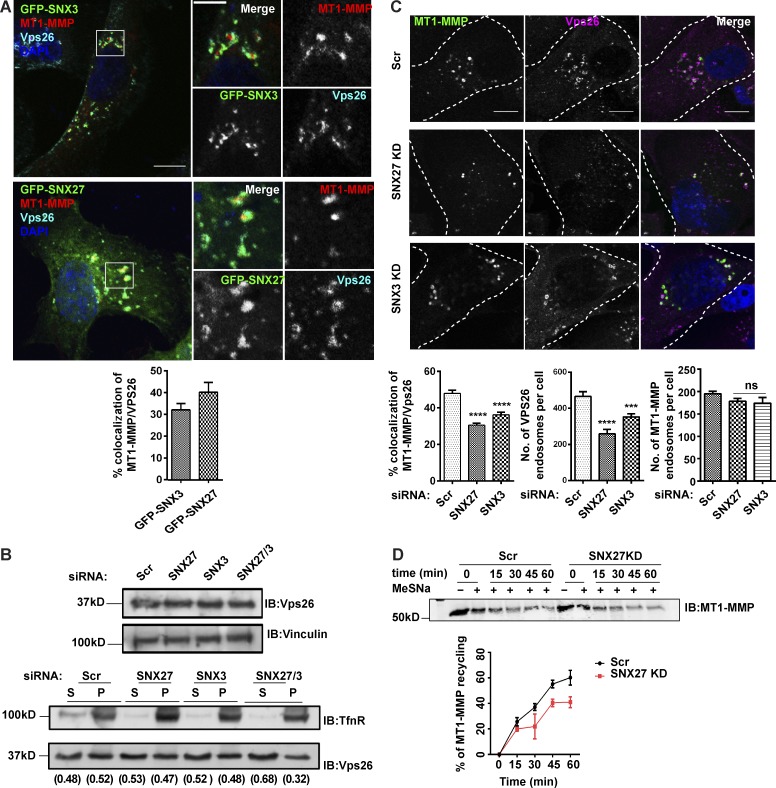
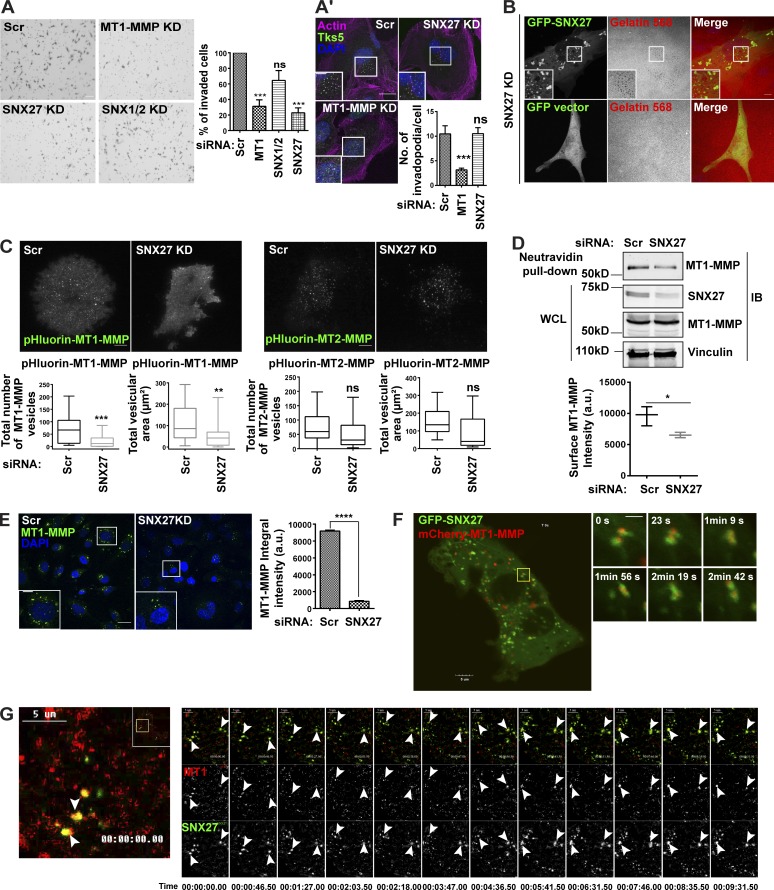
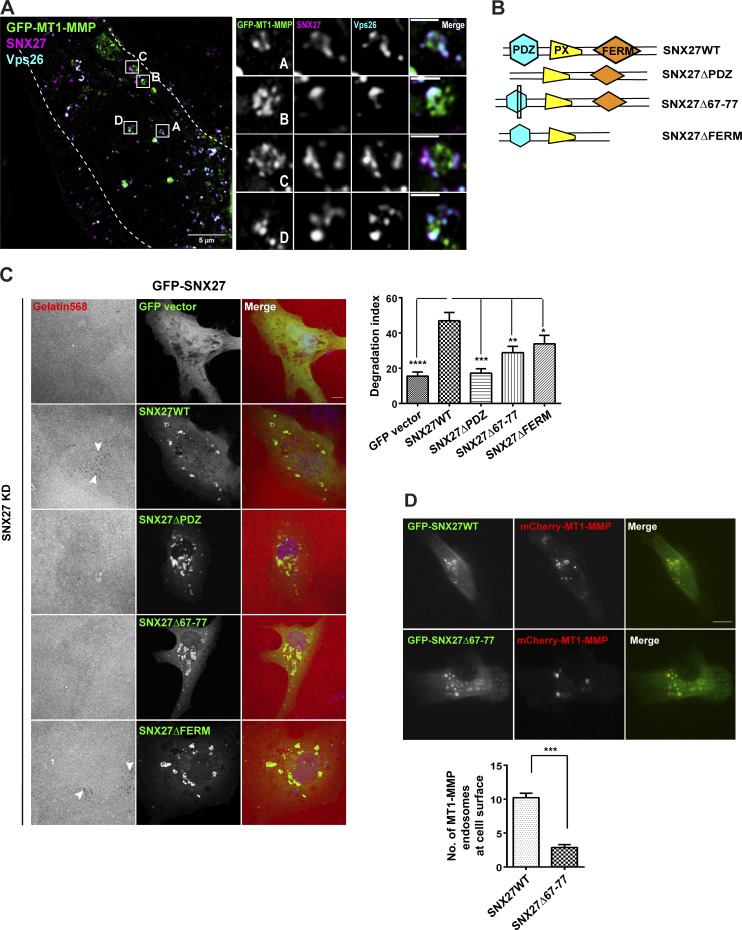
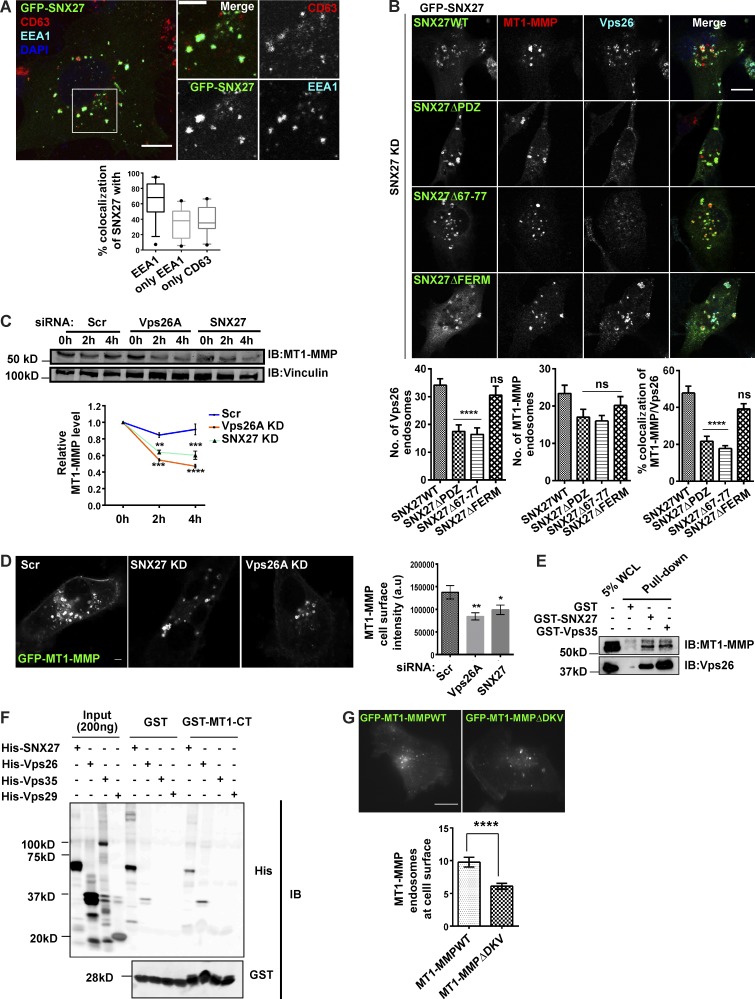
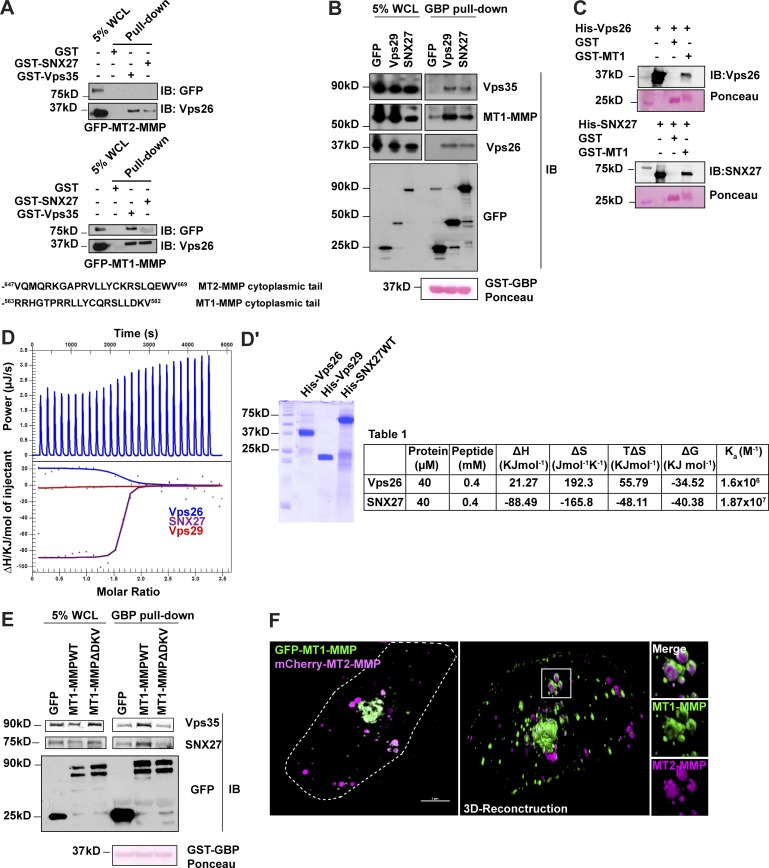
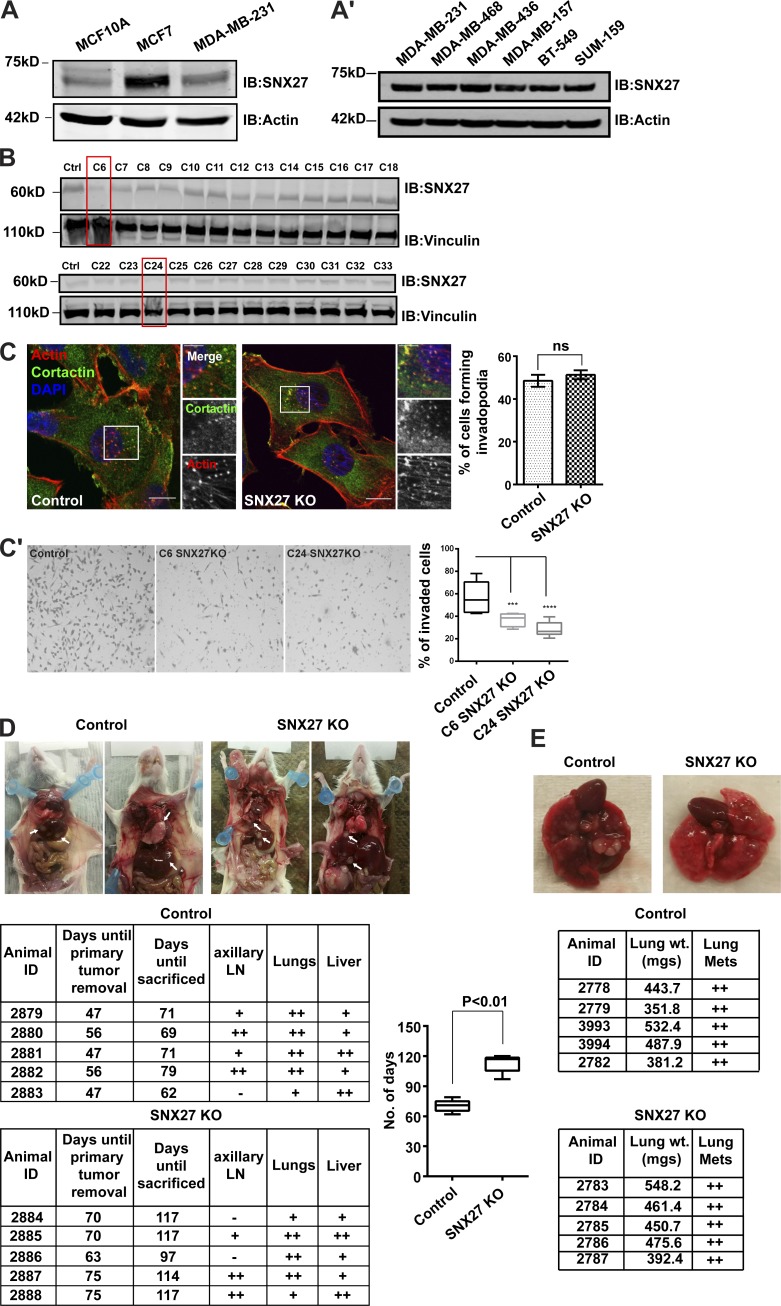
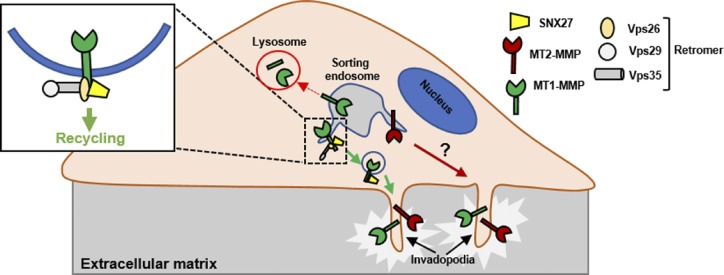
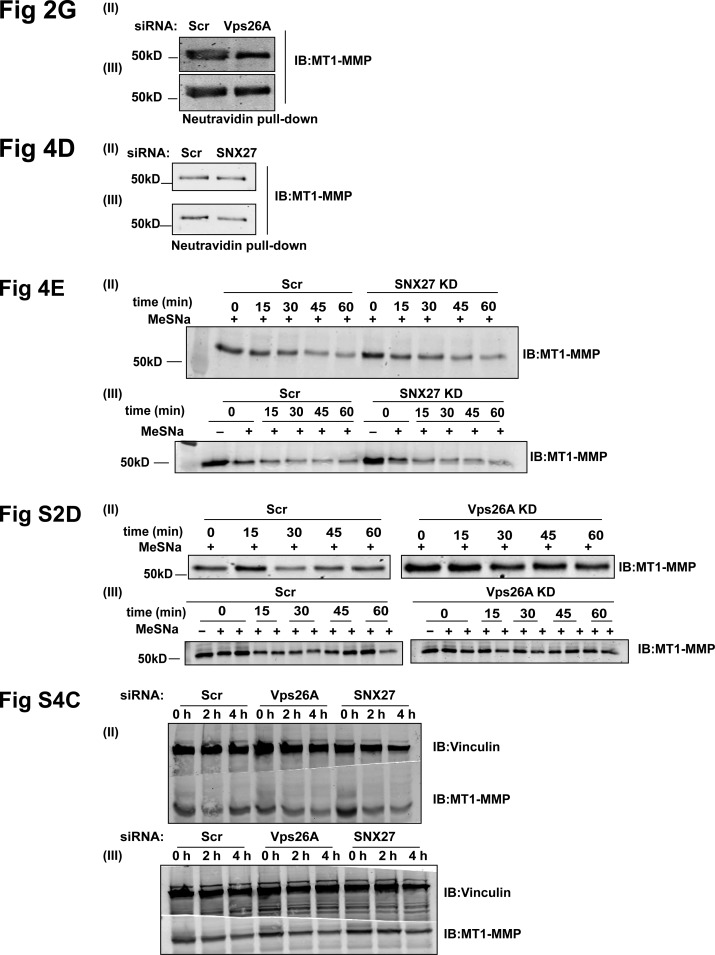
A variety of metastatic cancer cells use actin-rich membrane protrusions, known as invadopodia, for efficient ECM degradation, which involves trafficking of proteases from intracellular compartments to these structures. Here, we demonstrate that in the metastatic breast cancer cell line MDA-MB-231, retromer regulates the matrix invasion activity by recycling matrix metalloprotease, MT1-MMP. We further found that MT2-MMP, another abundantly expressed metalloprotease, is also invadopodia associated. MT1- and MT2-MMP showed a high degree of colocalization but were located on the distinct endosomal domains. Retromer and its associated sorting nexin, SNX27, phenocopied each other in matrix degradation via selectively recycling MT1-MMP but not MT2-MMP. ITC-based studies revealed that both SNX27 and retromer could directly interact with MT1-MMP. Analysis from a publicly available database showed SNX27 to be overexpressed or frequently altered in the patients having invasive breast cancer. In xenograft-based studies, SNX27-depleted cell lines showed prolonged survival of SCID mice, suggesting a possible implication for overexpression of the sorting nexin in tumor samples.


Figures

None
Graphical abstract
Figure 1.
Figure 1.
Retromer contributes to the invasive properties of breast cancer cells. (A) The KD efficiency of the respective genes was confirmed by Western blot or quantitative PCR (qPCR; n = 3). Values in the graph represent means ± SEM. Two-tailed Student’s t test, ** P < 0.01. (B) Retromer, MT1-MMP, or STX8 were depleted via siRNA and cells were seeded on Alexa Fluor 568–labeled gelatin-coated coverslips for 12 h. Degradation activity was quantified as degradation index, described in the Materials and methods (N = 4, n = 300; scale bar = 10 µm). Arrowheads represent degradation spots. One-way ANOVA, *** P < 0.001. The graph represents means ± SEM. (C) Cells depleted for indicated molecules were seeded on Matrigel-coated cell inserts and allowed to invade for 20 h. Invasive cells were counted and the percentage of invaded cells were plotted (N = 3, scale bar = 30 µm). One-way ANOVA, *** P < 0.001. The graph represents means ± SEM. (D and E) MDA-MB-231 cells treated with indicated siRNA were immunostained for invadopodia markers cortactin (D) or Tks5 (E) and stained with phalloidin to label actin. Images were analyzed on the confocal microscope and the percentage of cells forming invadopodia was quantified and plotted (N = 3, n = 400; scale bar = 10 µm, inset = 4 µm). The inset represents the actin-cortactin– or Tks5-actin–rich invadopodia. Invadopodia (Tks5/actin dots) per cell were counted (N = 3, n = 50). The graph represents means ± SEM. One-way ANOVA, ** P < 0.01, *** P < 0.001. N, number of experimental repeats.
Figure S1.
Figure S1.
Retromer-mediated abrogation of the invasive potential of MDA-MB-231 is a gene-specific effect. Gelatin degradation assay is a sensitive assay to measure matrix degradation activity of the cancer cells. (A) Cells were transfected with siRNA against Rab5A and RABGEF1. After 72 h, mRNA was isolated and qPCR was performed to measure the efficacy of the KD. Subsequently, similarly treated cells were seeded on fluorescent gelatin for 12 h, followed by fixation and DAPI staining to label nuclei. Cells were imaged with a confocal microscope and the degradation index was analyzed. Arrowheads represent the degradation dots. (N = 3, n = 100; scale bar = 10 µm). The graphs represent means ± SEM. One-way ANOVA, *** P < 0.001, **** P < 0.0001. (B) To ensure the target specificity by siRNA, individual oligos were used to deplete Vps26A. Cells were transfected with the four oligos targeting different sites on Vps26A and subjected to immunoblotting. Of the four, oligo1 and oligo3 could efficiently deplete the Vps26A. (C and D) Similarly treated cells were subjected to gelatin degradation (C) or Matrigel invasion (D), where cells were seeded on fluorescent gelatin or Matrigel-coated cell inserts, respectively. The degradation index and percentage of invaded cells were analyzed and plotted. (N = 3, scale bars = 30 pixels). Values in the graphs represent means ± SEM. One-way ANOVA, * P < 0.05, ** P < 0.001, *** P < 0.001. N, number of experimental repeats.
Figure 2.
Figure 2.
Retromer mediates cell surface recycling of MT1-MMP but not MT2-MMP. (A–C) MT2-MMP is overexpressed and invadopodia associated in MDA-MB-231 cells. (A) Indicated cells were lysed and immunoblotted with anti–MT2-MMP and anti-actin antibody. (B) Control and MT2-MMP–depleted cells were lysed and immunoblotted to determine KD levels. Subsequently, cells were seeded on Matrigel-coated cell inserts and allowed to invade for 20 h. The number of invasive cells was quantified and plotted (N = 3, scale bars = 50 µm). Values in the graph represent means ± SEM. Two-tailed Student’s t test, *** P < 0.001. (C) MDA-MB-231 cells transiently expressing mCherry–MT2-MMP and GFP-Tks5 were stained with phalloidin and DAPI and analyzed with a confocal microscope. The number of MT2-MMP endosomes positive for Tks5 was counted and plotted (N = 3, n = 45; scale bar = 10 µm, inset = 4 µm). The insets show the MT2-MMP vesicles positive for actin and Tks5. (D) Confocal images of MDA-MB-231 cells that were stably expressing GFP–MT1-MMP or transfected with mCherry–MT2-MMP and immunostained to label Vps26 and Vps35 (N = 3, n = 40; scale bars = 10 µm, inset = 4 µm). The insets show Vps35 and Vps26 localizing on the MT1-MMP or MT2-MMP endosomes. (E) MDA-MB-231 cells depleted of Vps26A and Vps35 were transfected with pHluorin–MT1-MMP or pHluorin–MT2-MMP and analyzed by TIRF microscopy. The number of vesicles and their total area was quantified and plotted (N = 3, n = 40; scale bars = 10 µm). Values are means ± SEM. One-way ANOVA, ** P < 0.01, *** P < 0.001, **** P < 0.0001. (F) mCherry–MT1-MMP and GFP-Vps29 were cotransfected in MDA-MB-231 cells and subjected to live-cell confocal imaging (Scale bars = 5 µm, inset = 4 µm). The insets show the multiple events over time where retromer is associated with the MT1-MMP endosome. (G) Surface levels of MT1-MMP were measured in control and Vps26A-depleted cells. Biotin labeling was done at 4°C for 45 min, followed by quenching and lysing the cells (refer to Materials and methods). The lysate was allowed to bind with Neutravidin beads followed by immunoblotting. Quantification of immunoblots was done to measure intensity of MT1-MMP (refer to Materials and methods; N = 3). Additional blots in Fig. S5. Values in the graph are means ± SEM. Two-tailed Student’s t test, * P < 0.05. WCL, whole cell lysate. (H) The KD efficiency of VAMP7 was measured by qPCR (N = 3). Two-tailed Student’s t test. MDA-MB-231 cells treated with indicated siRNA were surface labeled with MT1-MMP antibody at 4°C for 1 h, shifted to 37°C, fixed at 15 min, and immunostained to label with EEA1. Cells positive for MT1-MMP and EEA1 were counted and the percentage of cells that endocytosed MT1-MMP antibody was calculated. The insets represent the MT1-MMP–positive EEA1 endosome. The arrowheads in the enlarged insets show the internalized MT1-MMP antibody inside the vesicles positive for EEA1. (N = 4, n = 300; scale bars = 10 µm, inset = 4 µm). The graphs represent three independent experiments; values are means ± SEM. One-way ANOVA, * P < 0.05, ** P < 0.01. N, number of experimental repeats.
Figure S2.
Figure S2.
Retromer is distributed on early and late endosomes carrying MT1-MMP and recruits WASH on these endosomes in MDA-MB-231 cells. MT2-MMP is invadopodia associated. (A) mCherry–MT2-MMP–expressing cells were fixed and labeled for endogenous cortactin and phalloidin. Images were acquired using a confocal microscope. The insets show a magnification of the boxed region where MT2-MMP endosomes are localizing on actin-cortactin–rich invadopodia. (N = 3, n = 40; scale bars = 10 µm, inset = 4 µm). Retromer localization on Rab4-, Rab7-, and EEA1-positive endosomes. (B) GFP-RAB4–expressing cells were fixed and labeled with endogenous Vps26. Also, untransfected MDA-MB-231 cells were fixed and immunolabeled using antibodies against Vps35 and EEA1 or Vps35 and Rab7. Images captured by confocal microscope were analyzed and percentage of colocalization was calculated. (N = 3, n = 50; scale bars = 10 µm, inset = 4 µm). (C) MDA-MB-231 cells stably expressing GFP–MT2-MMP were fixed and labeled with endogenous MT1-MMP. Cells were imaged with a confocal microscope and analyzed for percentage of colocalization. The insets show the colocalization of MT1-MMP and the MT2-MMP endosomes. (N = 3, n = 40; scale bars = 10 µm, inset = 4 µm). (D) Cells treated with Scr siRNA (control) and siRNA targeting Vps26A were labeled with biotin at 4°C after 72 h of treatment. Cells were then shifted to 37°C for 30 min to allow endocytosis and then reshifted to 4°C and treated with or without MeSNa (0 min + or −, respectively) to remove noninternalized biotin. They were again shifted to 37°C, followed by MeSNa treatment to measure the recycling of biotin-labeled surface protein, and were harvested at indicated recycling time points (15, 30, 45, and 60 min). Lysates were incubated with Neutravidin beads; bound protein was eluted and separated on SDS gel. Immunoblotting was performed and the level of MT1-MMP intensity was quantified by densitometric analysis of Western blots. For each time point, percentage of recycling was analyzed by calculating the relative loss of MT1-MMP intensity measured at 0 min, followed by MeSNa-treated recycling time points. See Materials and methods for details. Three independent experiments were performed (N = 3; additional blots in Fig. S5). (E) MDA-MB-231 cells were transfected with the siRNA against MT1-MMP, Vps26A, and Vps35. After 72 h, cells were lysed and subjected to immunoblotting to measure levels of MT1-MMP. Vinculin was used as a loading control. (F) Vps26A- or Vps35-depleted cells were serum-starved for 2 h and labeled with transferrin at 4°C for 30 min. Unbound transferrin was removed by PBS washing and cells were shifted to 37°C and fixed at indicated time points. Transferrin uptake was calculated by measuring the integral intensity of the transferrin (N = 3, n = 300; scale bar = 10 µm). The graph represents means ± SEM. One-way ANOVA. (G) Cells treated with indicated siRNA were fixed 72 h after transfection and immunostained with antibodies against MT1-MMP and WASH1, followed by imaging and quantification of the number of WASH-associated MT1-MMP endosomes. The insets show the WASH1 puncta on the MT1-MMP endosomes. (N = 4, n = 400; scale bar = 10 µm, inset = 4 µm). The graph represents means ± SEM. One-way ANOVA, ** P < 0.01. (G) After 72-h treatment with indicated siRNA, cells were lysed and proceeded for immunoblotting to detect WASH1 expression. Transferrin receptor was used as a control. Similarly, treated cells were snap-frozen to isolate the membrane and soluble fraction. Protein fractions were separated on SDS gel, followed by immunoblotting against the transferrin receptor and WASH antibody. Transferrin receptor was used as a control to ensure the quality of the membrane fractionation. The distribution of WASH1 in membrane and supernatant was quantified by comparing the ratio of supernatant to total protein, i.e., Sup+pellet, or to that of pellet to total protein for each condition. The numbers between the blots represent the quantified values. N, number of experimental repeats.
Figure 3.
Figure 3.
SNX27 contributes to MDA-MB-231 matrix degradation and is overexpressed in invasive breast tumor patients. (A) MDA-MB-231 cells were treated with indicated siRNA for SNX27 and SNX3 and codepleted of SNX1/2 or SNX5/6 and efficacy of gene silencing was detected by immunoblotting, where vinculin was used as a loading control, or qPCR (N = 3). Two-tailed Student’s t test, *** P < 0.001. Subsequently, gelatin degradation assay was performed as mentioned above and the degradation index was analyzed (N = 3, n = 250; scale bar = 10 µm). The graph represents three independent experiments; values are means ± SEM. One-way ANOVA, ** P < 0.01, *** P < 0.001. Arrowheads represent degradation dots. (B) From the publicly available database cBio Cancer Genomics Portal, various breast tumor datasets were analyzed for alteration frequency among SNX family members. (C) The SNX27 alteration frequency, types of alteration, availability of mutation analysis, and copy number alteration in the various tumor cohorts are shown. (D) SNX27 expression in normal versus invasive breast carcinoma reported in two different TCGA datasets was analyzed for fold change. (E) In the Curtis dataset, samples were separated for high and low SNX27 expression populations (n = 534). The Kaplan-Meier survival curve was plotted among these separated populations. N, number of experimental repeats.
Figure S3.
Figure S3.
SNX3 and SNX27, retromer-associated SNXs, contribute to matrix degradation in MDA-MB-231 and endosomal recruitment of retromer. (A) GFP-SNX3– or GFP-SNX27–expressing MDA-MB-231 cells were fixed and immunolabeled with an antibody against Vps26 and MT1-MMP. Images were acquired on the confocal microscope and analyzed for percentage of colocalization of Vps26 and MT1-MMP with SNX3 or SNX27. Magnified boxed regions show SNX3 or SNX27 localizing on MT1-MMP and Vps26 endosomes (N = 3, n = 46; scale bar = 10 µm, inset = 4 µm). (B) Cells depleted of SNX3 or SNX27 or codepleted of SNX3 and SNX27 were lysed at 72 h after transfection and immunoblotted for Vps26. Similarly, siRNA-treated cells were lysed to separate membrane and soluble fraction and immunoblotted for Vps26 and transferrin receptor (TfnR), which is used as a control. The membrane distribution of Vps26 was analyzed by calculating the ratio of supernatant:pellet fraction for each condition independently. The numbers on the blot signify the ratio of supernatant to total protein, i.e., Sup+pellet, or to that of pellet to total protein for each condition. (C) MDA-MB-231 cells were transfected with control and indicated siRNAs. IF was proceeded 72 h after transfection using antibodies against Vps26 and MT1-MMP, imaged on a confocal microscope, and percentage of colocalization of MT1-MMP with Vps26 was calculated. Also, the number of Vps26 or MT1-MMP endosomes were counted and plotted. (N = 4, n = 300; scale bars = 10 µm). Values in the graphs represent means ± SEM. One-way ANOVA, *** P < 0.001, **** P < 0.0001. (D) Cells transfected with siRNA targeting SNX27 were labeled with cleavable biotin and biotinylation was performed (as described earlier) to measure MT1-MMP recycling. MT1-MMP recycling percentage was analyzed by quantifying the relative loss of MT1-MMP at each time point with respect to the total endocytosed population captured at 0 min. Three independent experiments were performed (N = 3; additional blots in Fig. S5). N, number of experimental repeats.
Figure 4.
Figure 4.
SNX27 carries MT1-MMP to the cell surface and contributes to its recycling. (A) Matrigel invasion assay was performed (as described earlier) in MDA-MB-231 cells transfected with control siRNA and siRNA targeting indicated molecules. The number of invasive cells was counted. One-way ANOVA, *** P < 0.001. The graph represents means ± SEM. (A) Cells depleted for SNX27 were fixed after 72 h and immunostained with Tks5. Phalloidin was used to label actin. Images were acquired with a confocal microscope and the number of Tks5/actin (invadopodia) per cell were counted (N = 3, n = 30; scale bars = 10 µm, inset = 4 µm). The insets display the Tks5/actin-rich structures. One-way ANOVA, *** P < 0.001. The graph represents means ± SEM. (B) Cells were treated with siRNA against SNX27 and 60 h after treatment were transfected with GFP vector or GFP-SNX27WT. After 12 h, cells were fixed and imaged using a confocal microscope (N = 3, n = 60; scale bars = 10 µm, inset = 4 µm). The insets show the degradation spots. (C) MDA-MB-231 cells were transfected with control siRNA and siRNA targeting SNX27. 60 h after transfection, pHluorin–MT1-MMP and pHluorin–MT2-MMP were transfected. Cells were allowed to adhere to the gelatin-coated imaging dishes for 6 h and then subjected to TIRF microscopy. The number of vesicles and their total area was quantified and plotted. (N = 3, n = 30; scale bars = 10 µm). Two-tailed Student’s t test, **P < 0.01, *** P < 0.001. The graphs represent means ± SEM. (D) Cells were treated with control and SNX27 siRNA and subjected to biotinylation to measure only the surface MT1-MMP levels. Cells were labeled with noncleavable biotin and lysed, followed by binding with Neutravidin beads (refer to Materials and methods). The graph represents the quantification from the three individual blots for surface MT1-MMP levels (N = 3; additional blots in Fig. S5). Two-tailed Student’s t test, * P < 0.05. (E) Cells were treated with control and SNX27 siRNA. After 72 h, cells were incubated with antibodies against MT1-MMP at 4°C for 1 h, then shifted to 37°C for 15 min. Cells were fixed, stained with DAPI, and imaged with a confocal microscope. The total intensity of the MT1-MMP vesicles per frame was calculated and plotted (N = 3, n = 3,000; scale bars = 10 µm, inset = 4 µm). The insets show the MT1-MMP antibody uptake by the cells. Two-tailed Student’s t test, **** P < 0.0001. The graph represents means ± SEM. (F) MDA-MB-231 cells were cotransfected with GFP-SNX27 and mCherry–MT1-MMP and 12 h after transfection were imaged by a live confocal microscope (N = 3, n = 25; scale bars = 5 µm, inset = 4 µm). The insets represent various events from different time points of the live-cell imaging, where SNX27 was associated with MT1-MMP vesicles. (G) MDA-MB-231 cells transfected with mCherry–MT1-MMP and GFP-SNX27 were subjected to TIRF microscopy, and endosome dynamics near the cell surface were analyzed using a TIRF microscope. The inset panel represents a series of frames (along with the time point) from a captured video (inset scale bars = 5 µm). Arrowheads show vesicles positive for SNX27 and MT1-MMP near the cell surface (N = 3, n = 12). N, number of experimental repeats; WCL, whole cell lysate.
Figure 5.
Figure 5.
SNX27 and retromer reside on the endosomal subdomains of MT1-MMP to facilitate its recycling and matrix degradation activity. (A) MDA-MB-231 cells expressing GFP–MT1-MMP were fixed, immunostained with an antibody against SNX27 and Vps26, and analyzed by super-resolution microscopy 3D-SIM. Boxed regions are labeled with the corresponding enlarged view of the inset on the right. These insets represent the multiple events of SNX27–retromer on MT1-MMP endosomal subdomains (N = 2, n = 6; scale bars = 5 µm, inset = 2 µm). (B) Diagrammatic representation of SNX27WT and its different deletion mutants used in the study. (C) MDA-MB-231 cells transfected with control siRNA or siRNA against SNX27 for 48 h and transfected again with siRNA-resistant GFP-fused SNX27WT and mutants. Cells were seeded on labeled gelatin and were fixed and stained with DAPI before the effect of gene suppression diminished. The degradation index was calculated as described earlier. Arrows represent the degradation dots. (N = 4, n = 200; scale bar = 10 µm). One-way ANOVA, * P < 0.05, ** P < 0.01, *** P < 0.001, **** P < 0.0001. The graph represents means ± SEM. (D) GFP-SNX27WT and GFP-SNX27Δ67–77 mutants were cotransfected along with mCherry–MT1-MMP. 12 h after transfection, cells were analyzed with a TIRF microscope. The number of MT1-MMP endosomes was counted (N = 3, n = 45; scale bar = 10 µm). Values in the graph represent mean ± SEM. Two-tailed Student’s t test, *** P < 0.001. N, number of experimental repeats.
Figure S4.
Figure S4.
Retromer associates with SNX27 on MT1-MMP endosomes and prevents its lysosomal degradation. SNX27 largely localizes on EEA1- and CD63-marked endosomes in MDA-MB-231. (A) GFP-SNX27 overexpressing cells were fixed and IF was performed where antibodies against EEA1 and CD63 were used. Cells were imaged with a confocal microscope and the percentage of colocalization was calculated. Insets show the SNX27 puncta associated with CD63 and/or EEA1 endosomes. (N = 3, n = 60; scale bar = 10 µm, inset = 4 µm). (B) Cells were treated with siRNA against SNX27 and indicated siRNA-resistant, GFP-tagged SNX27 constructs were expressed. Cells were fixed and labeled with antibodies against Vps26 and MT1-MMP, imaged with a confocal microscope, and the number of MT1-MMP or Vps26 endosomes, as well as the percentage of colocalization of MT1-MMP with Vps26, were analyzed. (N = 4, n = 200; scale bar = 10 µm). Values in the graphs represent means ± SEM. One-way ANOVA, **** P < 0.0001. (C) Vps26A and SNX27 expression were downregulated by transfecting MDA-MB-231 cells with the respective siRNA. 68 h after transfection, media with the cycloheximide was added to cells at a working concentration of 10 μg μl−1 and the lysate was collected at indicated time points. MT1-MMP protein levels were detected by immunoblotting with antibodies against MT1-MMP, and vinculin was used as a loading control (N = 3). For additional blots, see Fig. S5. Values in the graph represent means ± SEM. One-way ANOVA, ** P < 0.01, *** P < 0.001, **** P < 0.0001. (D) GFP–MT1-MMP stably expressing MDA-MB-231 cells were treated with siRNA against Vps26A and SNX27. Live-cell imaging was performed and MT1-MMP surface intensity was calculated (N = 3, n = 35; scale bar = 10 µm). Values in the graph represent means ± SEM. One-way ANOVA, * P < 0.05, ** P < 0.01. (E) Lysates from MDA-MB-231 cells allowed to bind recombinantly expressed and purified GST-fused SNX27 and Vps35 bound to sepharose beads. The protein complex was eluted and run on denatured SDS gel. Immunoblotting was performed against antibodies for MT1-MMP and Vps26. (F) Purified GST and the cytoplasmic tail of MT1-MMP (GST-MT1-CT) was incubated with indicated His-tagged proteins and pull-down was performed using glutathione sepharose beads. Precipitates were immunoblotted with an anti-His antibody. (G) GFP–MT1-MMPWT and ΔDKV mutants were expressed in MDA-MB-231 cells, and 8 h after transfection were monitored by TIRF microscope (N = 2, n = 35; scale bar = 10 µm). Values in the graph represent means ± SEM, **** P < 0.0001. N, number of experimental repeats; WCL, whole cell lysate.
Figure 6.
Figure 6.
Interaction analysis of SNX27 and retromer with MT1-MMP. (A) Lysates were prepared from MDA-MB-231 cells stably expressing GFP–MT1-MMP or GFP–MT2-MMP and allowed to bind recombinant GST-fused SNX27 and Vps35 immobilized on the glutathione sepharose beads. The protein complex was eluted and run on denatured SDS gel. Immunoblotting was performed using anti-GFP and anti-Vps26 antibodies. Amino acid sequences represent the cytoplasmic tail sequences of MT2-MMP and MT1-MMP. (B) GBP pull-down was performed with lysates from MDA-MB-231 cells expressing GFP vector, GFP-Vps29, and GFP-SNX27. Purified GST–GBP was incubated with glutathione sepharose beads and allowed to bind with the respective lysates for 1 h. Beads were washed and boiled, samples were run on SDS gel, and analysis was done by Western blotting. (C) Purified GST or GST-MT1 tails bound to glutathione sepharose beads were incubated with His-Vps26 or SNX27 in the binding buffer (see Materials and methods). Immunoblotting was done using an anti-Vps26 or anti-SNX27 antibody. (D) Calorimetric titrations of the MT1-MMP–CT peptide (400 µM) with His-tagged SNX27, Vps26, and Vps29 were performed. The upper panel shows raw ITC data for the Vps26 (40 µM) obtained from the 25 automated injections (2 µl in each injection). The lower panel shows integrated peak areas fitted using a 1:1 independent model of binding. (D′) The quality of proteins used in ITC was determined by running on SDS gel. Table 1 represents the analyzed thermodynamic parameters for the measured protein–peptide interaction. In all the performed experiments, the heat of ligand dilution was subtracted from the raw data to obtain normalized integrated heats. All ITC titrations were performed at 17°C. (E) MDA-MB-231 cells expressing the GFP–MT1-MMP or MT1-MMPΔDKV mutant were lysed and subjected to GBP pull-down as described above. Immunoblotting was performed using an antibody against Vps35, SNX27, and GFP. (F) Cells cotransfected with GFP–MT1-MMP and mCherry–MT2-MMP were fixed and analyzed by super-resolution microscopy, 3D-SIM. Images were obtained after 3D reconstruction (scale bar = 5 µm). The insets show the localization of MT1-MMP and MT2-MMP on discrete endosomal domains. WCL, whole cell lysate.
Figure 7.
Figure 7.
SNX27 depletion prolonged animal survival in a xenograft model. (A and A) For comparative analysis of SNX27 expression, indicated cell lines were lysed and subjected to immunoblotting using anti-SNX27 and anti-actin antibodies (loading control). (B) Different clones of MDA-MB-231 SNX27KO were obtained after cells were transfected with Cas9 protein complexed with either control sgRNA or sgRNA-targeted SNX27. The knockout efficiency was determined by immunoblotting for SNX27 and vinculin (loading control). (C) Control sgRNA transfected MDA-MB-231 cells and SNX27KO clones were seeded on gelatin-coated coverslips, and after fixation immunostained with the anti-cortactin antibody. DAPI and phalloidin were used to label the nucleus and actin, respectively. Images were acquired with a confocal microscope, and the number of cells forming invadopodia were plotted. The inset is representing the actin-cortactin–rich invadopodia. (N = 3, n = 80; scale bars = 10 µm, inset = 4 µm). The graph represents means ± SEM. Two-tailed Student’s t test. (C) Control MDA-MB-231 cells and two clones of SNX27KO MDA-MB-231 were plated on Matrigel-coated inserts. The cellular invasion was measured and plotted as described earlier (N = 3). The graph represents means ± SEM. One-way ANOVA, *** P < 0.001, **** P < 0.0001. (D and E) An equal number of control MDA-MB-231 cells and SNX27KO cells were injected in the mammary fat pad (D) or intravenous (E) of the mice. (D) 7 wk after primary tumor removal, animals were sacrificed upon developing secondary tumors, as determined by the general health condition of the animals. The number of days for which animals survived was plotted (n = 5 mice/group). Arrows indicate the presence of secondary metastatic tumors in the lungs and liver. (E) Intravenous injection of control MDA-MB-231 cells and SNX27KO cells was evaluated in terms of the appearance of lung metastasis and survival. Tables in D and E use a scoring system based on the level of tumor infiltration: +, at least one tumor nodule present; ++, multiple (three or more) nodules present. Two-tailed Student’s t test was used to determine significance. LN, lymph node; Mets, metastasis; N, number of experimental repeats.
Figure 8.
Figure 8.
The proposed model showing SNX27–retromer assembly directly interacts with MT1-MMP and mediates its recycling to invadopodia. MT1-MMP and MT2-MMP reside on distinct endosomal domains. Retromer and SNX27 localize on the subdomains of the sorting endosomes carrying MT1-MMP and MT2-MMP. This sorting machinery selectively recycles MT1-MMP and recognizes the cargo by directly interacting with its cytoplasmic tail.
Figure S5.
Figure S5.
Additional Western blots that were used for quantification are provided, along with their relevant figure numbers.

Similar articles

Cited by

References

    1. Al-Raawi D., Abu-El-Zahab H., El-Shinawi M., and Mohamed M.M.. 2011. Membrane type-1 matrix metalloproteinase (MT1-MMP) correlates with the expression and activation of matrix metalloproteinase-2 (MMP-2) in inflammatory breast cancer. Int. J. Clin. Exp. Med. 4:265–275. - PMC - PubMed
    1. Arighi C.N., Hartnell L.M., Aguilar R.C., Haft C.R., and Bonifacino J.S.. 2004. Role of the mammalian retromer in sorting of the cation-independent mannose 6-phosphate receptor. J. Cell Biol. 165:123–133. 10.1083/jcb.200312055 - DOI - PMC - PubMed
    1. Artym V.V., Zhang Y., Seillier-Moiseiwitsch F., Yamada K.M., and Mueller S.C.. 2006. Dynamic interactions of cortactin and membrane type 1 matrix metalloproteinase at invadopodia: defining the stages of invadopodia formation and function. Cancer Res. 66:3034–3043. 10.1158/0008-5472.CAN-05-2177 - DOI - PubMed
    1. Asano T., Tada M., Cheng S., Takemoto N., Kuramae T., Abe M., Takahashi O., Miyamoto M., Hamada J., Moriuchi T., and Kondo S.. 2008. Prognostic values of matrix metalloproteinase family expression in human colorectal carcinoma. J. Surg. Res. 146:32–42. 10.1016/j.jss.2007.02.011 - DOI - PubMed
    1. Beaty B.T., and Condeelis J.. 2014. Digging a little deeper: the stages of invadopodium formation and maturation. Eur. J. Cell Biol. 93:438–444. 10.1016/j.ejcb.2014.07.003 - DOI - PMC - PubMed

Publication types

MeSH terms