. 2020 Feb;182(2):219-231.
doi: 10.1530/EJE-19-0844.

Pancreatic alpha-cell mass across adult human lifespan

Affiliations

Pancreatic alpha-cell mass across adult human lifespan

Abu Saleh Md Moin et al. Eur J Endocrinol. 2020 Feb.

Abstract

Aim: To establish pancreatic alpha-cell mass in lean, non-diabetic humans over the adult lifespan, performed as a follow-up study to beta-cell mass across the adult human lifespan.

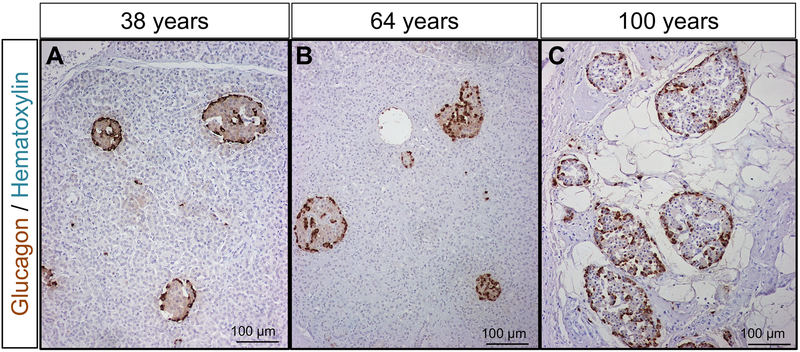
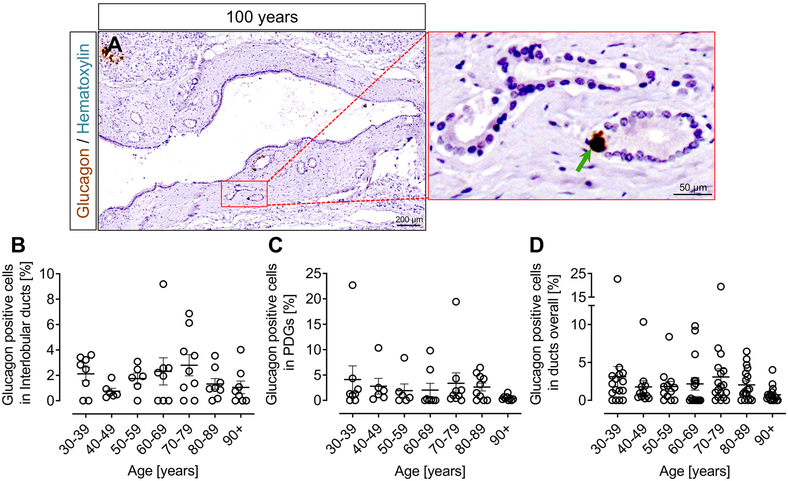
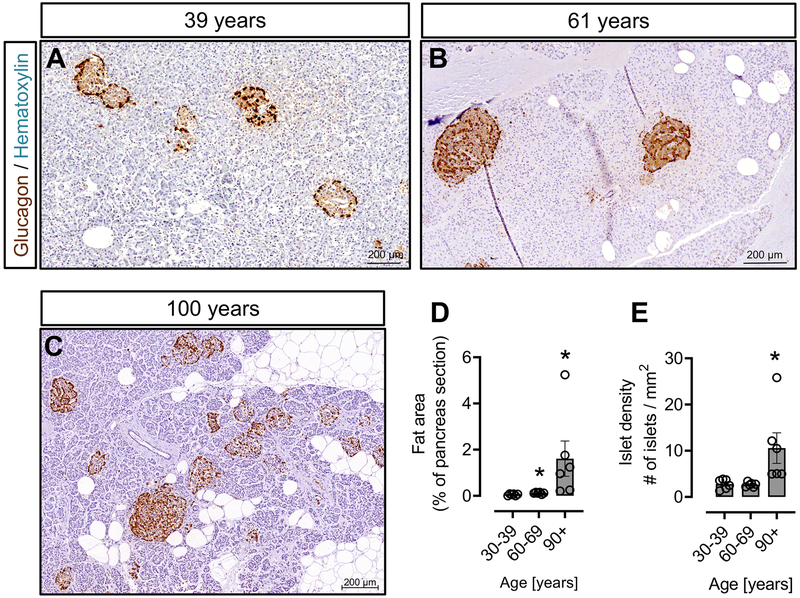
Methods: We examined human pancreatic autopsy tissue from 66 lean, non-diabetic individuals aged from 30 to 102 years, grouped into deciles: 3rd (30-39 years), 4th (40-49 years), 5th (50-59 years), 6th (60-69 years), 7th (70-79 years), 8th (80-89 years) and 9th deciles (90+ years). Sections of pancreas were immunostained for glucagon and analyzed for fractional alpha-cell area. Population-based pancreatic volume data were used to calculate alpha-cell mass.

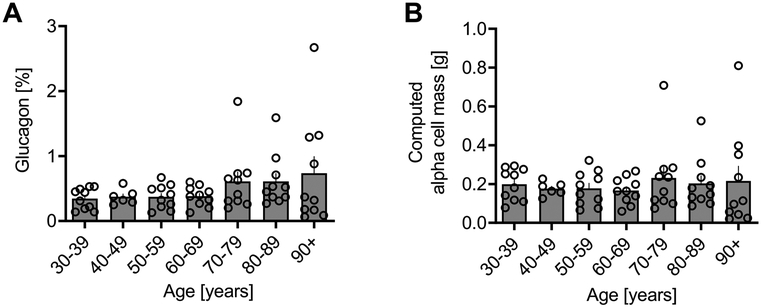
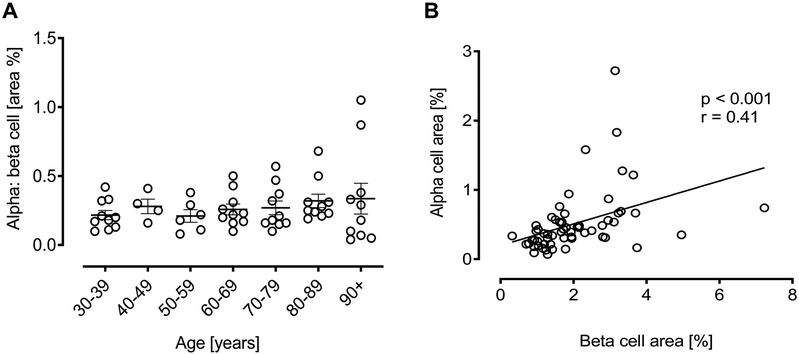
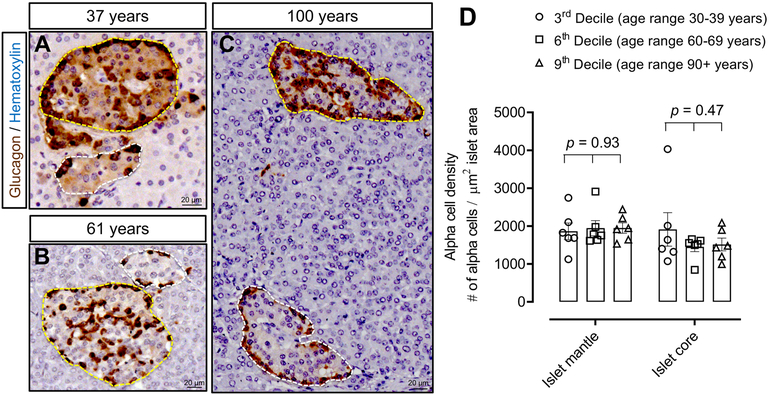
Results: With advanced age, the exocrine pancreas undergoes atrophy demonstrated by increased fat area (as % exocrine area) (0.05 ± 0.01 vs 1.6 ± 0.7% fat area of total exocrine pancreas, 3rd vs 9th decile, P < 0.05). Consequently, islet density increases with age (2.7 ± 0.4 vs 10.5 ± 3.3 islets/mm2, 3rd vs 9th decile, P < 0.05). Alpha-cell fractional area increases with advanced age (0.34 ± 0.05% vs 0.73 ± 0.26%, 3rd vs 9th decile, P < 0.05). However, alpha-cell mass remains constant at ~190 mg throughout the adult lifespan in lean, non-diabetic humans. Within islets, alpha-cell distribution between mantle and core is unchanged across deciles (1862 ± 220 vs 1945 ± 200 vs 1948 ± 139 alpha cells in islet mantle/mm2, 3rd vs 6th vs 9th decile, P = 0.93 and 1912 ± 442 vs 1449 ± 123 vs 1514 ± 168 alpha cells in islet core/mm2, 3rd vs 6th vs 9th decile, P = 0.47), suggesting that human islets retain their structural organization in the setting of age-related exocrine atrophy.

Conclusions: Consistent with our previous findings for beta-cell mass, alpha-cell mass remains constant in humans, even with advanced age. Pancreatic endocrine cells are much more robustly preserved than exocrine cells in aged humans, and islets maintain their structural integrity throughout life.


Conflict of interest statement

CONFLICT OF INTERESTS

There is no conflict of interests.

Figures

Figure 1.
Figure 1.. Histology of the exocrine pancreas and the distribution of alpha cells in islets across the adult human lifespan.
Representative sections of human pancreas stained for glucagon (DAB) and counterstained with hematoxylin from subjects who died at ages encompassing the adult human lifespan [38 years (A), 64 years (B) and 100 years (C)]. Of note, glucagon-positive cells are not confined to the periphery of the islet, but are distributed throughout the islet, and this distribution does not change with age. However, due to atrophy of the exocrine pancreas, the density of islets is increased from ~70 years onwards; this results in an increase in glucagon area % in human pancreas from subjects aged ~70 years or more, though alpha-cell mass remains constant. Scale bars, 100μm.
Figure 2.
Figure 2.. Alpha cell area% and computed alpha cell mass according to age in lean non-diabetic subjects.
Glucagon area %, shown as individual data with mean bar graphs (A), and computed alpha cell mass data also shown as individual data with mean bar graphs (B). Glucagon area % remained constant from the 30s decile through the 60s decile, after which glucagon area % increased due to the replacement of exocrine pancreas by fibrous tissue. By contrast, alpha-cell mass remained constant throughout the adult human lifespan.
Figure 3.
Figure 3.. Ratio of alpha to beta fractional area according to age in lean non-diabetic subjects.
The ratio of alpha to beta cell fractional area in each decile group (A). No change was seen in this ratio with advancing age. The positive correlation of pancreatic fractional area occupied by alpha or beta cells (B).
Figure 4.
Figure 4.. Glucagon positive cells in ducts according to age in lean non-diabetic subjects.
Representative sections of human pancreas stained for glucagon (DAB) and counterstained with hematoxylin to show glucagon expression in ducts in human (100 years) pancreas (A). Inset, higher power area of glucagon staining in pancreatic duct glands (PDGs) indicated by red square in the lower power image. The green arrow indicates glucagon immunoreactivity in a PDG. The percentage of glucagon positive cells in large ducts (B), PDGs (C) and in the combined ductal epithelial compartment (D). The percentage of glucagon positive cells present within the ductal epithelial compartment was unchanged across the adult lifespan. Scale bars, 200μm for lower power image and 50μm for higher power image.
Figure 5.
Figure 5.. Pancreas area occupied by fat and islet density across the human lifespan.
Representative sections of human pancreas stained for glucagon (DAB) and counterstained with hematoxylin to show the glucagon immunoreactivity, distribution of fat and density of islets from subjects who died at ages encompassing the adult human lifespan [39 years (A), 61 years (B) and 100 years (C)]. A significant increase in fat area was found in the 6th decile group (age range 60-69 years) and, even more so, in the 9th decile group (age range 90+ years) compared with the 3rd decile group (age range 30-39 years) (D). A significant increase in islet density was found in the 9th decile group (age range 90+ years) compared to both the 3rd decile group (age range 30-39 years) and the 6th decile group (age range 60-69 years) (E). Even though pancreatic atrophy is apparent from age 60, there was no change in islet density in the 6th decile group (age range 60-69 years) compared to 3rd decile group. *, p < 0.05, N = 6 cases per decile group. Scale bars, 200μm.
Figure 6.
Figure 6.. Distribution of alpha cells within islets across the human lifespan.
Representative images showing islets with alpha cells distributed in both the mantle and core regions of an islet in human subjects aged 37 years (A), 61 years (B) and 100 years (C). The density of alpha cells in the mantle or core regions did not change with advancing age across the human lifespan (D). Yellow dotted lines encircle islets with alpha cells distributed in both the mantle and core; white dotted lines encircle islets with alpha cells restricted to the mantle. Scale bars, 20μm.

References

    1. Nadal A, Quesada I & Soria B. Homologous and heterologous asynchronicity between identified alpha-, beta- and delta-cells within intact islets of Langerhans in the mouse. J Physiol 1999. 517 (Pt 1) 85–93. - PMC - PubMed
    1. Quesada I, Todorova MG & Soria B. Different metabolic responses in alpha-, beta-, and delta-cells of the islet of Langerhans monitored by redox confocal microscopy. Biophys J 2006. 90 2641–2650. - PMC - PubMed
    1. Dunning BE, Foley JE & Ahren B. Alpha cell function in health and disease: influence of glucagon-like peptide-1. Diabetologia 2005. 48 1700–1713. - PubMed
    1. Unger RH & Orci L. The essential role of glucagon in the pathogenesis of diabetes mellitus. Lancet 1975. 1 14–16. - PubMed
    1. Unger RH. Glucagon and insulin: a bihormonal system. Compr Ther 1976. 2 20–26. - PubMed