

Serum procalcitonin as an independent diagnostic markers of bacteremia in febrile patients with hematologic malignancies
- PMID: 31821331
- PMCID: PMC6903763
- DOI: 10.1371/journal.pone.0225765
Serum procalcitonin as an independent diagnostic markers of bacteremia in febrile patients with hematologic malignancies
Abstract
Background: Serum procalcitonin (PCT) and C-reactive protein (CRP) are biomarkers of infection. In patients with hematologic disorders with or without hematopoietic stem cell transplantation (HSCT), it is difficult to distinguish bloodstream infections from aseptic causes of febrile episodes. The objective of this study was to investigate diagnostic values of PCT and CRP in predicting systemic bacterial infection in patients with hematologic malignancies.
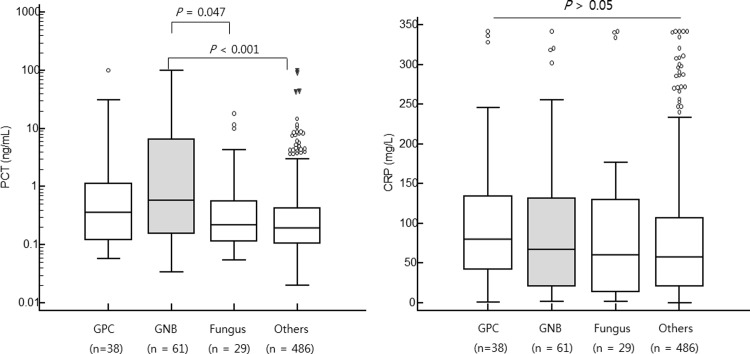
Methods: Clinical and laboratory data of 614 febrile episode cases from 511 patients were analyzed. Febrile episodes were classified into four groups: (1) culture-positive bacterial infection by Gram-positive cocci (GPC), (2) culture-positive bacterial infection by Gram-negative bacilli (GNB), (3) fungal infection, and (4) viral infection or a noninfectious etiology.
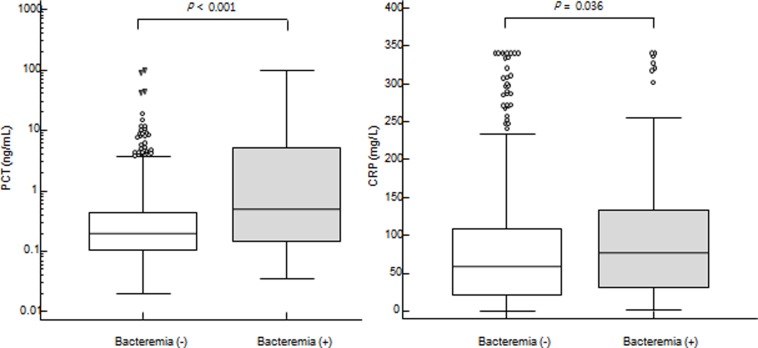
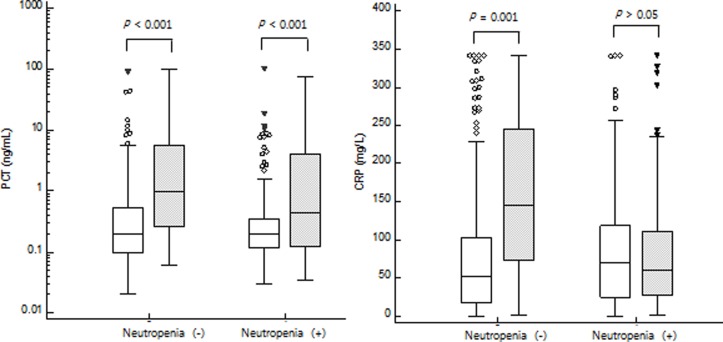
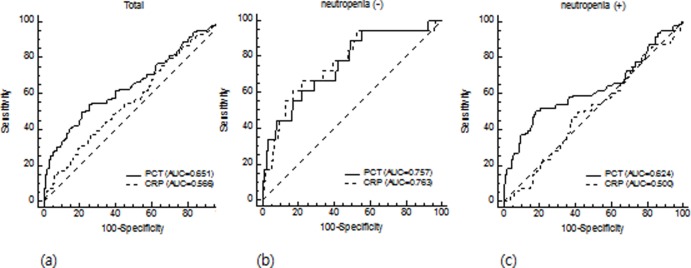
Results: Of 614 febrile cases, systemic bacterial infections were confirmed in 99 (16.1%) febrile episodes, including 38 (6.2%) GPC and 61 (9.9%) GNB infections. PCT levels were significantly higher in GNB infectious episodes than those in febrile episodes caused by fungal infection (0.58 ng/mL (95% CI: 0.26-1.61) vs. 0.22 ng/mL (0.16-0.38), P = 0.047). Bacterial infectious episodes showed higher PCT and CRP levels than non-bacterial events (PCT: 0.49 (0.26-0.93) ng/mL vs. 0.20 (0.18-0.22) ng/mL, P < 0.001; CRP: 76.6 (50.5-92.8) mg/L vs. 58.0 (51.1-66.5) mg/L, P = 0.036). For non-neutropenic febrile episodes, both PCT and CRP discriminated bacteremia from non-bacteremia. However, in neutropenic febrile episodes, PCT only distinguished bacteremia from non-bacteremia. In non-neutropenic episode, both PCT and CRP showed good diagnostic accuracy (AUC: 0.757 vs. 0.763). In febrile neutropenia, only PCT discriminated bacteremia from non-bacterial infection (AUC: 0.624) whereas CRP could not detect bacteremia (AUC: 0.500, 95% CI: 0.439-0.561, P > 0.05).
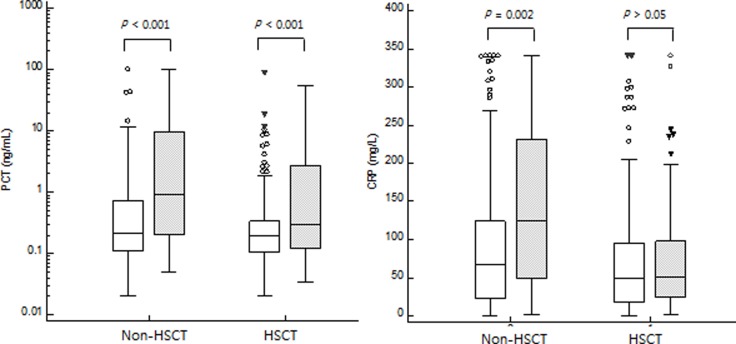
Conclusions: In this single-center observational study, PCT was more valuable than CRP for discriminating between bacteremia and non-bacteremia independent of neutropenia or HSCT.
Conflict of interest statement
This work was supported by the National Research Foundation of Korea (NRF) grant funded by the Korea government (MSIP) (NRF-2017R1A2B4011181), Republic of Korea. EONE Laboratories provided support in the form of salaries for YJ.K., but did not have any additional role in the study design, data collection and analysis, decision to publish, or preparation of the manuscript. This commercial affiliation had no role with any other relevant declarations relating to employment, consultancy, patents, products in development, or marketed products, etc. This does not alter out adherence to PLOS ONE policies on sharing data and materials. All authors declare all potential competing interests for the purposes of transparency.
Figures
Similar articles
-
Markers of bacteremia in febrile neutropenic patients with hematological malignancies: procalcitonin and IL-6 are more reliable than C-reactive protein.Eur J Clin Microbiol Infect Dis. 2004 Jul;23(7):539-44. doi: 10.1007/s10096-004-1156-y. Epub 2004 Jun 22. Eur J Clin Microbiol Infect Dis. 2004. PMID: 15221617
-
Comparison of CRP and procalcitonin for etiological diagnosis of fever during febrile neutropenia in hematology patients- an experience from a tertiary care center in Northern India.Blood Cells Mol Dis. 2020 Sep;84:102445. doi: 10.1016/j.bcmd.2020.102445. Epub 2020 May 14. Blood Cells Mol Dis. 2020. PMID: 32480243
-
The predictive value of procalcitonin, C-reactive protein, presepsin, and soluble-triggering receptor expressed on myeloid cell levels in bloodstream infections in pediatric patients with febrile neutropenia.Turk J Pediatr. 2019;61(3):359-367. doi: 10.24953/turkjped.2019.03.007. Turk J Pediatr. 2019. PMID: 31916713
-
The role of procalcitonin in febrile neutropenic patients: review of the literature.Infection. 2008 Oct;36(5):396-407. doi: 10.1007/s15010-008-7374-y. Epub 2008 Aug 30. Infection. 2008. PMID: 18759057 Review.
-
Serum procalcitonin and C-reactive protein levels as diagnostic markers for distinguishing bacterial infections from lupus flares in systemic lupus erythematosus: A systematic review and meta‑analysis.Int Immunopharmacol. 2021 Dec;101(Pt B):108304. doi: 10.1016/j.intimp.2021.108304. Epub 2021 Oct 30. Int Immunopharmacol. 2021. PMID: 34731783
Cited by
-
Regarding management of COVID-19 in acute lymphoblastic leukemia.Hematol Transfus Cell Ther. 2022 Jan-Mar;44(1):120-121. doi: 10.1016/j.htct.2021.08.004. Epub 2021 Nov 10. Hematol Transfus Cell Ther. 2022. PMID: 34786535 Free PMC article. No abstract available.
-
The Development and Validation of a Machine Learning Model to Predict Bacteremia and Fungemia in Hospitalized Patients Using Electronic Health Record Data.Crit Care Med. 2020 Nov;48(11):e1020-e1028. doi: 10.1097/CCM.0000000000004556. Crit Care Med. 2020. PMID: 32796184 Free PMC article.
-
2024 update of the AGIHO guideline on diagnosis and empirical treatment of fever of unknown origin (FUO) in adult neutropenic patients with solid tumours and hematological malignancies.Lancet Reg Health Eur. 2025 Jan 31;51:101214. doi: 10.1016/j.lanepe.2025.101214. eCollection 2025 Apr. Lancet Reg Health Eur. 2025. PMID: 39973942 Free PMC article. Review.
-
Procalcitonin as a Predictive Tool for Death and ICU Admission among Febrile Neutropenic Patients Visiting the Emergency Department.Medicina (Kaunas). 2022 Jul 23;58(8):985. doi: 10.3390/medicina58080985. Medicina (Kaunas). 2022. PMID: 35893100 Free PMC article.
-
Risk factors for nosocomial bloodstream infections in COVID-19 affected patients: protocol for a case-control study.Eur J Hosp Pharm. 2022 Mar;29(e1):e2-e5. doi: 10.1136/ejhpharm-2021-002776. Epub 2021 Aug 16. Eur J Hosp Pharm. 2022. PMID: 34400550 Free PMC article.
References
-
- Cho SY, Park YJ, Cho H, Park DJ, Yu JK, Oak HC, et al. Comparison of Enterococcus faecium Bacteremic Isolates from Hematologic and Non-hematologic Patients: Differences in Antimicrobial Resistance and Molecular Characteristics. Annals of laboratory medicine. 2018;38(3):226–34. Epub 2018/02/06. 10.3343/alm.2018.38.3.226 - DOI - PMC - PubMed
Publication types
MeSH terms
Substances
LinkOut - more resources
Full Text Sources
Medical
Research Materials
Miscellaneous
