

Temporal microstructure of dyadic social behavior during relationship formation in mice
- PMID: 31821344
- PMCID: PMC6903754
- DOI: 10.1371/journal.pone.0220596
Temporal microstructure of dyadic social behavior during relationship formation in mice
Abstract
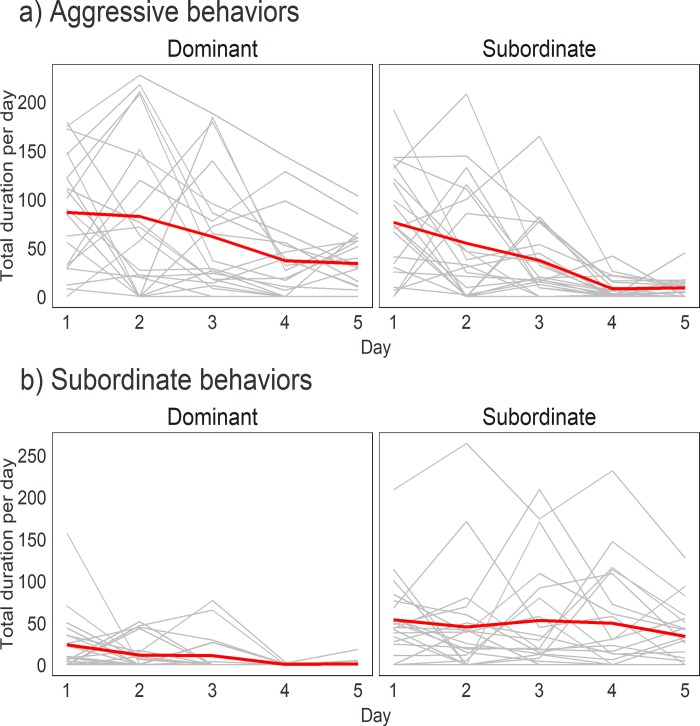
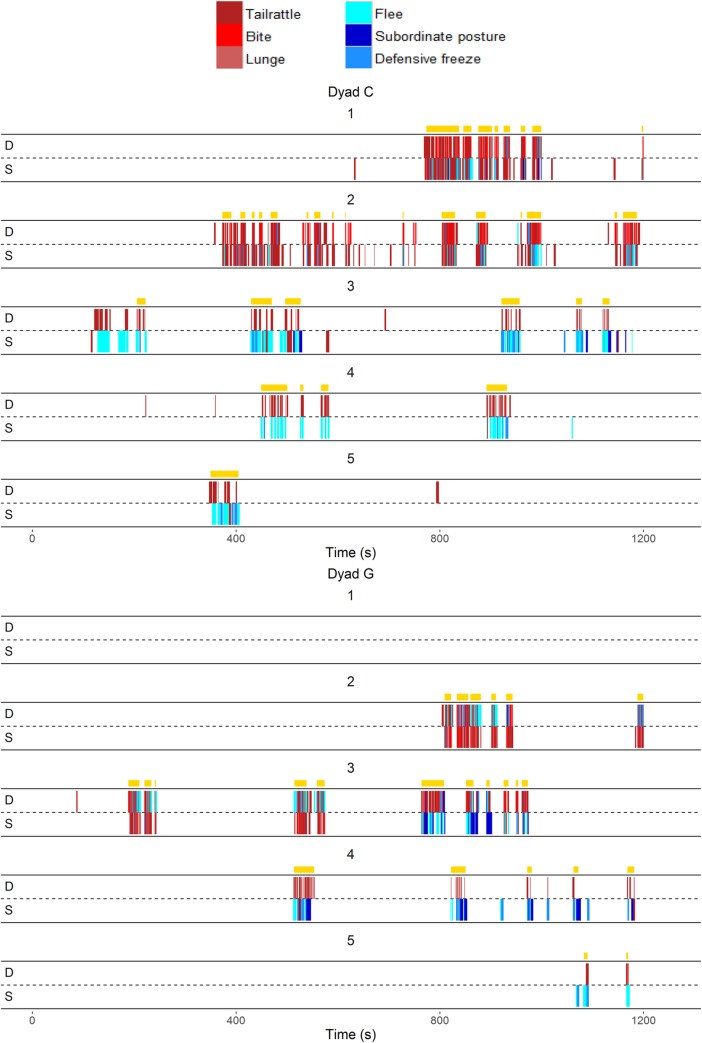
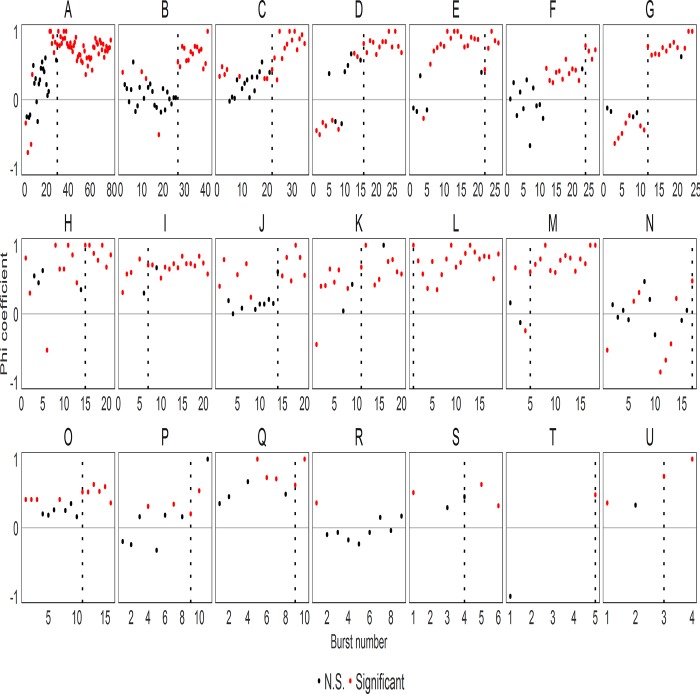
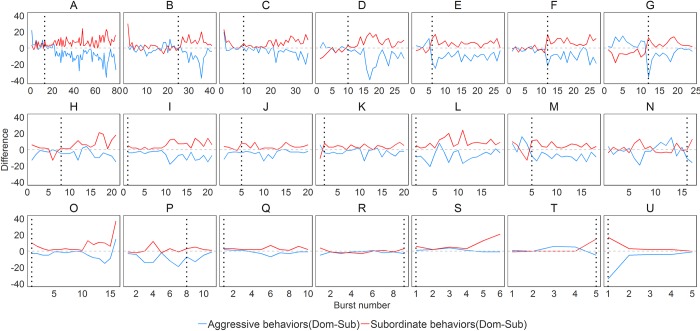
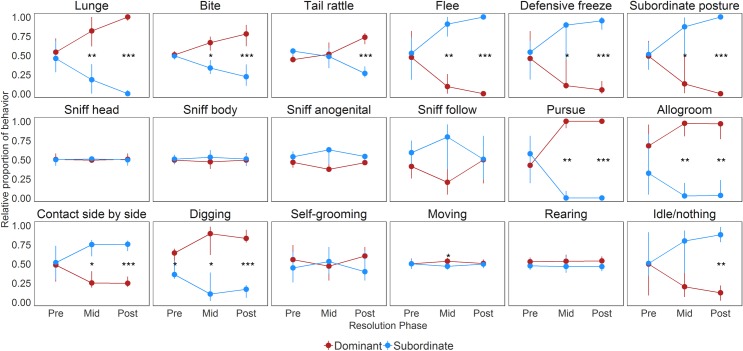
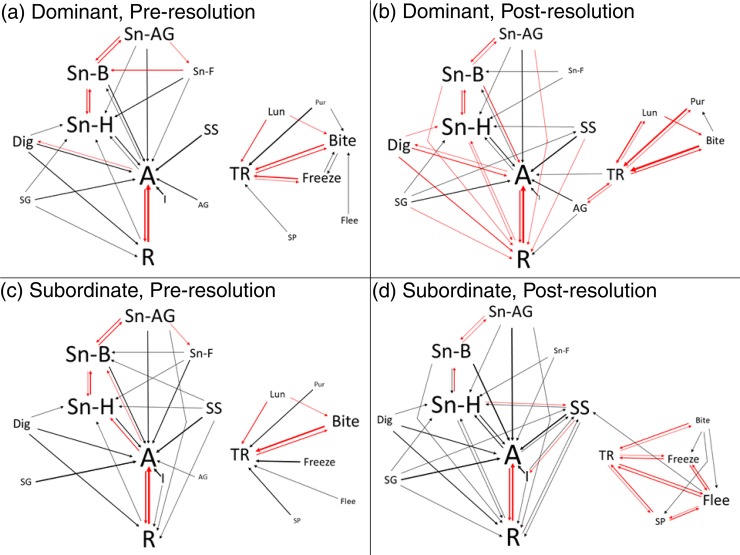
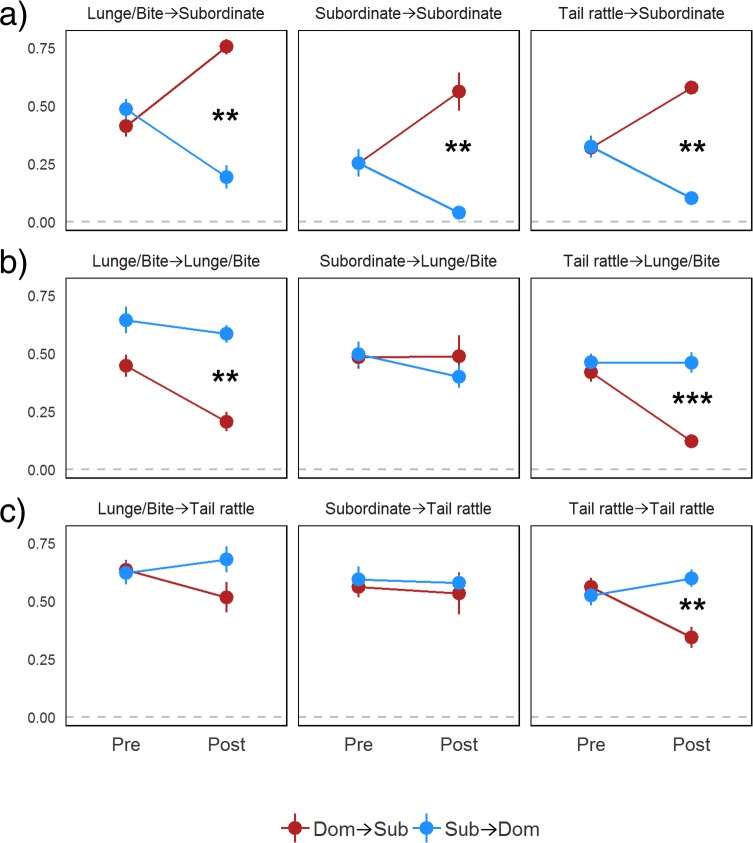
Socially competent animals must learn to modify their behavior in response to their social partner in a contextually appropriate manner. Dominant-subordinate relationships are a particularly salient social context for mice. Here we observe and analyze the microstructure of social and non-social behaviors as 21 pairs of outbred CD-1 male mice (Mus Musculus) establish dominant-subordinate relationships during daily 20-minute interactions for five consecutive days in a neutral environment. Firstly, using a Kleinberg burst detection algorithm, we demonstrate aggressive and subordinate interactions occur in bursting patterns followed by quiescent periods rather than being uniformly distributed across social interactions. Secondly, we identify three phases of dominant-subordinate relationship development (pre-, middle-, and post-resolution) by utilizing two statistical methods to identify stability in aggressive and subordinate behavior across these bursts. Thirdly, using First Order Markov Chains we find that dominant and subordinate mice show distinct behavioral transitions, especially between tail rattling and other aggressive/subordinate behaviors. Further, dominant animals engaged in more digging and allogrooming behavior and were more likely to transition from sniffing their partner's body to head, whereas subordinates were more likely to transition from head sniffing to side-by-side contact. Lastly, we utilized a novel method (Forward Spike Time Tiling Coefficient) to assess how individuals respond to the behaviors of their partner. We found that subordinates decrease their tail rattling and aggressive behavior in response to aggressive but not subordinate behavior exhibited by dominants and that tail rattling in particular may function to deescalate aggressive behavior in pairs. Our findings demonstrate that CD-1 male mice rapidly establish dominance relationships and modify their social and non-social behaviors according to their current social status. The methods that we detail also provide useful tools for other researchers wishing to evaluate the temporal dynamics of rodent social behavior.
Conflict of interest statement
The authors have declared that no competing interests exist.
Figures
Similar articles
-
Group composition affects male reproductive partitioning in a cooperatively breeding cichlid.Mol Ecol. 2008 Oct;17(19):4359-70. doi: 10.1111/j.1365-294x.2008.03920.x. Mol Ecol. 2008. PMID: 19378408
-
A model of social stress in dominant mice: effects on sociosexual behaviour.Physiol Behav. 2001 Jun;73(3):421-6. doi: 10.1016/s0031-9384(01)00460-7. Physiol Behav. 2001. PMID: 11438370
-
Sexual motivation in relation to social rank in pair-housed sows.Anim Reprod Sci. 2003 Jan 15;75(1-2):39-53. doi: 10.1016/s0378-4320(02)00208-7. Anim Reprod Sci. 2003. PMID: 12535583
-
Social Transitions Cause Rapid Behavioral and Neuroendocrine Changes.Integr Comp Biol. 2015 Aug;55(2):294-306. doi: 10.1093/icb/icv057. Epub 2015 Jun 1. Integr Comp Biol. 2015. PMID: 26037297 Free PMC article. Review.
-
A Systematic Review and Meta-Analysis of the Relationship Between Social Dominance Status and Common Behavioral Phenotypes in Male Laboratory Mice.Front Behav Neurosci. 2021 Jan 20;14:624036. doi: 10.3389/fnbeh.2020.624036. eCollection 2020. Front Behav Neurosci. 2021. PMID: 33551768 Free PMC article.
Cited by
-
Effects of ketamine on rat social behavior as analyzed by DeepLabCut and SimBA deep learning algorithms.Front Pharmacol. 2024 Jan 10;14:1329424. doi: 10.3389/fphar.2023.1329424. eCollection 2023. Front Pharmacol. 2024. PMID: 38269275 Free PMC article.
-
The dynamics of dominance: open questions, challenges and solutions.Philos Trans R Soc Lond B Biol Sci. 2022 Feb 28;377(1845):20200445. doi: 10.1098/rstb.2020.0445. Epub 2022 Jan 10. Philos Trans R Soc Lond B Biol Sci. 2022. PMID: 35000440 Free PMC article.
-
Knockdown of sexually differentiated vasopressin expression in the bed nucleus of the stria terminalis reduces social and sexual behaviour in male, but not female, mice.J Neuroendocrinol. 2022 Sep;34(9):e13083. doi: 10.1111/jne.13083. Epub 2022 Jan 2. J Neuroendocrinol. 2022. PMID: 34978098 Free PMC article.
-
Constitutive depletion of brain serotonin differentially affects rats' social and cognitive abilities.iScience. 2023 Jan 18;26(2):105998. doi: 10.1016/j.isci.2023.105998. eCollection 2023 Feb 17. iScience. 2023. PMID: 36798444 Free PMC article.
-
DomArchive: a century of published dominance data.Philos Trans R Soc Lond B Biol Sci. 2022 Feb 28;377(1845):20200436. doi: 10.1098/rstb.2020.0436. Epub 2022 Jan 10. Philos Trans R Soc Lond B Biol Sci. 2022. PMID: 35000444 Free PMC article.
References
-
- Cowan D, Gosling LM, Hudson J, Collins SA. Does behaviour after weaning affect the dominance status of adult male mice (Mus domesticus)? Behaviour. 1997;134: 989–1002.
Publication types
MeSH terms
LinkOut - more resources
Full Text Sources
