Comparative Study
. 2020 Apr 1;37(4):1070-1089.
doi: 10.1093/molbev/msz290.

Distinct Evolutionary Trajectories of Neuronal and Hair Cell Nicotinic Acetylcholine Receptors

Affiliations
Comparative Study

Distinct Evolutionary Trajectories of Neuronal and Hair Cell Nicotinic Acetylcholine Receptors

Irina Marcovich et al. Mol Biol Evol. .

Abstract

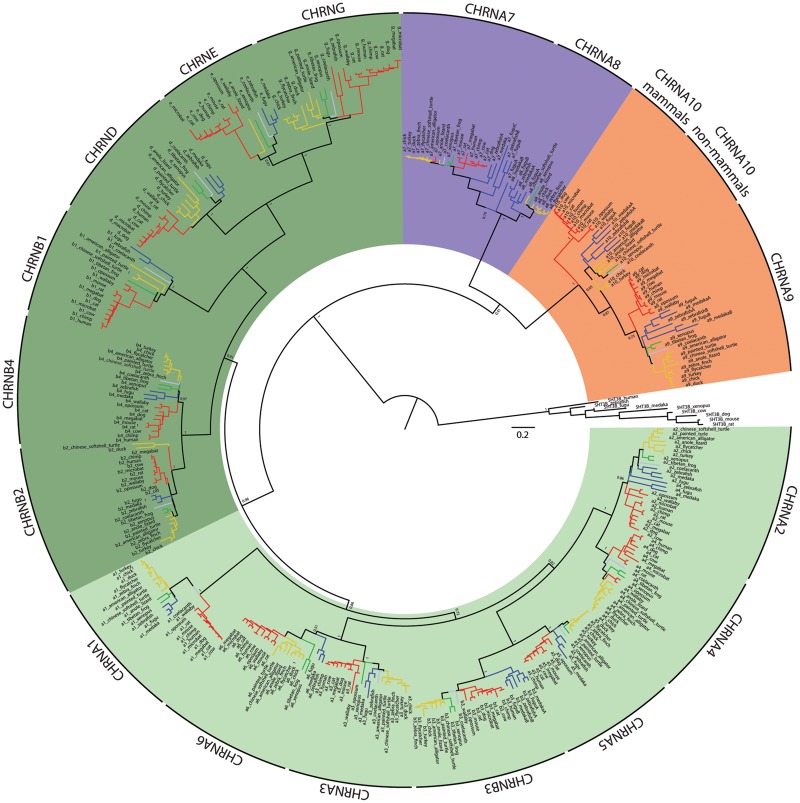
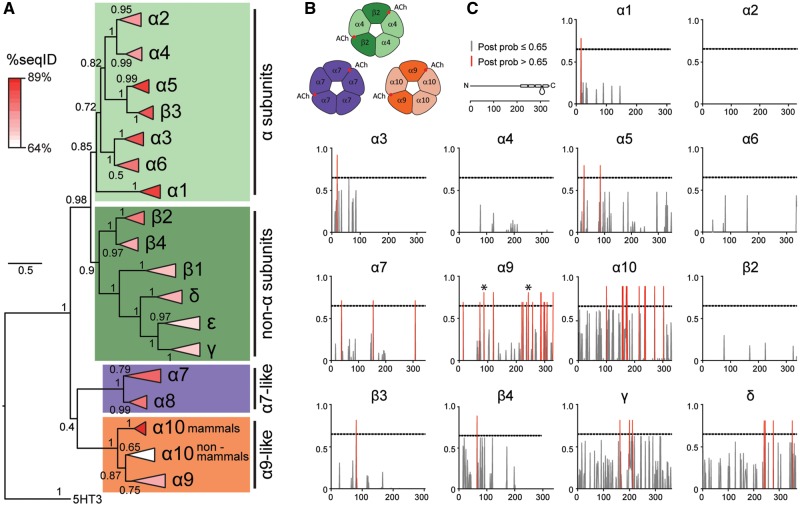
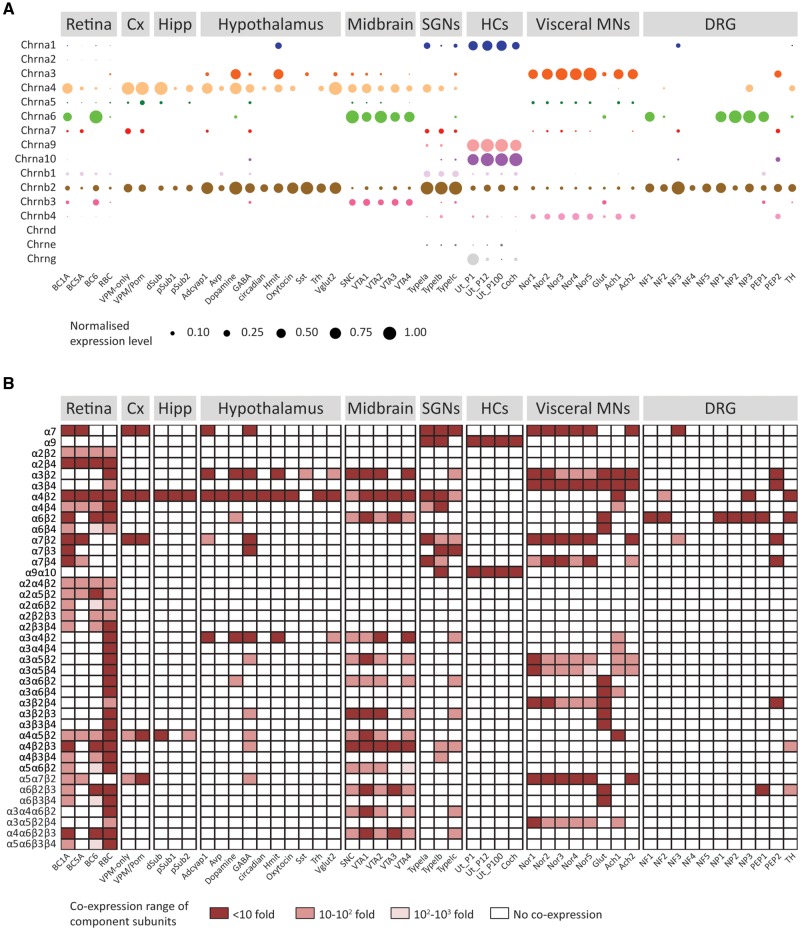
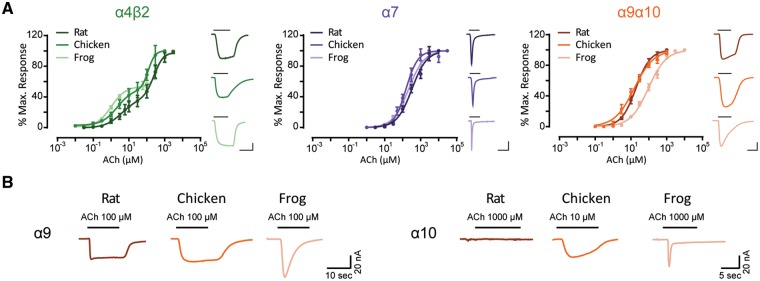
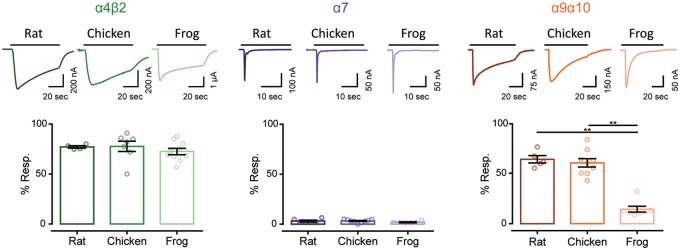
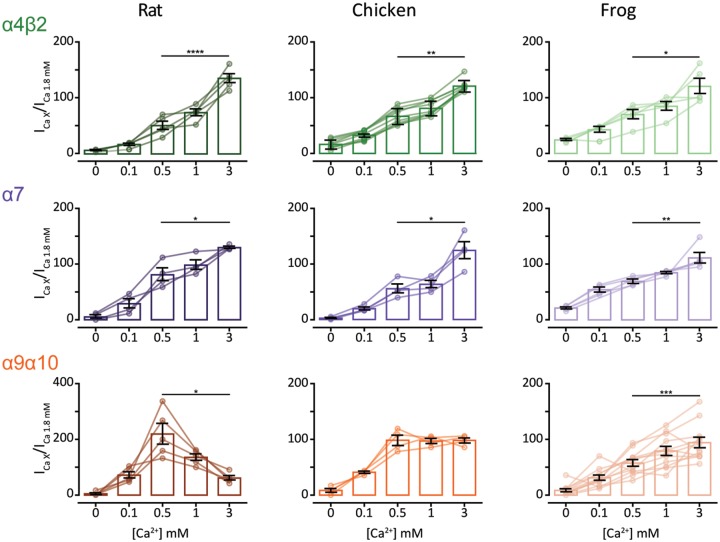
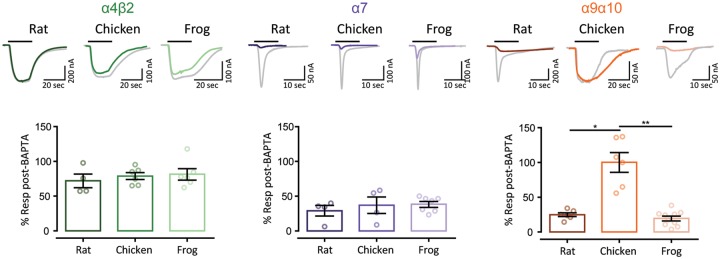
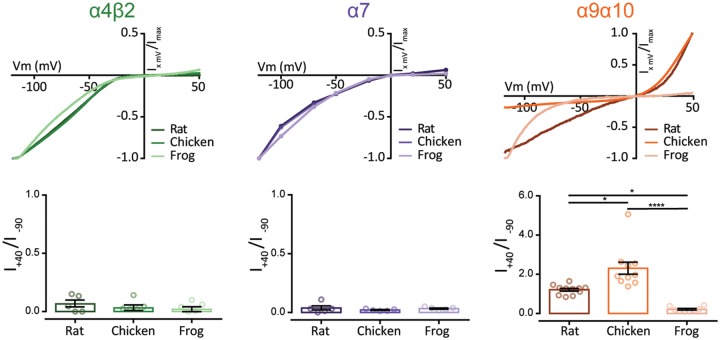
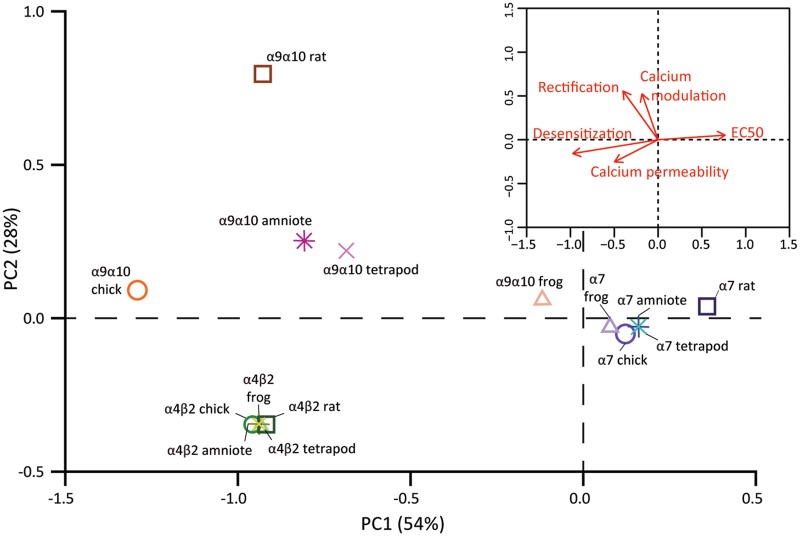
The expansion and pruning of ion channel families has played a crucial role in the evolution of nervous systems. Nicotinic acetylcholine receptors (nAChRs) are ligand-gated ion channels with distinct roles in synaptic transmission at the neuromuscular junction, the central and peripheral nervous system, and the inner ear. Remarkably, the complement of nAChR subunits has been highly conserved along vertebrate phylogeny. To ask whether the different subtypes of receptors underwent different evolutionary trajectories, we performed a comprehensive analysis of vertebrate nAChRs coding sequences, mouse single-cell expression patterns, and comparative functional properties of receptors from three representative tetrapod species. We found significant differences between hair cell and neuronal receptors that were most likely shaped by the differences in coexpression patterns and coassembly rules of component subunits. Thus, neuronal nAChRs showed high degree of coding sequence conservation, coupled to greater coexpression variance and conservation of functional properties across tetrapod clades. In contrast, hair cell α9α10 nAChRs exhibited greater sequence divergence, narrow coexpression pattern, and great variability of functional properties across species. These results point to differential substrates for random change within the family of gene paralogs that relate to the segregated roles of nAChRs in synaptic transmission.

Keywords: hair cells; molecular evolution; nicotinic receptors.


Figures

F<sc>Ig</sc>. 1.
FIg. 1.
Phylogenetic tree of vertebrate nAChR subunits. Complete minimum evolution phylogenetic tree corresponding to the collapsed tree shown in figure 2A, obtained with variation rates among sites modeled by a gamma distribution. Red branches, mammals; yellow branches, sauropsids; green branches, amphibians; blue branches, fish; light blue branches, coelacanth. Shadings denote the different groups of subunits: light greens, α subunits; dark green, non-α subunits; purple, α7-like subunits; orange, α9-like subunits. The tree was built using minimum evolution method and pairwise deletion for missing sites. The optimal tree with a sum of branch length of 47.32565515 is shown. For clarity, the percentage of replicate trees in which the associated taxa clustered together in the bootstrap test (1,000 replicates) are shown only next to the branches that separate different subunits. The tree is drawn to scale, with branch lengths in the same units as those of the evolutionary distances used to infer the tree.
F<sc>Ig</sc>. 2.
FIg. 2.
Hair cell nAChR subunits show greater sequence divergence than neuronal subunits. (A) Phylogenetic relationships between vertebrate nicotinic subunits. The branches corresponding to the same subunits of different species were collapsed up to the node at which one subunit separates from its closest neighbor. The complete tree is shown in figure 1. Triangles length denotes the divergence on sequence identity from the subunit node. Triangles were colored according to the average percentage of sequence identity between all pairs of sequences (%seqID, supplementary table S2, Supplementary Material online) within the branch. Shadings denote the different groups of subunits, as in figure 1: light greens, α subunits; dark green, non-α subunits; purple, α7-like subunits; orange, α9-like subunits. Numbers in branches indicate the bootstrap value obtained after 1,000 replicates. Scale bar indicates the number of amino acid substitutions per site. (B) Schematic diagrams of pentameric assemblies of neuronal and hair cell nAChRs. Red circles denote the positions of the ACh binding sites. (C) Posterior probabilities for type II functional divergence between mammalian and sauropsid clades, for each site along individual nAChR subunits. Gray lines, posterior probability ≤ 0.65. Red lines, posterior probability > 0.65. Diagram of a nAChR subunit extracellular, four transmembrane, and intracellular domains along amino acid position. * in α9 subunits plot, sites determinant of calcium permeability differences identified in Lipovsek et al. (2014).
F<sc>Ig</sc>. 3.
FIg. 3.
Hair cell nAChR subunits are coexpressed in inner ear hair cells, whereas neuronal subunits show widespread and variable coexpression patterns. (A) Normalized mean expression level for nAChR subunits across mouse neuronal and sensory cell types. Circle sizes indicate the mean expression level for each cell type, normalized to the highest value observed within each data set. For detailed explanations of individual cell types refer to main text, Materials and Methods section or the original publications. (B) Coexpression of subunits comprising known nAChR assemblies. Dark red squares, all component subunits are coexpressed within a 10-fold range of expression level. Light red squares, all component subunits are coexpressed within a 100-fold range of expression level. Pink squares, all component subunits are expressed within a 1,000-fold range of expression level. White squares, at least one subunit of that receptor assembly in not expressed in that cell type.
F<sc>Ig</sc>. 4.
FIg. 4.
Hair cell nAChRs show differences in ACh apparent affinity, whereas neuronal nAChRs have similar ACh sensitivity. (A) Concentration–response curves for neuronal α4β2 and α7 nAChRs and hair cell α9α10 nAChRs from three tetrapod species. Values are mean ± S.E.M. Lines are best fit to the Hill equation (n = 4–9). Representative responses evoked by 10 μM (α4β2, rat and chick α9α10) or 100 μM (α7, frog α9α10) ACh are shown next to their respective plots. Scale bars—α4β2: 100 nA, 10 s; α7: 50 nA, 5 s; α9α10: 50 nA, 10 s. (B) Representative responses evoked by ACh in oocytes injected with rat, chicken or frog homomeric α9 and α10 subunits (n = 2–20).
F<sc>Ig</sc>. 5.
FIg. 5.
Hair cell nAChRs differ in their desensitization patterns, whereas neuronal receptors show similar profiles. Top panels. Representative responses of α4β2, α7, and α9α10 nAChRs to a 60 s (for α4β2 and α9α10) or 30 s (for α7) application of 100 μM ACh for all α4β2 and amniotes α9α10, and 1 mM ACh for all α7 and frog α9α10 nAChRs. Bottom panels. Percentage of current remaining 20 s (α9α10 and α4β2) or 5 s (α7) after the peak response, relative to the maximum current amplitude elicited by ACh. Bars represent mean ± S.E.M., open circles represent individual oocytes (n = 4–10). **P <0.01, one-way ANOVA followed by Dunn’s test (α4β2 nAChRs) or Kruskal–Wallis followed by Holm Sidak’s test (α7 and α9α10 nAChRs).
F<sc>Ig</sc>. 6.
FIg. 6.
Extracellular Ca2+ potentiates neuronal nAChRs but differentially modulates α9α10 nAChRs. ACh response amplitude as a function of extracellular Ca2+ concentration. ACh was applied at near-EC50 concentrations (10 μM ACh for all α4β2, rat and chick α9α10 nAChRs and 100 μM ACh for all α7 and frog α9α10 nAChRs). Current amplitudes recorded at different Ca2+ concentrations in each oocyte were normalized to the response obtained at 1.8 mM Ca2+ in the same oocyte. Vh: −90 mV. Bars represent mean ± S.E.M., open circles represent individual oocytes (n = 4–12). *P <0.05, **P <0.01, ***P <0.005, and ****P <0.0001, paired t-test (rat and frog α4β2 nAChRs and all α7 and α9α10 nAChRs) or Wilcoxon matched pair test (chick α4β2 nAChR)—comparing 0.5 mM Ca2+ versus 3 mM Ca2+.
F<sc>Ig</sc>. 7.
FIg. 7.
Unlike neuronal nAChRs, α9α10 nAChRs exhibit differential Ca2+ contribution to the total inward current. Top panels. Representative responses to near-EC50 concentration of ACh (10 μM ACh for all α4β2 and amniotes α9α10 nAChRs and 100 μM ACh for all α7 and frog α9α10 nAChRs) in oocytes expressing α4β2, α7, and α9α10 nAChRs, before (gray traces) and after (color traces) a 3-h incubation with BAPTA-AM (Vh = −70 mV). Bottom panels. Percentage of the initial response remaining after BAPTA incubation. Bars represent mean ± S.E.M., open circles represent individual oocytes (n = 4–10). ****P <0.0001, one-way ANOVA followed by Dunn’s test (α4β2 and α7 nAChRs) or Kruskal–Wallis followed by Holm Sidak’s test (α9α10 nAChRs).
F<sc>Ig</sc>. 8.
FIg. 8.
Hair cell, but not neuronal, nAChRs show differential current–voltage relationships across species. Top panels. Representative IV curves obtained by the application of voltage ramps (−120 to +50mV, 2 s) at the plateau response to 3 μM ACh for α4β2 and α9α10 or by the application of 100 μM ACh at different holding potentials for α7 nAChRs. Values were normalized to the maximal agonist response obtained for each receptor. Bottom panels. Ratio of current amplitude at +40 mV relative to −90 mV for each oocyte. Bars represent mean ± S.E.M., open circles represent individual oocytes (n = 5–11). *P <0.05 and ****P <0.0001, one-way ANOVA followed by Dunn’s test (α4β2 and α7 nAChRs) or Kruskal–Wallis followed by Holm Sidak’s test (α9α10 nAChRs).
F<sc>Ig</sc>. 9.
FIg. 9.
Hair cell nAChRs show great functional divergence, whereas functional properties of neuronal nAChRs are conserved. PCA was conducted using the experimentally determined biophysical properties (table 1). Square symbols represent rat nAChRs, circles represent chick nAChRs, and triangles represent frog nAChRs, α4β2 nAChRs are shown in shades of green, α7 nAChRs in shades of purple, and α9α10 nAChRs in shades of orange. The projected locations of inferred functional states are shown for amniote (stars) and tetrapod (crosses) ancestral receptors and colored in yellow (α4β2), blue (α7), or pink (α9α10). Inset. Biplot of the relative contribution of the five biophysical properties to PC1 and PC2.

References

    1. Arellano RO, Woodward RM, Miledi R.. 1995. A monovalent cationic conductance that is blocked by extracellular divalent cations in Xenopus oocytes. J Physiol. 484(3):593–604. - PMC - PubMed
    1. Arendt D, Musser JM, Baker CVH, Bergman A, Cepko C, Erwin DH, Pavlicev M, Schlosser G, Widder S, Laubichler MD, et al. 2016. The origin and evolution of cell types. Nat Rev Genet. 17(12):744–757. - PubMed
    1. Barish ME. 1983. A transient calcium-dependent chloride current in the immature Xenopus oocytes. J Physiol. 342(1):309–325. - PMC - PubMed
    1. Burns JC, Kelly MC, Hoa M, Morell RJ, Kelley MW.. 2015. Single-cell RNA-Seq resolves cellular complexity in sensory organs from the neonatal inner ear. Nat Commun. 6(1):1–16. - PMC - PubMed
    1. Cembrowski MS, Phillips MG, DiLisio SF, Shields BC, Winnubst J, Chandrashekar J, Bas E, Spruston N.. 2018. Dissociable structural and functional hippocampal outputs via distinct subiculum cell classes. Cell 173(5):1280–1292.e1218. - PubMed

Publication types

Substances